

EPICE-HIV: An Epidemiologic Cost-Effectiveness Model for HIV Treatment
- PMID: 26870960
- PMCID: PMC4752501
- DOI: 10.1371/journal.pone.0149007
EPICE-HIV: An Epidemiologic Cost-Effectiveness Model for HIV Treatment
Abstract
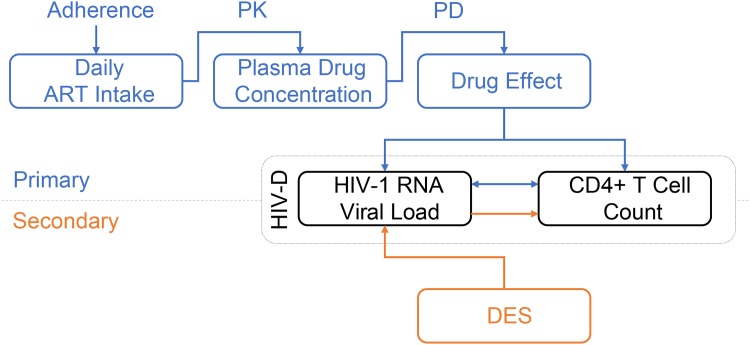
The goal of this research was to establish a new and innovative framework for cost-effectiveness modeling of HIV-1 treatment, simultaneously considering both clinical and epidemiological outcomes. EPICE-HIV is a multi-paradigm model based on a within-host micro-simulation model for the disease progression of HIV-1 infected individuals and an agent-based sexual contact network (SCN) model for the transmission of HIV-1 infection. It includes HIV-1 viral dynamics, CD4+ T cell infection rates, and pharmacokinetics/pharmacodynamics modeling. Disease progression of HIV-1 infected individuals is driven by the interdependent changes in CD4+ T cell count, changes in plasma HIV-1 RNA, accumulation of resistance mutations and adherence to treatment. The two parts of the model are joined through a per-sexual-act and viral load dependent probability of disease transmission in HIV-discordant couples. Internal validity of the disease progression part of the model is assessed and external validity is demonstrated in comparison to the outcomes observed in the STaR randomized controlled clinical trial. We found that overall adherence to treatment and the resulting pattern of treatment interruptions are key drivers of HIV-1 treatment outcomes. Our model, though largely independent of efficacy data from RCT, was accurate in producing 96-week outcomes, qualitatively and quantitatively comparable to the ones observed in the STaR trial. We demonstrate that multi-paradigm micro-simulation modeling is a promising tool to generate evidence about optimal policy strategies in HIV-1 treatment, including treatment efficacy, HIV-1 transmission, and cost-effectiveness analysis.
Conflict of interest statement
Figures


Similar articles
-
Cost-efficacy comparison among three antiretroviral regimens in HIV-1 infected, treatment-experienced patients.Clin Drug Investig. 2007;27(7):469-79. doi: 10.2165/00044011-200727070-00004. Clin Drug Investig. 2007. PMID: 17563127 Clinical Trial.
-
Study of the impact of HIV genotypic drug resistance testing on therapy efficacy.Verh K Acad Geneeskd Belg. 2001;63(5):447-73. Verh K Acad Geneeskd Belg. 2001. PMID: 11813503 Review.
-
Cost-effectiveness of DTG + ABC/3TC versus EFV/TDF/FTC for first-line treatment of HIV-1 in the United States.J Med Econ. 2015;18(10):763-76. doi: 10.3111/13696998.2015.1046878. J Med Econ. 2015. PMID: 25934146
-
Modeling the long-term outcomes and costs of HIV antiretroviral therapy using HIV RNA levels: application to a clinical trial.AIDS Res Hum Retroviruses. 1999 Apr 10;15(6):499-508. doi: 10.1089/088922299311024. AIDS Res Hum Retroviruses. 1999. PMID: 10221527
-
[Consensus document of Gesida and Spanish Secretariat for the National Plan on AIDS (SPNS) regarding combined antiretroviral treatment in adults infected by the human immunodeficiency virus (January 2012)].Enferm Infecc Microbiol Clin. 2012 Jun;30(6):e1-89. doi: 10.1016/j.eimc.2012.03.006. Epub 2012 May 23. Enferm Infecc Microbiol Clin. 2012. PMID: 22633764 Spanish.
Cited by
-
HIV Rapid Testing in the General Population and the Usefulness of PrEP in Ecuador: A Cost-Utility Analysis.Front Public Health. 2022 Jun 17;10:884313. doi: 10.3389/fpubh.2022.884313. eCollection 2022. Front Public Health. 2022. PMID: 35784197 Free PMC article.
-
Non-Nucleoside Reverse Transcriptase Inhibitors Join Forces with Integrase Inhibitors to Combat HIV.Pharmaceuticals (Basel). 2020 Jun 11;13(6):122. doi: 10.3390/ph13060122. Pharmaceuticals (Basel). 2020. PMID: 32545407 Free PMC article. Review.
-
Improving community mobilization in HIV treatment management: practical suggestions from patients in Brazil.Rev Panam Salud Publica. 2017 Nov 17;41:e119. doi: 10.26633/RPSP.2017.119. eCollection 2017. Rev Panam Salud Publica. 2017. PMID: 31384256 Free PMC article.
References
-
- Collaboration of Observational HIVEREiE, Lewden C, Bouteloup V, De Wit S, Sabin C, Mocroft A, et al. All-cause mortality in treated HIV-infected adults with CD4 >/ = 500/mm3 compared with the general population: evidence from a large European observational cohort collaboration. International journal of epidemiology. 2012; 41(2):433–45. 10.1093/ije/dyr164 - DOI - PubMed
-
- Cohen CJ, Andrade-Villanueva J, Clotet B, Fourie J, Johnson MA, Ruxrungtham K, et al. Rilpivirine versus efavirenz with two background nucleoside or nucleotide reverse transcriptase inhibitors in treatment-naive adults infected with HIV-1 (THRIVE): a phase 3, randomised, non-inferiority trial. The Lancet. 2011; 378(9787):229–37. - PubMed
-
- Cohen CJ, Wohl D, Arribas JR, Henry K, Van Lunzen J, Bloch M, et al. Week 48 results from a randomized clinical trial of rilpivirine/emtricitabine/tenofovir disoproxil fumarate vs. efavirenz/emtricitabine/tenofovir disoproxil fumarate in treatment-naive HIV-1-infected adults. Aids. 2014; 28:989–97. 10.1097/QAD.0000000000000169 - DOI - PubMed
Publication types
MeSH terms
Substances
LinkOut - more resources
Full Text Sources
Other Literature Sources
Medical
Research Materials
