

Mutual amplification of HNF4α and IL-1R1 composes an inflammatory circuit in Helicobacter pylori associated gastric carcinogenesis
- PMID: 26870992
- PMCID: PMC4905478
- DOI: 10.18632/oncotarget.7239
Mutual amplification of HNF4α and IL-1R1 composes an inflammatory circuit in Helicobacter pylori associated gastric carcinogenesis
Abstract
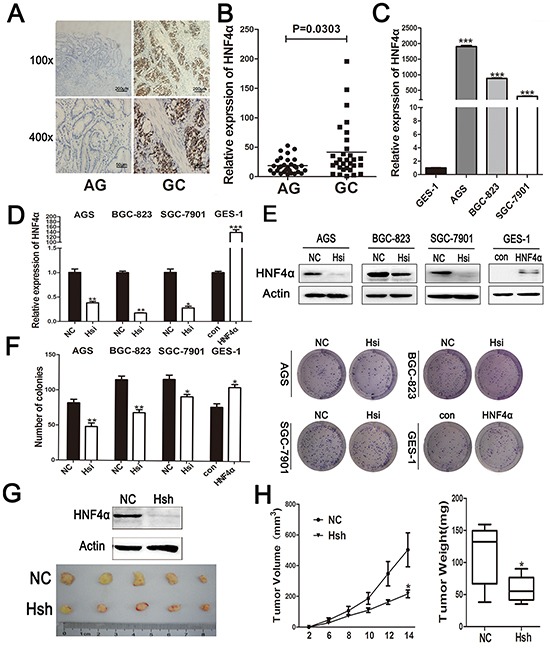
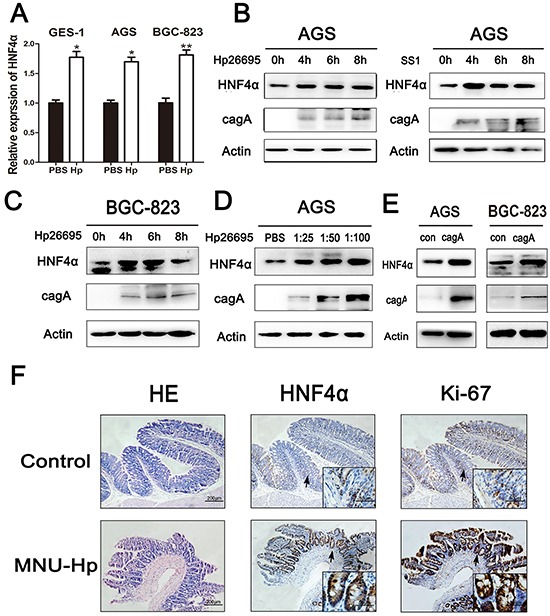
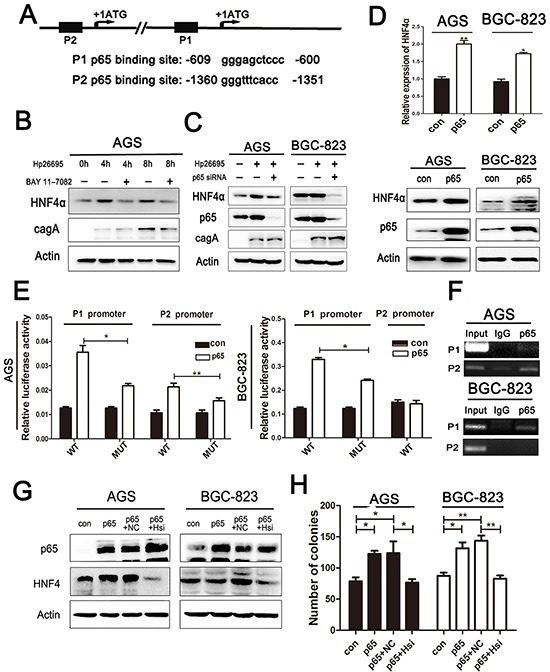
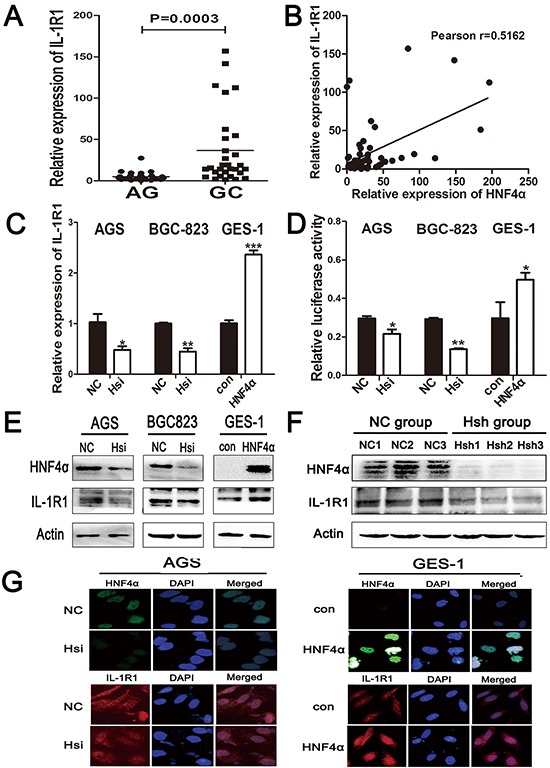
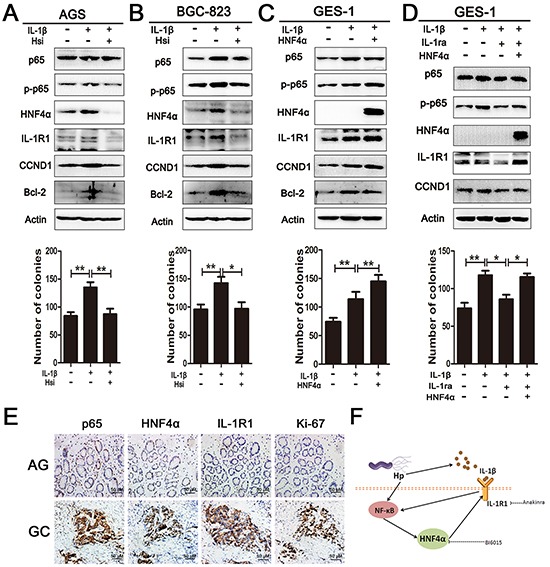
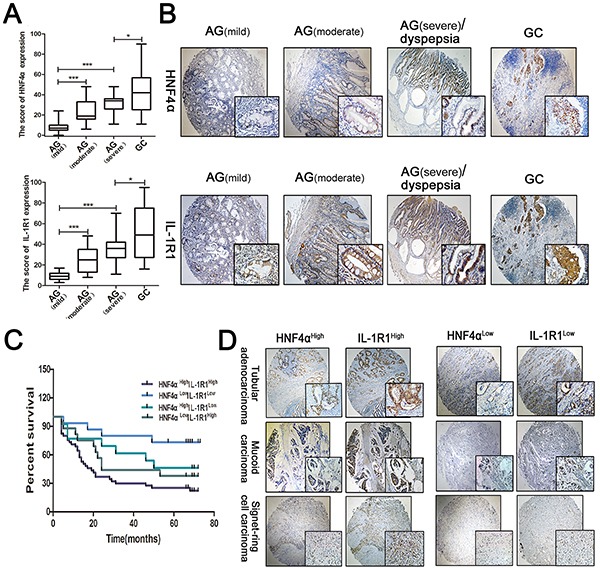
Helicobacter pylori (Hp) is an environmental inducer of gastritis and gastric cancer (GC). The immune response to Hp and the associated changes in somatic gene expression are key determinants governing the transition from gastritis to GC. We show that hepatocyte nuclear factor 4α (HNF4α) is upregulated by Hp infection via NF-κB signaling and that its protein and mRNA levels are elevated in GC. HNF4α in turn stimulates expression of interleukin-1 receptor 1(IL-1R1), which amplifies the inflammatory response evoked by its ligand IL-1β. IL-1β/IL-1R1 activates NF-κB signaling, thereby increasing HNF4α expression and forming a feedback loop that sustains activation of the NF-κB pathway and drives the inflammation towards GC. Examination of clinical samples revealed that HNF4α and IL-1R1 levels increase with increasing severity of Hp-induced gastritis and reach their highest levels in GC. Co-expression of HNF4α and IL-1R1 was a crucial indicator of malignant transformation from gastritis to GC, and was associated with a poorer prognosis in GC patients. Disruption of the HNF4α/IL-1R1/IL-1β/NF-κB circuit during Hp infection maybe an effective means of preventing the associated GC.
Keywords: HNF4α; Hp; IL-1R1; NF-κB; gastric carcinogenesis.
Conflict of interest statement
No potential conflicts of interest were disclosed.
Figures
Similar articles
-
Characterization of interleukin-1β in Helicobacter pylori-induced gastric inflammation and DNA methylation in interleukin-1 receptor type 1 knockout (IL-1R1(-/-)) mice.Eur J Cancer. 2013 Aug;49(12):2760-70. doi: 10.1016/j.ejca.2013.03.031. Epub 2013 May 9. Eur J Cancer. 2013. PMID: 23664095
-
Epigenetic silencing of microRNA-204 by Helicobacter pylori augments the NF-κB signaling pathway in gastric cancer development and progression.Carcinogenesis. 2020 Jun 17;41(4):430-441. doi: 10.1093/carcin/bgz143. Carcinogenesis. 2020. PMID: 31873718
-
Interleukin-1β induced by Helicobacter pylori infection enhances mouse gastric carcinogenesis.Cancer Lett. 2013 Oct 28;340(1):141-7. doi: 10.1016/j.canlet.2013.07.034. Epub 2013 Aug 3. Cancer Lett. 2013. PMID: 23920123
-
Helicobacter pylori Infection Synergistic with IL-1β Gene Polymorphisms Potentially Contributes to the Carcinogenesis of Gastric Cancer.Int J Med Sci. 2016 Apr 8;13(4):298-303. doi: 10.7150/ijms.14239. eCollection 2016. Int J Med Sci. 2016. PMID: 27076787 Free PMC article. Review.
-
H. pylori infection, atrophic gastritis, cytokines, gastrin, COX-2, PPAR gamma and impaired apoptosis in gastric carcinogenesis.Med Sci Monit. 2003 Jul;9(7):SR53-66. Med Sci Monit. 2003. PMID: 12883469 Review.
Cited by
-
Pharmacologic inhibition of HNF4α prevents parenteral nutrition associated cholestasis in mice.Sci Rep. 2023 May 12;13(1):7752. doi: 10.1038/s41598-023-33994-3. Sci Rep. 2023. PMID: 37173326 Free PMC article.
-
Histone demethylase PHF8 promotes progression and metastasis of gastric cancer.Am J Cancer Res. 2017 Mar 1;7(3):448-461. eCollection 2017. Am J Cancer Res. 2017. PMID: 28401003 Free PMC article.
-
Analysis of the HNF4A isoform-regulated transcriptome identifies CCL15 as a downstream target in gastric carcinogenesis.Cancer Biol Med. 2021 Mar 12;18(2):530-46. doi: 10.20892/j.issn.2095-3941.2020.0131. Cancer Biol Med. 2021. PMID: 33710810 Free PMC article.
-
Delineating the role of nuclear receptors in colorectal cancer, a focused review.Discov Oncol. 2024 Feb 19;15(1):41. doi: 10.1007/s12672-023-00808-x. Discov Oncol. 2024. PMID: 38372868 Free PMC article. Review.
-
Downregulation of the NF-κB protein p65 is a shared phenotype among most anti-aging interventions.Geroscience. 2025 Jun;47(3):3077-3094. doi: 10.1007/s11357-024-01466-9. Epub 2024 Dec 12. Geroscience. 2025. PMID: 39666139 Free PMC article.
References
-
- Jemal A, Bray F, Center MM, Ferlay J, Ward E, Forman D. Global cancer statistics. CA Cancer J Clin. 2011;61:69–90. - PubMed
-
- Houghton JeanMarie, Wang Timothy C. Helicobacter pylori and Gastric Cancer: A new paradigm for inflammation-Associated epithelial cancers. Gastroenterology. 2005;128:1567–78. - PubMed
-
- Fuccio L, Zagari RM, Eusebi LH, Laterza L, Cennamo V, Ceroni L, Grilli D, Bazzoli F. Meta-analysis: can Helicobacter pylori eradication treatment reduce the risk for gastric cancer? Ann Intern Med. 2009;151:121–128. - PubMed
MeSH terms
Substances
LinkOut - more resources
Full Text Sources
Other Literature Sources
Medical
Research Materials
Miscellaneous
