. 2016 Feb 11;164(4):644-55.
doi: 10.1016/j.cell.2015.12.039.

Long Neural Genes Harbor Recurrent DNA Break Clusters in Neural Stem/Progenitor Cells

Affiliations

Long Neural Genes Harbor Recurrent DNA Break Clusters in Neural Stem/Progenitor Cells

Pei-Chi Wei et al. Cell. .

Abstract

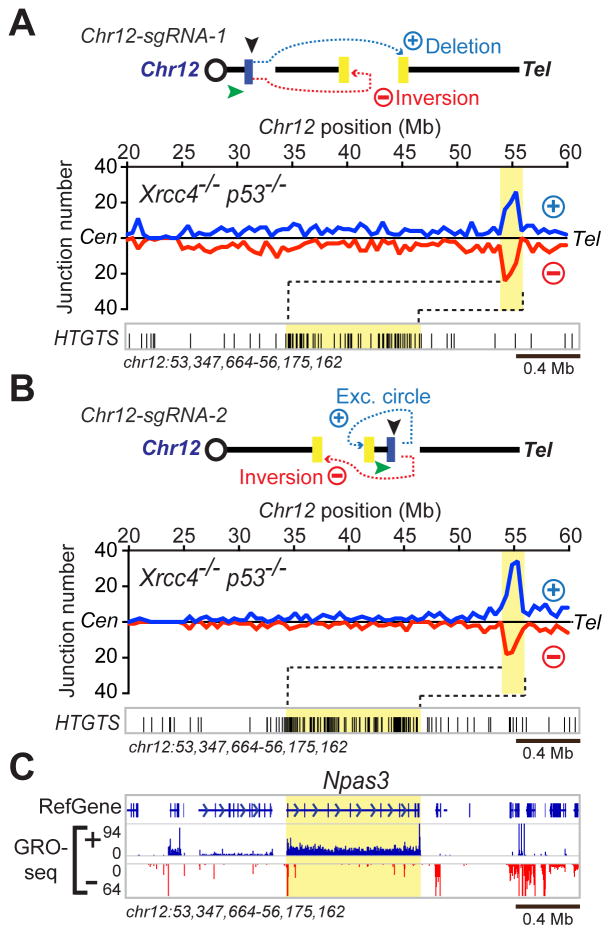
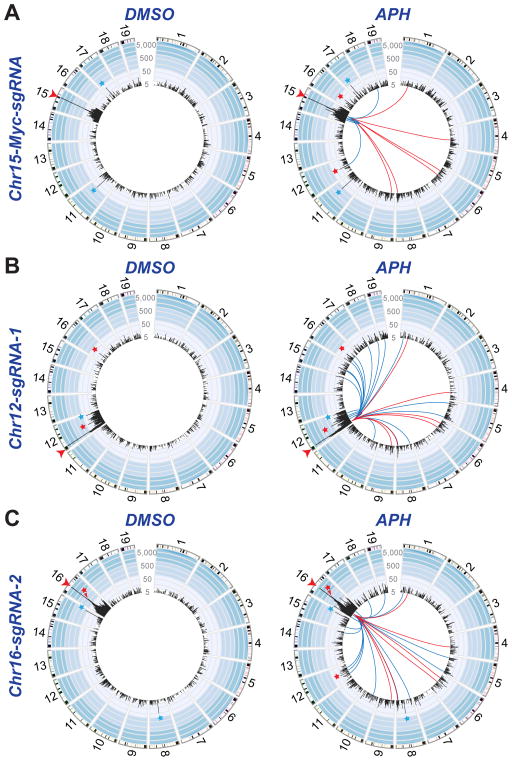
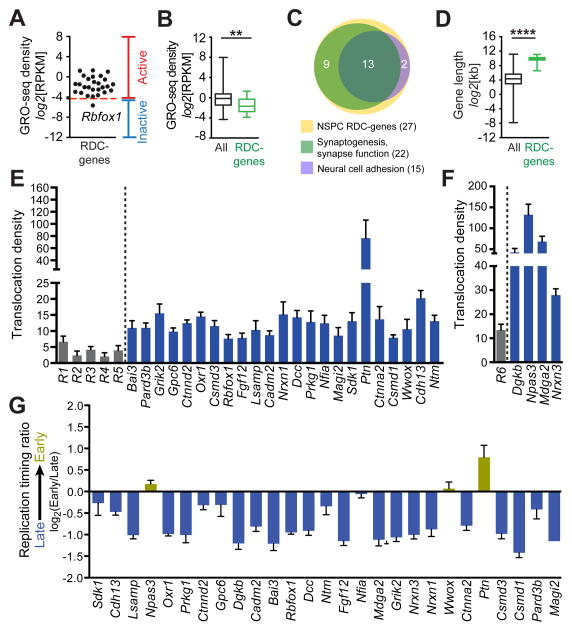
Repair of DNA double-strand breaks (DSBs) by non-homologous end joining is critical for neural development, and brain cells frequently contain somatic genomic variations that might involve DSB intermediates. We now use an unbiased, high-throughput approach to identify genomic regions harboring recurrent DSBs in primary neural stem/progenitor cells (NSPCs). We identify 27 recurrent DSB clusters (RDCs), and remarkably, all occur within gene bodies. Most of these NSPC RDCs were detected only upon mild, aphidicolin-induced replication stress, providing a nucleotide-resolution view of replication-associated genomic fragile sites. The vast majority of RDCs occur in long, transcribed, and late-replicating genes. Moreover, almost 90% of identified RDC-containing genes are involved in synapse function and/or neural cell adhesion, with a substantial fraction also implicated in tumor suppression and/or mental disorders. Our characterization of NSPC RDCs reveals a basis of gene fragility and suggests potential impacts of DNA breaks on neurodevelopment and neural functions.


Figures

Figure 1
Figure 1. Elucidation of DSBs in Xrcc4−/−p53−/− NSPCs
(A) Illustration of N-myc locus and sgRNA target site (vertical black arrowhead) and location and orientation of HTGTS primer (green arrowhead). Cen, centromere; Tel, telomere. E, exon. (B) Circos plot of the mouse genome divided into individual chromosomes showing the genome-wide HTGTS junction pattern of Chr12-sgRNA-1-mediated bait DSBs in Xrcc4−/−p53−/− NSPCs binned into 2.5-Mb regions (black bars); bar height indicates number of translocations per bin on a log scale. 20,000 junctions from four independent experiments are plotted. Red line indicates recurrent translocations between Chr12 bait DSBs (red arrowhead) and an RDC within Lsamp on Chr16; an RDC within Npas3 on Chr12 is denoted by green line. Blue star denotes translocations to sgRNA off-target site. See also Figure S1.
Figure 2
Figure 2. Identification and Characterization of Lsamp RDC
(A) Translocation cluster between Chr12-sgRNA-1-mediated bait DSBs and prey DSBs on Chr16 in Xrcc4−/−p53−/− NSPCs. Upper; diagram of translocation outcomes (see text for details). Green arrowhead denotes HTGTS primer. Middle; graph of Chr16 prey junctions (normalized to 7,070 inter-chromosomal junctions from four independent experiments). Junctions in centromere-to-telomere orientation (+) are in blue, and junctions in telomere-to- centromere orientation (−) are in red. Bin size, 1 Mb. Lower; enlarged view of region around Lsamp showing HTGTS junctions (related to panel above as indicated by dashed lines; genomic coordinates are below). Junction enrichment within Lsamp (highlighted in yellow) was significant (P=3.33×10⁻⁷; see HTGTS Junction Enrichment Analysis in Supplemental Experimental Procedures). (B) Upper; illustration of intra-chromosomal translocations formed between Lsamp-proximal Chr16-sgRNA-1-mediated bait DSBs and prey DSB cluster (highlighted in yellow). Middle; prey junctions captured by Lsamp-proximal bait DSBs over a 16-Mb Chr16 region, combined from three independent Xrcc4−/−p53−/− experiments. Bin size, 100 kb. Details as in panel A. Lower; enlarged view of region around Lsamp showing HTGTS junctions (related to panel above with dashed lines with genomic coordinates indicated at the bottom). RefGene and GRO-seq data are shown (ordinate indicates normalized GRO-seq counts; reads are shown in plus (blue) and minus (red) orientation). Junction enrichment within Lsamp was highly significant (P=1.54×10⁻¹³), as described in (A). 5,917 junctions (945 intra-chromosomal translocations on Chr16 more than 10 kb from the bait-DSB site and 4,972 inter-chromosomal translocations) are plotted. (C) Upper; illustration of translocation outcomes between c-Myc25xI−SceI cassette (yellow box) bait DSBs and prey DSBs on Chr16 with details as in panel A. Middle; Chr16 prey junctions from four independent experiments in ATM−/−ROSAI−SceI−GRc-Myc25xI−SceI NSPCs with Lsamp RDC in yellow. A purple rectangle and star indicates region corresponding to Igλ, and a green rectangle and star indicates regions corresponding to Bcl-6 and Lpp. Lower; enlarged view of indicated RDC-containing region, as described for panel (B). RefGene and GRO-seq reads from ATM−/−ROSAI−SceI−GRc-myc25xI−SceI NSPCs are shown as for panel (B). 7,070 inter-chromosomal junctions are plotted. Junctions within Lsamp were significantly enriched (P=5.43×10⁻⁶), as described in (A). (D) HTGTS analysis of activated ATM−/−ROSAI−SceI−GRc-myc25xI−SceI B cells and GRO-seq analyses of activated B cells (Meng et al., 2014), displayed as described for panel B. See also Table S1.
Figure 3
Figure 3. Identification of Recurrent DSB Cluster in Npas3.
(A) Upper; illustration of intra-chromosomal translocation outcomes between Chr12-sgRNA-1-mediated bait DSBs and Chr12 prey DSBs in Xrcc4−/−p53−/− NSPCs. Lower; prey junctions identified from Chr12-sgRNA-1 bait DSBs over a 40-Mb Chr12 region containing the Npas3 RDC. Data are combined from four independent experiments; bin size, 500 kb. 13,455 junctions (3,489 junctions located more than 10 kb from either side of the bait DSB and 9,966 inter-chromosomal junctions) are plotted. Junction enrichment within Npas3 was highly significant (P=2.63×10⁻¹⁵; see HTGTS Junction Enrichment Analysis in Supplemental Experimental Procedures). Other details as in Figure 2A. (B) Upper, illustration of intra-chromosomal translocation outcomes between Chr12-sgRNA-2 bait DSBs and Chr12 prey DSBs, presented as in (A). Lower; prey junctions identified from Chr12-sgRNA-2 bait DSBs over a 40-Mb Chr12 region containing the Npas3 RDC. Data combined from three independent experiments are presented as in (A); bin size, 500 kb. 5,471 total junctions (1,366 Chr12 junctions located more than 10 kb from either side of the bait DSB and 4,105 inter-chromosomal junctions) are plotted. Junction enrichment within Npas3 region was significant (P =2.03×10⁻¹⁴), as described in (A). (C) GRO-seq and RefGene information (bottom) shown as described for Figure 2B. See also Table S1.
Figure 4
Figure 4. Genome-wide Identification of Replication Stress-induced RDCs in NSPCs
(A) Circos plot showing HTGTS junctions from Cas9:sgRNA-mediated bait DSBs on Chr15 (Chr15-Myc-sgRNA) in DMSO- (left) or APH-treated (right) Xrcc4−/−p53−/− NSPCs. Junctions from three independent experiments per condition were combined and randomly down-sampled so that identical numbers of junctions for each condition (n=17,701 junctions) could be shown in each plot. (B) HTGTS junctions from bait DSBs on Chr12 (Chr12-sgRNA-1), as in (A). (C) HTGTS junctions identified in three (DMSO, left) or four (APH, right) experiments from Chr16-sgRNA-2-mediated bait DSBs; other details as in (A). For all panels, the bait DSB site (red arrowhead) and sgRNA off-target sites (blue stars) are denoted. Lines in the middle of the plot connect the break-site to the SICER-identified replication stress-induced RDCs that were identified for that particular break-site. Red lines indicate 6 RDCs detected by bait DSBs on all three tested chromosomes. Blue lines in each plot indicate RDCs detected by bait DSBs on two of the three tested break-sites, which numbered 5 for the Chr15-Myc-sgRNA break-site (panel A), 19 for Chr12-sgRNA-1 break site (panel B), and 16 for the Chr16-sgRNA-2 break site (panel C). Red stars indicate location of Lsamp and Npas3. See also Figure S3.
Figure 5
Figure 5. Characterization of Replication Stress-induced RDCs in XRCC4/p53-deficient NSPCs
(A) APH-induced RDCs in Xrcc4−/−p53−/− NSPCs identified from bait DSBs located on three different chromosomes. Six APH-induced inter-chromosomal translocation clusters were detected by all three HTGTS strategies; the Ctnna2 (B) and Cdh13 (C) RDCs are shown and the other four are shown in Figure S4A. (B, C) HTGTS junctions in either DMSO- or APH-treated libraries prepared from the indicated bait DSBs. Genomic regions corresponding to RDCs are highlighted in yellow. RefGene tracks are shown. Libraries were normalized as described in Figure 4. (D–F) APH-induced RDCs in Xrcc4−/−p53−/− NSPCs in Csmd3 (D), Nrxn3 (E), and Cadm2 (F) identified from bait DSBs located on two different chromosomes. The panels are organized as for panels A,B, and C. All panels show 2 Mb on either side of the indicated RDC. See Figure S4 for additional examples of proximity-facilitated RDC identification.
Figure 6
Figure 6. Replication Stress-induced RDCs in Repair-proficient NSPCs
(A) Detection of RDCs on a different chromosome from the bait DSBs on Chr15 or Chr12. Three are shown, including Lsamp (B), Nrxn1 (C) and Ctnna2 (D); others are shown in Figure S5. Libraries were normalized as described in Figure 4 (Chr15 bait libraries, 14,525 junctions; Chr12 bait libraries, 10,088 junctions). Details are as in Figure 5. (E, F) Detection of RDCs in Csmd3 (E) or Nrxn3 (F) from two bait DSBs of which one lies on the RDC-containing chromosome. Libraries were normalized as described above. Other details as in Figure 5. See also Figure S5.
Figure 7
Figure 7. Replication Stress-induced RDCs in Long, Actively Transcribed, Neural Genes
(A) Transcriptional activity (GRO-Seq) of the identified 27 genes containing replication stress-induced RDCs. Transcriptional activity cut-off value (RPKM = 0.05) is indicated by dashed red line. (B) Transcription rate of all active (RPKM ≥0.05) NSPC genes (black) and active replication stress-induced RDC-genes (green). Whiskers show minimum and maximum values; top and bottom edge of box plots correspond to 25th and 75th percentile, respectively; horizontal lines indicate the median; **P < 0.005, Kolmogorov-Smirnov (K–S) test. (C) Venn diagram of the indicated molecular functions among the 27 identified RDC-genes (yellow circle); 22 of 27 genes (81.5%; light green circle) have roles in synaptogenesis and synapse function. 15 of the 27 genes (55.6%; purple circle) have roles in neural cell adhesion, with the majority (13 of 15 genes, 86.7%) also having roles in synaptogenesis and synapse function. See Table S6 for a detailed description. (D) Gene length comparison of all active NSPC genes (black) and NSPC RDC-genes (green). Box-and-whisker plots show the binary logarithm of kb gene length; graph details as in (A); ****P < 0.0001, K-S test. (E) Five groups (R1-5) of 50 actively transcribed 15–20 kb genes each were randomly selected from three independent Xrcc4−/−p53−/− Chr12-sgRNA-1 bait DSB libraries and junction numbers within the concatenated regions determined (gray bars). Junction numbers within the indicated inter-chromosomal RDCs were determined in the same libraries (blue bars). Translocation density is indicated as junctions per Mb. (F) Translocation densities of concatenated average-size (15–25 kb) active genes on Chr12 (R6, n=62, gray bar) or intra-chromosomal Chr12 RDCs (blue bars). Data represent mean and SEM of libraries from three independent Chr12-sgRNA-1 bait DSB experiments. (G) Replication timing analysis of RDC-genes (see Experimental Procedures for details). Average and SEM are shown. See also Figures S6, S7, and Table S6.

Comment in

References

    1. Aguilera A, Garcia-Muse T. Causes of genome instability. Annu Rev Genet. 2013;47:1–32. - PubMed
    1. Alt FW, Zhang Y, Meng FL, Guo C, Schwer B. Mechanisms of programmed DNA lesions and genomic instability in the immune system. Cell. 2013;152:417–429. - PMC - PubMed
    1. Arlt MF, Rajendran S, Birkeland SR, Wilson TE, Glover TW. De novo CNV formation in mouse embryonic stem cells occurs in the absence of Xrcc4-dependent nonhomologous end joining. PLoS Genet. 2012;8:e1002981. - PMC - PubMed
    1. Barlow JH, Faryabi RB, Callen E, Wong N, Malhowski A, Chen HT, Gutierrez-Cruz G, Sun HW, McKinnon P, Wright G, et al. Identification of early replicating fragile sites that contribute to genome instability. Cell. 2013;152:620–632. - PMC - PubMed
    1. Barnes DE, Stamp G, Rosewell I, Denzel A, Lindahl T. Targeted disruption of the gene encoding DNA ligase IV leads to lethality in embryonic mice. Curr Biol. 1998;8:1395–1398. - PubMed

Publication types

Substances