. 2016 Feb 11;164(4):668-80.
doi: 10.1016/j.cell.2015.12.033.

Myc Depletion Induces a Pluripotent Dormant State Mimicking Diapause

Affiliations

Myc Depletion Induces a Pluripotent Dormant State Mimicking Diapause

Roberta Scognamiglio et al. Cell. .

Abstract

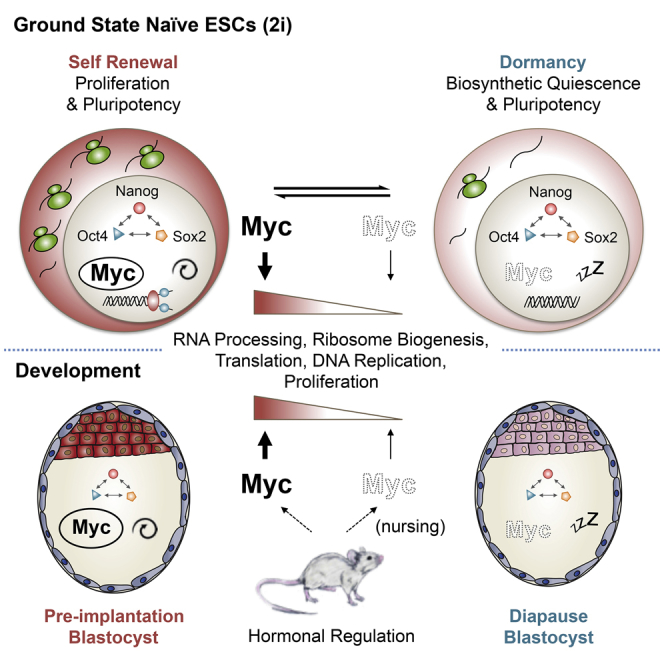
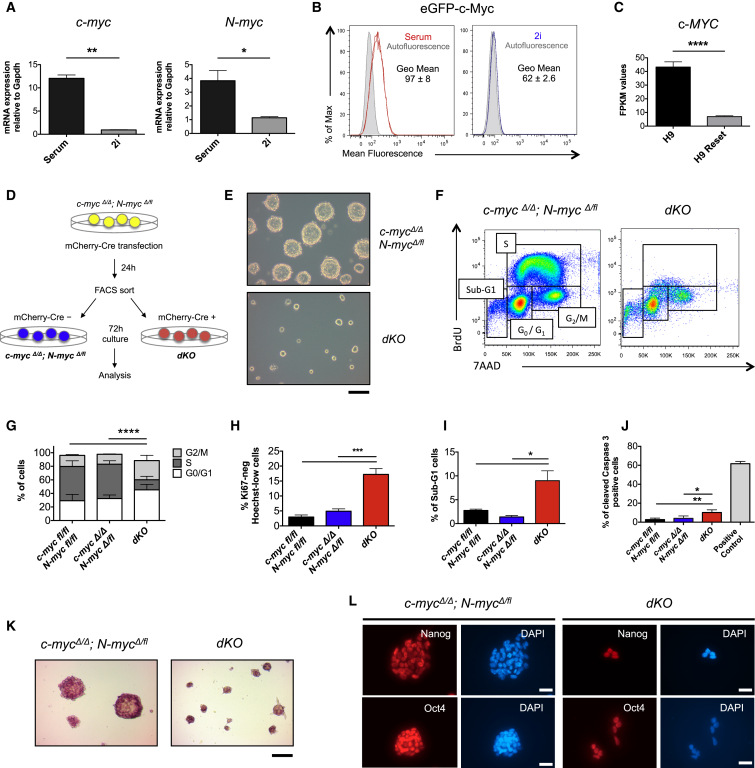
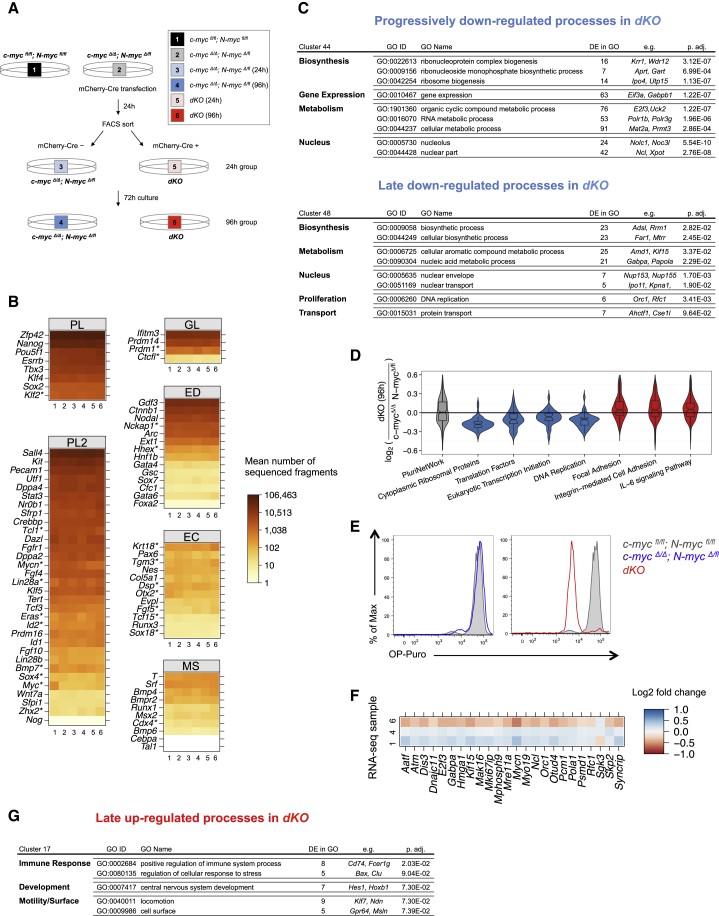
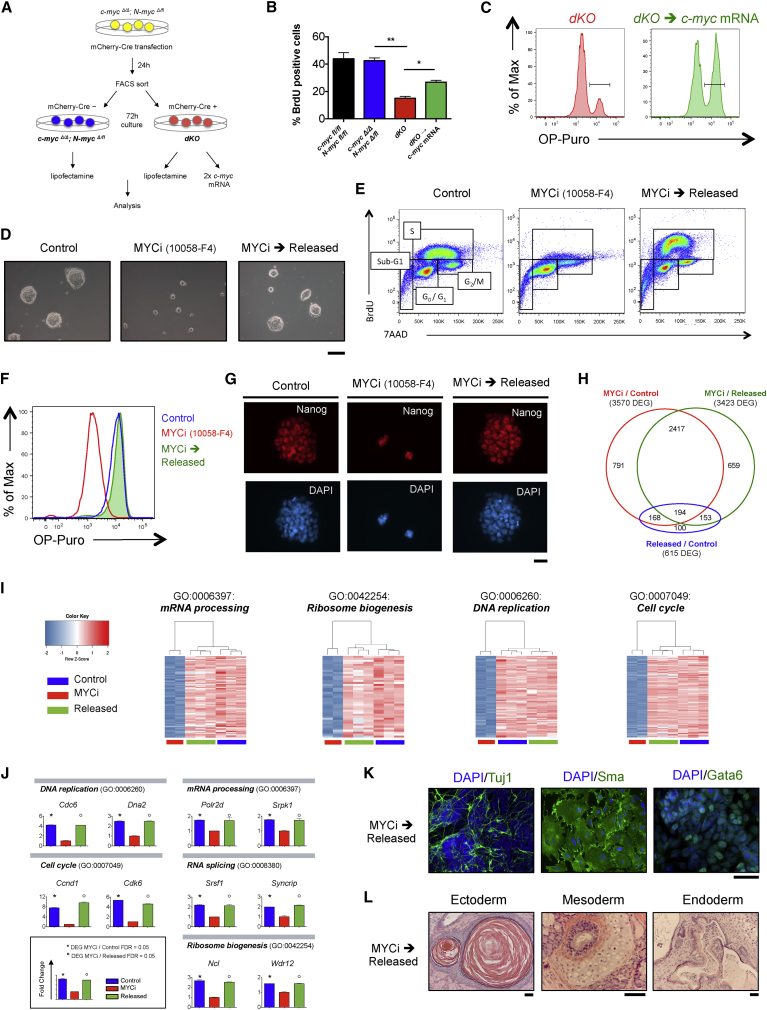
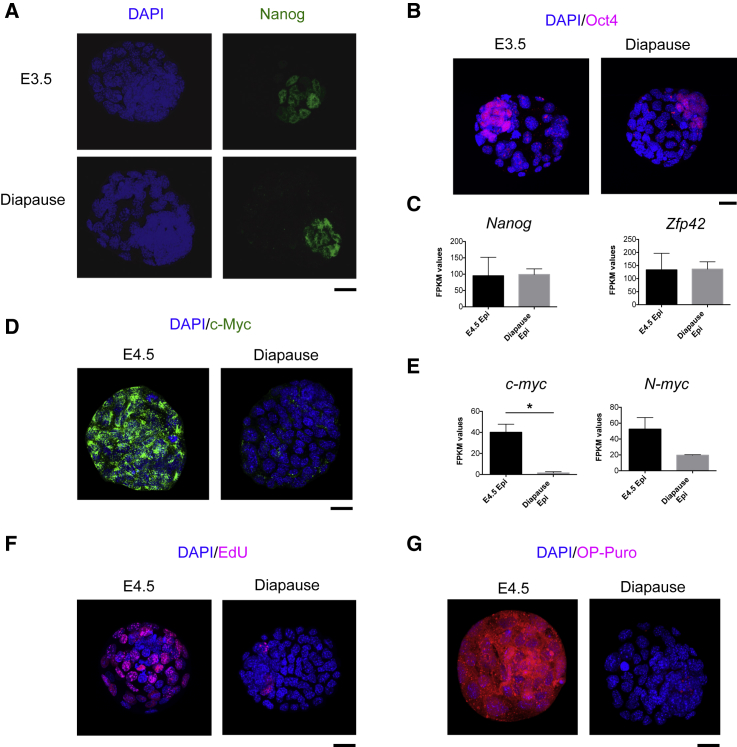
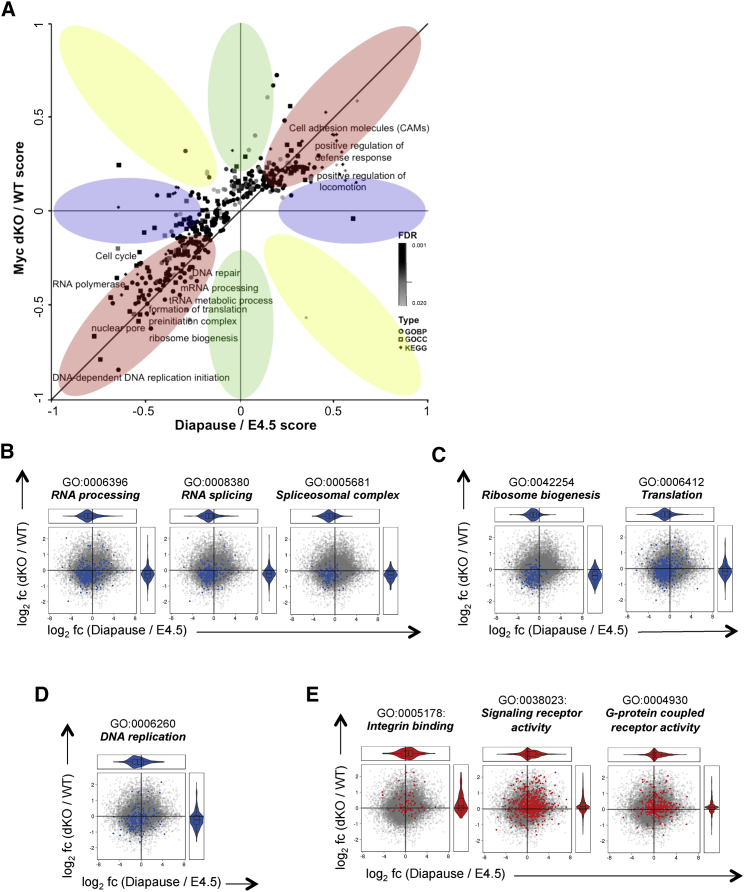
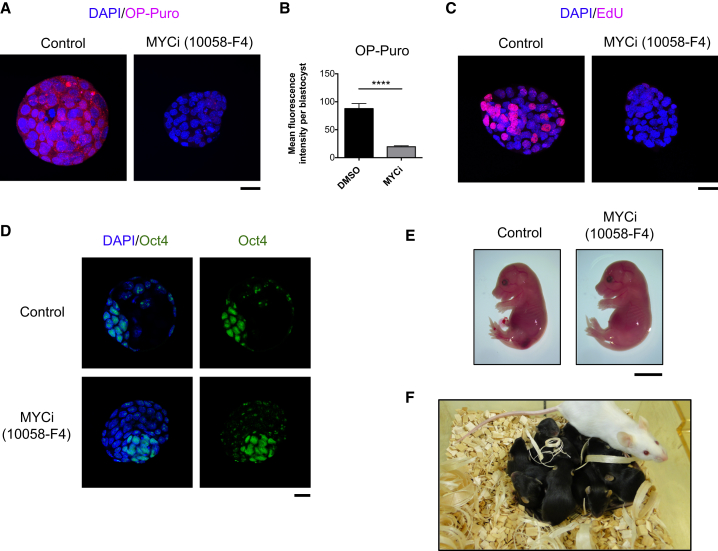
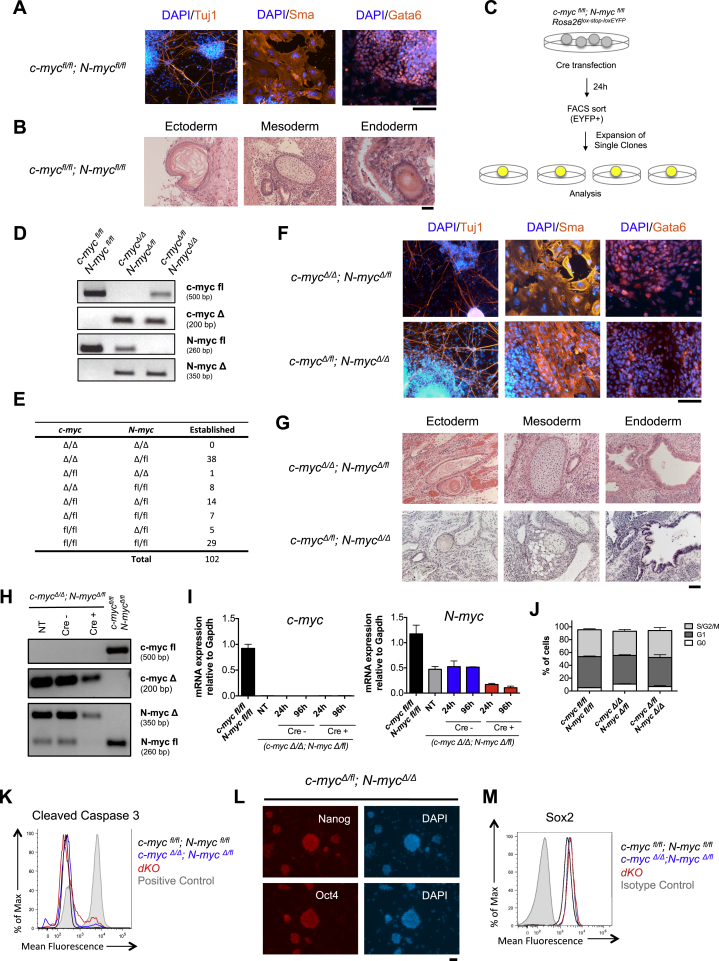
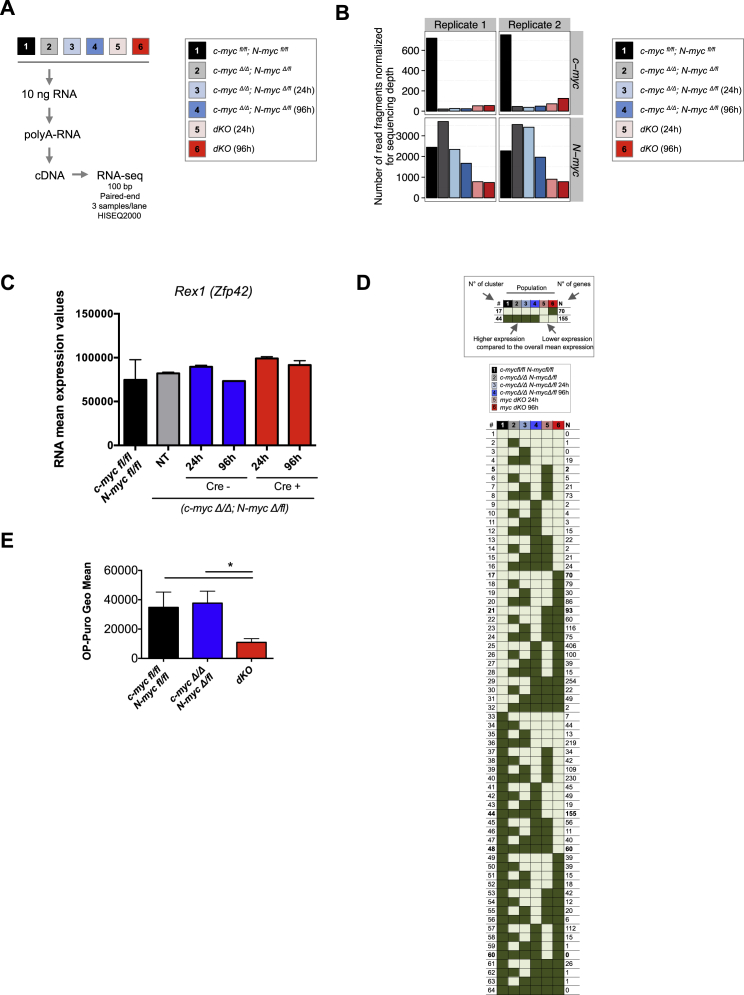
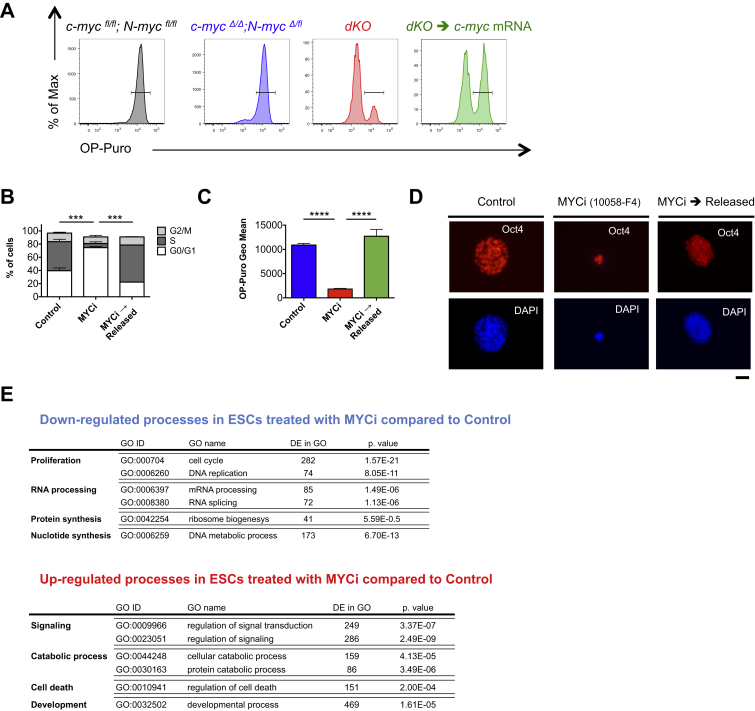
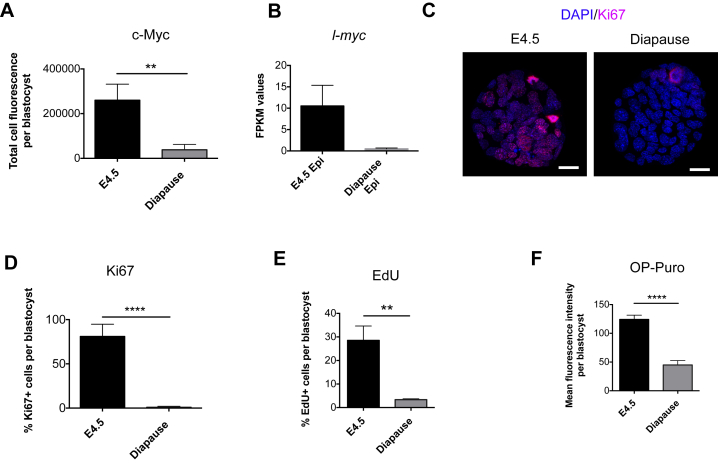
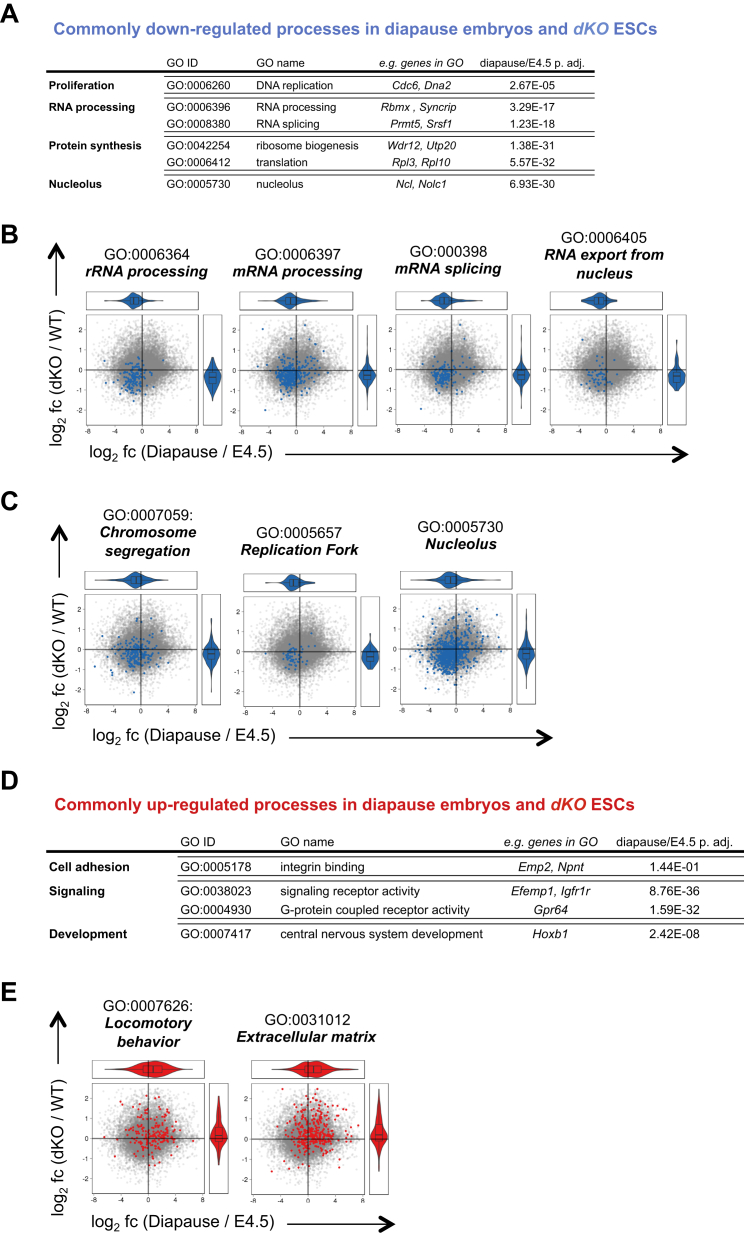
Mouse embryonic stem cells (ESCs) are maintained in a naive ground state of pluripotency in the presence of MEK and GSK3 inhibitors. Here, we show that ground-state ESCs express low Myc levels. Deletion of both c-myc and N-myc (dKO) or pharmacological inhibition of Myc activity strongly decreases transcription, splicing, and protein synthesis, leading to proliferation arrest. This process is reversible and occurs without affecting pluripotency, suggesting that Myc-depleted stem cells enter a state of dormancy similar to embryonic diapause. Indeed, c-Myc is depleted in diapaused blastocysts, and the differential expression signatures of dKO ESCs and diapaused epiblasts are remarkably similar. Following Myc inhibition, pre-implantation blastocysts enter biosynthetic dormancy but can progress through their normal developmental program after transfer into pseudo-pregnant recipients. Our study shows that Myc controls the biosynthetic machinery of stem cells without affecting their potency, thus regulating their entry and exit from the dormant state.


Figures

None
Graphical abstract
Figure 1
Figure 1
Myc Is Required for Proliferation but Not for Maintenance of the Core Pluripotency Network in 2i-Cultured ESCs (A and B) Ground-state ESCs express low levels of Myc. (A) Mouse ESCs were cultured for more than eight passages in 2i or serum and c-myc and N-myc expression were quantified by qRT-PCR analysis and normalized to Gapdh. Values are shown as mean ± SEM.; n = 3. (B) Flow cytometry analysis of eGFP-c-Myc expression in c-MyceGFP/eGFP reporter ESCs cultured for 72 hr in serum (red) or in 2i (blue). The gray histogram represents the autofluorescence signal from ESCs not expressing the eGFP-c-Myc reporter protein. Experiments were performed in triplicates, and values represent geometrical mean (Geo Mean) ± SD. (C) c-MYC expression levels in H9 human ESCs and H9-reset cells. Bar graphs show FPKM (fragments per kilobase of exon per million reads mapped) values of three replicates and are represented as mean ± SD. Data are from Takashima et al. (2014). (D–L) dKO ESCs undergo cell-cycle arrest but maintain the expression of the core pluripotency factors. (D) Experimental workflow. c-mycΔ/Δ; N-mycΔ/fl ESCs were transfected with an EF1α-mCherry-Cre plasmid and sorted 24 hr later as mCherry negative (c-mycΔ/Δ; N-mycΔ/fl) and positive (dKO) cells. Sorted cells were plated in 2i medium and analyzed 72 hr after sort. (E) Phase-contrast microscopy images showing the typical morphology of dKO ESCs. Scale bar, 100 μm. (F) Representative flow cytometry plots of the cell-cycle profiles of c-mycΔ/Δ; N-mycΔ/fl and dKO ESCs. Incorporated BrdU and total DNA content (7AAD) are used to distinguish apoptotic (sub-G1) cells and cells in the G0/G1, S or G2/M phases. (G) Quantitative analysis of the different cell-cycle phases as gated in (F). The bar charts indicate the mean ± SD; n = 4. (H) Percentage of cells in the G0 phase (Hoechst low and intracellular Ki67neg) of the cell cycle as assessed by flow cytometry. Bar graphs indicate the mean ± SEM; n = 6. (I) Quantitative analysis of apoptotic cells (sub-G1) as gated in (F). Values are shown as mean ± SEM; n = 4. (J) Percentage of ESCs expressing cleaved Caspase 3, as assessed by flow cytometry. ESCs incubated for 10 min at 42°C were used as positive control. Values represent mean ± SD; n = 3. (K) Alkaline phosphatase activity of c-mycΔ/Δ; N-mycΔ/fl and dKO cells cultured in 2i. Scale bar, 20 μm. (L) Representative fluorescence staining showing Oct4 and Nanog expression in ESCs cultured in 2i. Scale bar, 50 μm.
Figure 2
Figure 2
Loss of Myc Activity Induces Cellular Dormancy in ESCs Cultured in 2i (A) Workflow of the RNA-seq analysis. Untransfected c-mycfl/fl; N-mycfl/fl (sample 1) and c-mycΔ/Δ; N-mycΔ/fl (sample 2) were used as controls. c-mycΔ/Δ; N-mycΔ/fl cells were transfected with an EF1α-mCherry-Cre plasmid and sorted 24 hr later as Cre negative (c-mycΔ/Δ; N-mycΔ/fl) and positive (dKO) cells. The samples were analyzed immediately after sort (24 hr after Cre transfection, samples 3 and 5) or plated in 2i and analyzed 72 hr after sort (96 hr after Cre transfection, samples 4 and 6). For each condition, two biological replicates in independent experiments were sequenced and analyzed. (B) Heatmap representation of the mean number of sequenced fragments for the genes belonging to the different pluripotency and commitment gene signatures as defined by Marks et al. (2012). PL, pluripotency; PL2, extended pluripotency; GL, germline; ED, endoderm; EC, ectoderm; MS, mesoderm. A gene differentially expressed in at least one sample compared to another condition is indicated by an asterisk (FDR = 0.1). (C) Overrepresented Gene Ontology (GO) categories in the genes progressively (at 24 and 96 hr; cluster 44) and lately (at 96 hr; cluster 48) downregulated in dKO ESCs. (D) Violin representation of the distribution of log fold changes (base 2) of c-mycΔ/Δ; N-mycΔ/fl ESCs with respect to the dKO ESCs stratified by the biological pathways of the genes (as annotated by WikiPathways). Significantly downregulated pathways in dKO ESCs are depicted in blue, whereas upregulated processes are represented in red (FDR = 0.1). (E) Translation activity of ESCs cultured in 2i. Representative FACS plots showing reduced OP-Puro incorporation in dKO ESCs 96 hr after Cre induction (red) compared to c-mycfl/fl; N-mycfl/fl (gray) and c-mycΔ/Δ; N-mycΔ/fl (blue) ESCs. (F) Heatmap representation of the relative fold changes (base 2), with respect to the mean expression across conditions of the differentially expressed genes associated to the cell cycle. (G) Over-represented GO categories in the genes upregulated in dKO ESCs (at 96 hr; cluster 17).
Figure 3
Figure 3
The Dormant State Induced by Myc Depletion Is Reversible (A–C) Expression of exogenous c-myc mRNAs transiently rescues the dKO phenotype. (A) Experimental workflow. c-mycΔ/Δ; N-mycΔ/fl ESCs were transfected with an EF1α-mCherry-Cre plasmid and sorted 24 hr later as mCherry negative (c-mycΔ/Δ; N-mycΔ/fl) and positive (dKO) cells. Sorted cells were plated in 2i medium and 72 hr after sort were transfected twice with c-myc mRNAs (dKOc-myc mRNA). Control samples were treated with Lipofectamine only. Sample analysis was performed 8 hr after the second mRNA transfection. (B) Quantitative analysis of BrdU incorporation measured by flow cytometry. The bar charts indicate the mean ± SEM; n = 3. (C) Representative FACS plots of OP-Puro incorporation in dKO ESCs and dKO cells transfected with c-myc mRNAs (dKOc-myc mRNA). (D–L) Treatment of ESCs with the Myc inhibitor 10058-F4 (MYCi) recapitulates the dKO phenotype and shows molecular and functional reversibility of the state of biosynthetic dormancy induced by depletion of Myc activity. Mouse ESCs were analyzed after 60 hr of treatment with DMSO (Control) or MYCi. The MYCi released group was treated with MYCi for 60 hr, followed by withdrawal of the inhibitor and culture in 2i medium for additional 48 hr. (D) Phase-contrast microscopy images. Scale bar, 100 μm. (E) Representative flow cytometry plots of the cell-cycle profiles based on the measurement of BrdU incorporation and total DNA content (7AAD). (F) FACS analysis of OP-Puro incorporation to measure ESCs translational activity. (G) Representative fluorescence staining for Nanog. Scale bar, 50 μm. (H–J) Microarray expression analysis of mouse ESCs treated with MYCi. (H) Venn diagram showing the number of differentially expressed genes (DEG) (log2 fc > ± 0.5; FDR = 0.05) between the different conditions and their overlaps. (I) Clustered heatmaps of DEG in the indicated GO terms. (J) Expression levels of representative DEG in the selected GO categories. (K and L) MYCi-treated ESCs retain pluripotency. (K) Fluorescence staining of in-vitro-differentiated ESCs for Tuj1, Sma, and Gata6. Scale bar, 100 μm. (L) Hematoxylin and eosin staining of teratomas derived from ESCs treated with MYCi for 60 hr prior injection into immune-deficient mice. Scale bar, 50 μm.
Figure 4
Figure 4
Translation, Proliferation, and Myc Expression Are Reduced in Diapause Embryos (A–C) Expression of pluripotency markers in the diapaused embryos. Confocal microscope images of peri-implantation (E3.5) and diapause embryos immunostained for Nanog (A) or Oct4 (B). Scale bar, 20 μm. (C) RNA-seq data based on Boroviak et al. (2015) showing expression levels of Nanog and Zfp42 in E4.5 and diapause embryos. Bar graphs show FPKM (fragments per kilobase of exon per million reads mapped) values and are represented as mean ± SEM. E4.5 epiblast (n = 3); diapause epiblast (n = 2). (D and E) Diapause embryos have reduced Myc expression. (D) Fluorescence staining for c-Myc in E4.5 and diapause embryos. Scale bar, 20 μm. Images are representative of two independent experiments. (E) Expression levels of c-myc and N-myc in the epiblast of pre-implantation (E4.5) and diapause embryos. RNA-seq data based on Boroviak et al. (2015). E4.5 epiblast (n = 3); diapause epiblast (n = 2). Values are represented as mean ± SEM. (F and G) Diapause embryos are characterized by reduced DNA and protein synthesis. Representative confocal microscope images showing EdU (F) and OP-Puro (G) incorporation in E4.5 and diapause embryos. Scale bar, 20 μm.
Figure 5
Figure 5
Correlation of Expression Signatures between Myc-Depleted ESCs and Diapause Epiblasts (A) 2D GO enrichment analysis of RNA expression changes of dKO/c-mycfl/fl; N-mycfl/fl (WT) ESCs and Diapause/E4.5 epiblasts. Dataset is from Boroviak et al. (2015). Red regions correspond to concordantly higher or lower expression. Blue and green regions correspond to lower or higher expression in one direction, but not in the other. Terms in yellow regions show anti-correlating behavior. Analysis was performed using the Perseus software according to Cox and Mann (2008). FDR = 0.02. (B–E) Scatterplots of pathways significantly changed both in the comparison dKO/WT (FDR = 0.1) and in Diapause/E4.5 (FDR = 0.1). The gray dots represent the set of all genes. Genes belonging to the specific pathways are highlighted in blue (downregulated processes) or red (upregulated processes). The x axis shows the DESeq2-moderated log2 fold change (log2 fc) between the diapause compared to the E4.5 epiblast; the y axis shows the DESeq2-moderated log2 fc between the dKO ESCs compared to c-mycfl/fl; N-mycfl/fl (WT) cells. The violin plots at the margins show the marginal distributions of fold changes of the genes in the highlighted pathways.
Figure 6
Figure 6
Inhibition of Myc Activity Induces a Diapause-like State in Mouse Blastocysts E3.75–E4.0 embryos were collected from pregnant females and treated for 18 hr with MYCi or DMSO (Control). (A) Representative confocal microscope images of OP-Puro incorporation. Scale bar, 20 μm. (B) Quantification of (A). Values are represented as mean ± SEM. MYCi (n = 6); Control (n = 7). (C) Representative images of EdU incorporation. Scale bar, 20 μm. (D) Confocal microscopy images of embryos immunostained for Oct4. Scale bar, 20 μm. (E and F) MYCi-treated and control blastocysts were transplanted into the uteri of pseudo-pregnant foster mothers. (E) Representative images of E15.5 embryos derived from MYCi-treated or control blastocysts. This result is representative of two independent experiments. MYCi (n = 24 embryos E15.5); control (n = 11 embryos E15.5). Scale bar, 0.5 cm. (F) Representative picture of the litter generated from the transplant of MYCi-treated blastocysts into pseudo-pregnant foster mothers. The result is representative of two independent experiments. In the MYCi condition, totally nine litters were born from nine embryo-transferred foster mothers (totally 64 live-born mice).
Figure S1
Figure S1
Myc Is Required for Proliferation but Not for Maintenance of the Core Pluripotency Network in 2i ESCs, Related to Figure 1 (A and B) c-mycfl/fl; N-mycfl/fl ESC lines are capable of multilineage differentiation. (A) Fluorescence staining of in vitro differentiated ESCs for Tuj1, Sma and Gata6. Scale bar, 100 μm. (B) Haematoxylin and eosin staining of teratomas derived from c-mycfl/fl; N-mycfl/fl ESCs. Representative images reveal structures derived from all the three germ layers. Scale bars, 50 μm (ectoderm and mesoderm) and 20 μm (endoderm). (C) Experimental workflow. c-mycfl/fl; N-mycfl/flRosa26lox-stop-loxEYFP ESC were transduced with an EF1α-Cre plasmid and Cre positive (EYFP+) cells were FACS sorted and cultured in 2i, propagated as single clones and genotyped. (D) PCR analysis of representative ESC clones for the c-mycflox, c-mycΔ, N-mycflox and N-mycΔ alleles. (E) Number of clones obtained for each genotype. (F and G) Lack of either c-myc or N-myc does not affect ESCs multilineage differentiation potential. (F) Fluorescence staining for Tuj1, Sma and Gata6 of c-mycΔ/Δ; N-mycΔ//fl and c-mycΔ/fl; N-mycΔlΔ ESCs differentiated in vitro. Scale bar, 100 μm. (G) Representative images of hematoxylin and eosin staining of teratomas from mycΔ/Δ; N-mycΔ//fl and c-mycΔ/fl; N-mycΔlΔ ESCs. Scale bar, 50 μm. (H and I) c-mycΔ/Δ; N-mycΔ//fl ESCs were transfected with an EF1α-mCherry-Cre plasmid and mCherry positive (Cre+) and negative (Cre-) cells were FACS sorted and cultured in 2i. Not transfected (NT) cells were used as controls. (H) PCR of the c-mycflox, c-mycΔ, N-mycflox and N-mycΔ alleles was performed 24h after transfection. (I) qRT-PCR analysis for c-myc and N-myc was performed 24h and 96h after transfection. Transcript levels of c-myc and N-myc were normalized to Gapdh. Data are presented as the mean ± SEM of duplicate wells from a representative experiment. (J) Lack of either c-myc or N-myc does not affect the proliferation of ESCs cultured in 2i. Cell cycle analysis of ESCs in the G0, G1 and S/G2/M phases as determined by Hoechst versus intracellular Ki67 staining. Bar graphs indicate the mean ± SD of two replicates, representative of two independent experiments. (K) Representative flow cytometry plots of ESCs stained for cleaved Caspase 3. ESCs incubated for 10 min at 42°C were used as positive control. (L) Representative images of c-mycΔ/fl; N-mycΔlΔ ESCs stained for Nanog or Oct4. Scale bar, 50 μm. (M) FACS analysis of Sox2 expression in c-mycfl/fl; N-mycfllfl, c-mycΔ/Δ; N-mycΔ//fl and dKO ESCs.
Figure S2
Figure S2
Loss of Myc Activity Induces Cellular Dormancy in ESCs Cultured in 2i, Related to Figure 2 (A) RNA-seq workflow. Total RNA starting material was 10 ng. 100 bp paired–end libraries of two biological replicates for each condition were sequenced. We obtained 1x10⁸ sequenced fragments per sample and detected the expression of more than 28,000 genes. (B) Number of sequenced fragments of the genes c-myc and N-myc on each sample. (C) RNA-seq expression levels of Rex1 (Zpf42) in dKO ESCs compared to the controls. Bar graphs are represented as mean ± SD. (D) Gene expression clusters. For each of the genes detected to be differentially expressed, we estimated the relative fold change between each condition with respect to the mean expression across all the six conditions. The genes were grouped based on the signs of the relative fold change on each of the 64 (26) possible combinations. For instance, all the genes that showed a positive sign for the c-mycfl/fl; N-mycfl/fl and a negative sign for the rest of the conditions were grouped together. (E) Quantification of OP-Puro incorporation in c-mycfl/fl; N-mycfl/fl, c-mycΔ/Δ; N-mycΔlfl and dKO ESCs. Values represent geometrical mean (Geo Mean) ± SEM.
Figure S3
Figure S3
The Dormant State Induced by Myc Depletion Is Reversible, Related to Figure 3 (A) Representative FACS plots of OP-Puro incorporation in c-mycfl/fl; N-mycfl/fl (black), c-mycΔ/Δ; N-mycΔ/fl (blue), dKO (red) ESCs and dKO cells transfected with c-myc mRNAs (green). Experimental setting as described in Figure 3A. (B–E) Mouse ESCs were analyzed after 60h of treatment with DMSO (Control) or MYCi. The MYCiReleased group was treated with MYCi for 60h, followed by withdrawal of the inhibitor and culture in 2i medium for additional 48h. (B) Quantitative analysis of the different cell cycle phases as gated in Figure 3E. The bar charts indicate the mean ± SD (C) Quantification of OP-Puro incorporation in the indicated experimental groups. Values represent geometrical mean (Geo Mean) ± SD. (D) Representative fluorescence staining for Oct4. Scale bar, 50 μm. (E) Microarray analysis of mouse ESCs treated with MYCi. List of selected processes down- or upregulated in the MYCi-treated group compared to the control (FDR 0.05).
Figure S4
Figure S4
Translation, Proliferation, and Myc Expression Are Reduced in Diapause Embryos, Related to Figure 4 (A) c-Myc protein expression in E4.5 and diapause embryos. Quantification of confocal microscopy images as in Figure 4D. (B) Expression levels of l-myc in the epiblast of E4.5 and diapause embryos. RNA-seq data based on (Boroviak et al., 2015). Bar graphs show FPKM values and are represented as mean ± SEM. E4.5 epiblast (n = 3); diapause epiblast (n = 2). (C) Fluorescence staining for Ki67 (red) and DAPI (blue) in E4.5 and diapause embryos. Scale bar, 20 μm. (D) Quantification of (C). Values are represented as mean ± SD. (E) EdU incorporation in E4.5 and Diapause embryos. Quantification of confocal microscopy images as in Figure 4F. (F) OP-Puro incorporation in E4.5 and Diapause embryos. Quantification of Figure 4G.
Figure S5
Figure S5
Correlation of Expression Signatures between Myc Depleted ESCs and Diapause Epiblasts, Related to Figure 5 (A) Selected processes commonly downregulated in diapause embryos and dKO ESCs compared to E4.5 epiblast and c-mycfl/fl; N-mycfl/fl (WT) ESCs respectively (FDR 0.1). (B and C) Scatterplots of pathways significantly downregulated both in the comparison dKO / WT (FDR 0.1) and in Diapause / E4.5 (FDR 0.1). (D) Selected processes commonly upregulated in diapause embryos and dKO ESCs compared to E4.5 epiblast and WT ESCs respectively (FDR 0.1). (E) Scatterplots of pathways significantly upregulated both in the comparison dKO / WT (FDR 0.1) and in Diapause / E4.5 (FDR 0.1).

Comment in

References

    1. Adhikary S., Eilers M. Transcriptional regulation and transformation by Myc proteins. Nat. Rev. Mol. Cell Biol. 2005;6:635–645. - PubMed
    1. Arnold I., Watt F.M. c-Myc activation in transgenic mouse epidermis results in mobilization of stem cells and differentiation of their progeny. Curr. Biol. 2001;11:558–568. - PubMed
    1. Baldridge M.T., King K.Y., Boles N.C., Weksberg D.C., Goodell M.A. Quiescent haematopoietic stem cells are activated by IFN-gamma in response to chronic infection. Nature. 2010;465:793–797. - PMC - PubMed
    1. Batlle-Morera L., Smith A., Nichols J. Parameters influencing derivation of embryonic stem cells from murine embryos. Genesis. 2008;46:758–767. - PubMed
    1. Blackwood E.M., Eisenman R.N. Max: a helix-loop-helix zipper protein that forms a sequence-specific DNA-binding complex with Myc. Science. 1991;251:1211–1217. - PubMed

Publication types

Substances