. 2016 Feb 12;13(1):016005.
doi: 10.1088/1478-3975/13/1/016005.

Kinetics of cellular uptake of viruses and nanoparticles via clathrin-mediated endocytosis

Affiliations

Kinetics of cellular uptake of viruses and nanoparticles via clathrin-mediated endocytosis

Anand Banerjee et al. Phys Biol. .

Abstract

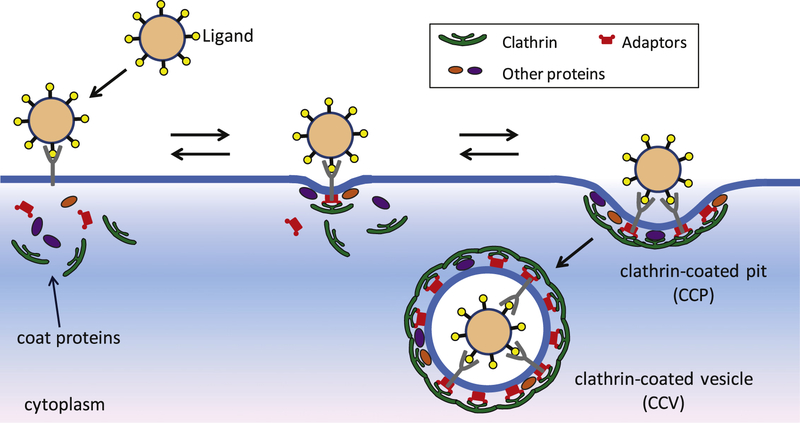
Several viruses exploit clathrin-mediated endocytosis to gain entry into host cells. This process is also used extensively in biomedical applications to deliver nanoparticles (NPs) to diseased cells. The internalization of these nano-objects is controlled by the assembly of a clathrin-containing protein coat on the cytoplasmic side of the plasma membrane, which drives the invagination of the membrane and the formation of a cargo-containing endocytic vesicle. Current theoretical models of receptor-mediated endocytosis of viruses and NPs do not explicitly take coat assembly into consideration. In this paper we study cellular uptake of viruses and NPs with a focus on coat assembly. We characterize the internalization process by the mean time between the binding of a particle to the membrane and its entry into the cell. Using a coarse-grained model which maps the stochastic dynamics of coat formation onto a one-dimensional random walk, we derive an analytical formula for this quantity. A study of the dependence of the mean internalization time on NP size shows that there is an upper bound above which this time becomes extremely large, and an optimal size at which it attains a minimum. Our estimates of these sizes compare well with experimental data. We also study the sensitivity of the obtained results on coat parameters to identify factors which significantly affect the internalization kinetics.


Figures

Figure 1.
Figure 1.
Schematic diagram of NP internalization via clathrin-mediated endocytosis. A NP first binds to a specific cell surface receptor, forming a NP–receptor complex. The complex binds the coat proteins, and clathrin-coated pit (CCP) assembly begins. The CCP either grows to form a vesicle, in which case the NP is internalized, or grows only up to a certain size and subsequently disassembles. In such an event the NP fails to be internalized and the complex becomes free of coat proteins.
Figure 2.
Figure 2.
(a) Coarse-grained model for the assembly of a clathrin-coated pit (CCP). In a real CCP the protein coat contains clathrin, adaptors and several other accessory proteins. In our model of a CCP the coat is made of identical monomeric units. The shape of the CCP is assumed to be a spherical cap, and the average area of a monomer is chosen to be the same as that occupied by a clathrin triskelion in a real CCP. (b) Kinetic scheme of the pit assembly shown in (a). Symbols n and N refer to the number of monomers in a pit and a complete vesicle, respectively. The rate constants αn and βn characterize the growth and decay rates of a pit of size n. k0 is the rate at which the first monomer binds to the NP–receptor complex, and kN is the rate of scission of a vesicle from the membrane.
Figure 3.
Figure 3.
Relation between NP and vesicle diameters. The vesicle diameter, dV, and the NP diameter, dNP, are related by dV = dNP + 2lb, where lb is the length of a receptor–ligand bond.
Figure 4.
Figure 4.
Average energy per monomer, E(N), equation (13), (solid curve) as a function of NP size. E(N) is the sum of the membrane bending energy per monomer (dashed curve) and the energy due to coat formation per monomer (dashed–dotted curve). Dashed vertical lines atdmin ≈ 46 nm and dmax ≈ 105 nm correspond to the NP sizes at which E (N) = 0. The arrow at dE*68 nm indicates the size of the NP whose carrier vesicle is energetically most stable.
Figure 5.
Figure 5.
The probability of successful CCP assembly around a NP–receptor complex, Ps, as a function of the NP size. Ps is high in the region where E < 0, and pit assembly is energetically favorable. The maximum value of Ps is sensitive to the parameter β1, the values of which in s−1 are given near the curves. The dashed vertical lines are the same as in figure 4.
Figure 6.
Figure 6.
Mean time for successful CCP assembly, τs (solid curve) and the mean waiting time, τw, (curves with symbols) for different values of β1, as functions of the NP size, calculated using equations (3)–(6). In contrast to the time τs (only the curve for β1 = 5s−1 shown), the time τw changes significantly with β1. The dashed vertical lines are the same as in figure 4. The arrow indicates the NP diameter ds, at which τs is minimum.
Figure 7.
Figure 7.
The mean internalization time, τ, given in equation (2), as a function of the NP size, for different values of β1. The arrows point to the NP diameters corresponding to the shortest values of the mean internalization time, which we refer to as dopt. The value of dopt is weakly sensitive to changes in β1, but the value of τ at dopt varies significantly. The dashed vertical lines are the same as in figure 4.
Figure 8.
Figure 8.
Plots of dmin, dmax (equation (16)), dopt, τ (dopt), and τs (dopt) (calculated numerically), as functions of κp—the bending rigidity of the protein coat ((a) and (b)), b—effective monomer binding energy ((c) and (d), and Np—the natural number of monomers in the coat ((e) and (f)). Among the characteristic sizes only the maximum NP size dmax shows significant variation. The time τ (dopt) is the sum of τs (dopt) and τw (dopt). The weak dependence of τs (dopt) on coat parameters shows that the increase in τ (dopt) is mainly due to the increase in τw (dopt). The arrows show the parameter values used in our calculations.
Figure 9.
Figure 9.
Spherical cap model of a pit.

References

    1. Bareford LM and Swaan PW 2007. Endocytic mechanisms for targeted drug delivery Adv. Drug Deliv. Rev 59 748–58 - PMC - PubMed
    1. Iversen TG, Skotland T and Sandvig K 2011. Endocytosis and intracellular transport of nanoparticles: present knowledge and need for future studies Nano Today 6 176–85
    1. Akinc A and Battaglia G 2013. Exploiting endocytosis for nanomedicines Cold Spring Harb. Perspect. Biol 5 a016980 - PMC - PubMed
    1. Blanchard E, Belouzard S, Goueslain L, Wakita T, Dubuisson J, Wychowski C and Rouille Y 2006. Hepatitis C virus entry depends on clathrin-mediated endocytosis J. Virol 80 6964–72 - PMC - PubMed
    1. Rust MJ, Lakadamyali M, Zhang F and Zhuang X 2004. Assembly of endocytic machinery around individual influenza viruses during viral entry Nat. Struct. Mol. Biol 11 567–73 - PMC - PubMed

Publication types