Body Mass Index of Young Men in China: Results From Four National Surveys Conducted Between 1955 and 2012
- PMID: 26871856
- PMCID: PMC4753952
- DOI: 10.1097/MD.0000000000002829
Body Mass Index of Young Men in China: Results From Four National Surveys Conducted Between 1955 and 2012
Abstract
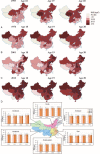
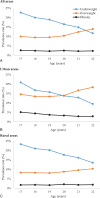
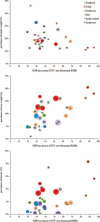
To analyze the characteristics and trends of body mass index (BMI) among young men in China using data from a series of national surveys conducted between 1955 and 2012, and to provide evidence for policy making and disease control and prevention.BMI-related data were collected by routine medical examination from young men, most aged 18 to 20 years, in 4 national surveys (1955, 1974, 2001, and 2012) using a stratified cluster sampling method in 31 provinces, autonomous regions, and municipalities in China. The characteristics and trends of BMI during this period were analyzed by region, year, age, and economic level.Totals of 266,791, 118,092, 69,776, and 57,969 participants were included in the 4 national surveys, respectively. Between 1955 and 2012, height, weight, and BMI showed increasing trends in men aged 18 to 20 years at the national level and in each of the 6 areas of China. BMI also differed among geographical regions. Data from the 2012 national survey showed that age (17-22 years) was correlated positively with the prevalence of overweight and negatively with the prevalence of underweight (both P < 0.05). Gross domestic product was correlated negatively with the prevalence of underweight (r = -0.25) and positively with the prevalence of overweight and obesity (r = 0.45 and 0.240, respectively; all P < 0.001).BMI increased with economic development among young men from 1955 to 2012, with distinct variation among geographic areas in China. Although underweight remains prevalent in young men, especially in urban and northern regions, overweight and obesity are increasingly prevalent and warrant public health attention.
Conflict of interest statement
The authors have no conflicts of interest to disclose.
Figures


Similar articles
-
Geographic variation in the prevalence of overweight and economic status in Chinese adults.Br J Nutr. 2009 Aug;102(3):413-8. doi: 10.1017/S0007114508184732. Epub 2009 Jan 13. Br J Nutr. 2009. PMID: 19138446
-
Economic development and the nutritional status of Chinese school-aged children and adolescents from 1995 to 2014: an analysis of five successive national surveys.Lancet Diabetes Endocrinol. 2019 Apr;7(4):288-299. doi: 10.1016/S2213-8587(19)30075-0. Lancet Diabetes Endocrinol. 2019. PMID: 30902266
-
Underweight and overweight among children and adolescents in Tuscany (Italy). Prevalence and short-term trends.J Prev Med Hyg. 2008 Mar;49(1):13-21. J Prev Med Hyg. 2008. PMID: 18792529
-
Body mass index of male youths aged 18-20 years of the Han nationality living in different regions of China.J Health Popul Nutr. 2007 Dec;25(4):488-94. J Health Popul Nutr. 2007. PMID: 18402193 Free PMC article.
-
[Body mass index among children and adolescents: prevalences and distribution considering underweight and extreme obesity : Results of KiGGS Wave 2 and trends].Bundesgesundheitsblatt Gesundheitsforschung Gesundheitsschutz. 2019 Oct;62(10):1225-1234. doi: 10.1007/s00103-019-03015-8. Bundesgesundheitsblatt Gesundheitsforschung Gesundheitsschutz. 2019. PMID: 31529189 Review. German.
Cited by
-
Contextual influences affecting patterns of overweight and obesity among university students: a 50 universities population-based study in China.Int J Health Geogr. 2017 May 8;16(1):18. doi: 10.1186/s12942-017-0092-x. Int J Health Geogr. 2017. PMID: 28482842 Free PMC article.
-
Visual acuity of young men in China: Results from 3 national cross-sectional surveys from 1974 to 2012.Medicine (Baltimore). 2019 Jan;98(1):e13966. doi: 10.1097/MD.0000000000013966. Medicine (Baltimore). 2019. PMID: 30608434 Free PMC article.
-
Poor Uncorrected Visual Acuity and Association With Sleep Duration and Screen Time: A Dose-Response Relationship Study.Dose Response. 2021 Oct 11;19(4):15593258211042161. doi: 10.1177/15593258211042161. eCollection 2021 Oct-Dec. Dose Response. 2021. PMID: 34658684 Free PMC article.
-
Cold exposure promotes obesity and impairs glucose homeostasis in mice subjected to a high‑fat diet.Mol Med Rep. 2018 Oct;18(4):3923-3931. doi: 10.3892/mmr.2018.9382. Epub 2018 Aug 10. Mol Med Rep. 2018. PMID: 30106124 Free PMC article.
-
A retrospective study on association between obesity and cardiovascular risk diseases with aging in Chinese adults.Sci Rep. 2018 Apr 11;8(1):5806. doi: 10.1038/s41598-018-24161-0. Sci Rep. 2018. PMID: 29643416 Free PMC article.
References
-
- WHO. Obesity and overweight factsheet. Updated August, 2014. http://www.who.int/mediacentre/factsheets/fs311/en/index.html [Accessed November 6, 2014].
-
- Manson JE, Stampfer MJ, Hennekens CH, et al. Body weight and longevity. A reassessment. JAMA 1987; 257:353–358. - PubMed
-
- Troiano RP, Frongillo EA, Jr, Sobal J, et al. The relationship between body weight and mortality: a quantitative analysis of combined information from existing studies. Int J Obes Relat Metab Disord 1996; 20:63–75. - PubMed
-
- Physical status: the use and interpretation of anthropometry. Report of a WHO Expert Committee. World Health Organization Technical Report Series 1995; 854:1–452. - PubMed
Publication types
MeSH terms
LinkOut - more resources
Full Text Sources
Other Literature Sources

