. 2016 Feb 12;11(2):e0149388.
doi: 10.1371/journal.pone.0149388. eCollection 2016.

Compensatory Increase of Transglutaminase 2 Is Responsible for Resistance to mTOR Inhibitor Treatment

Affiliations

Compensatory Increase of Transglutaminase 2 Is Responsible for Resistance to mTOR Inhibitor Treatment

Jingwen Cao et al. PLoS One. .

Expression of concern in

Abstract

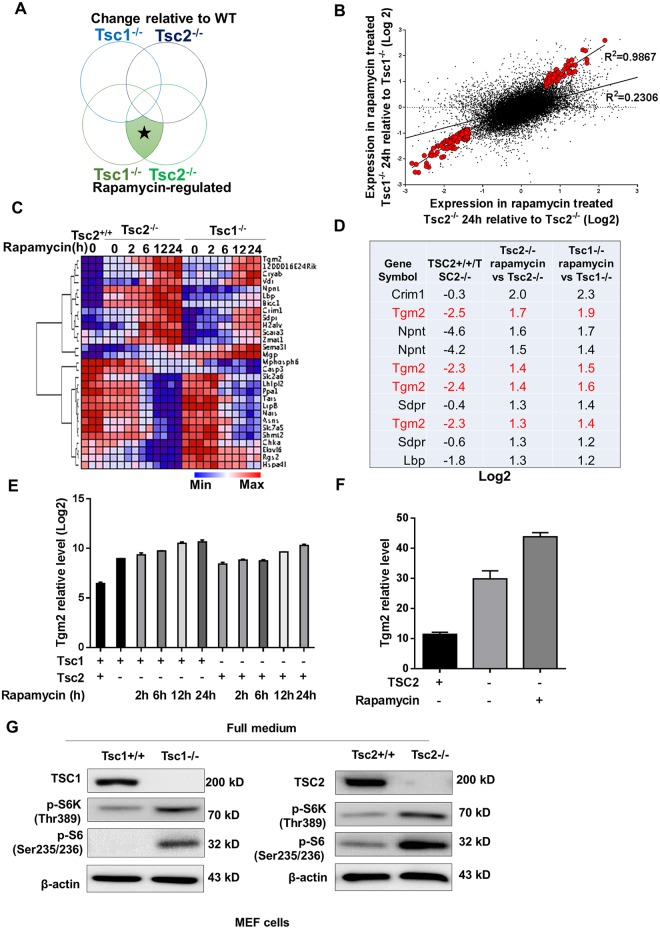
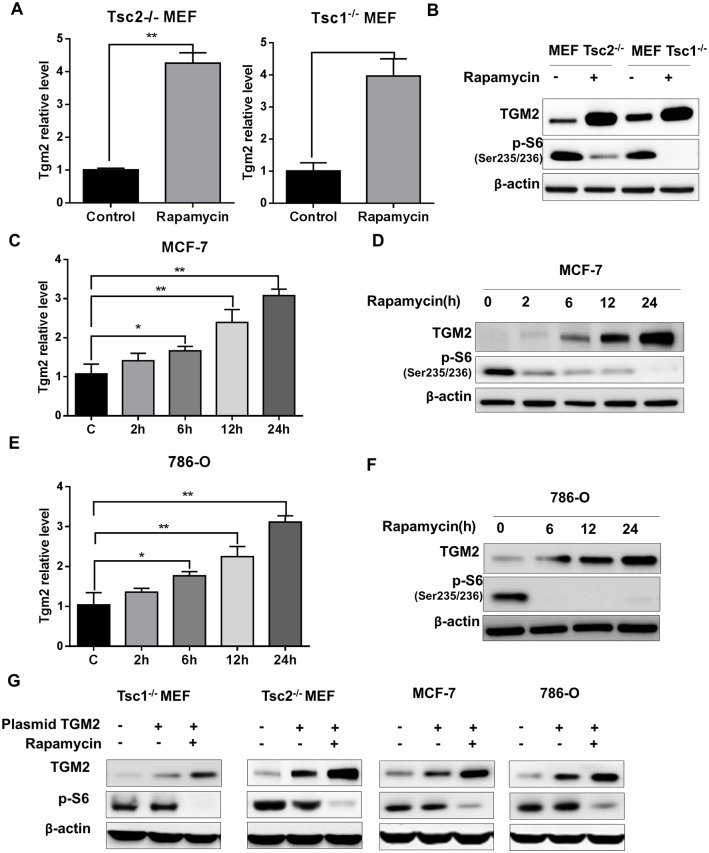
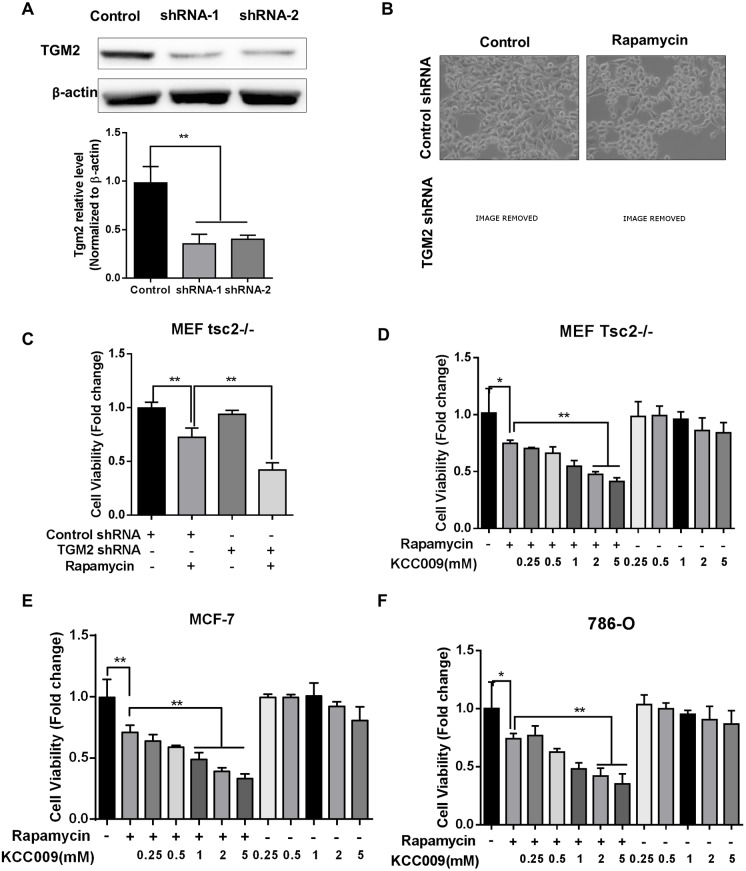
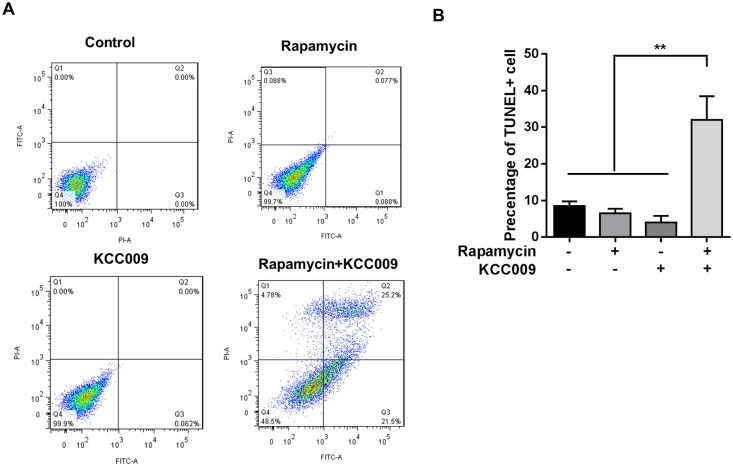
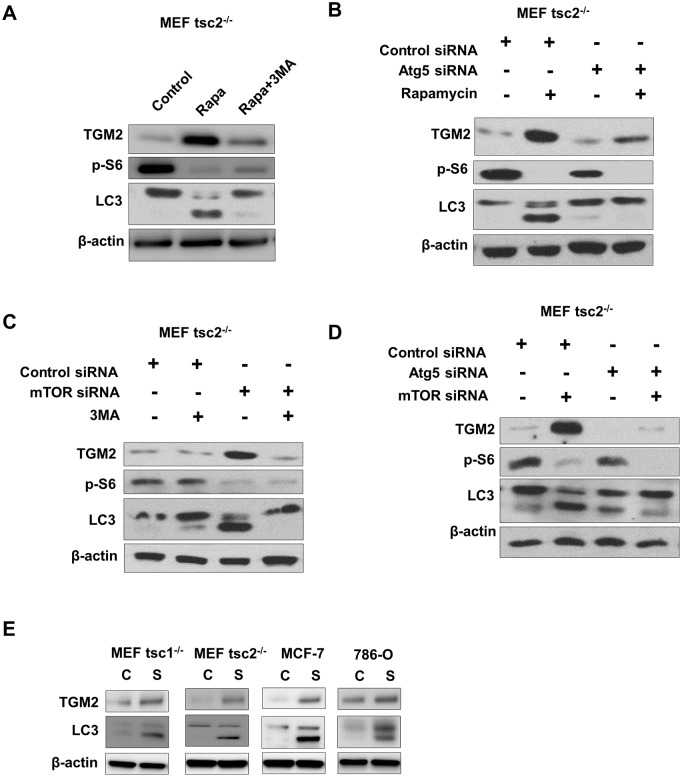
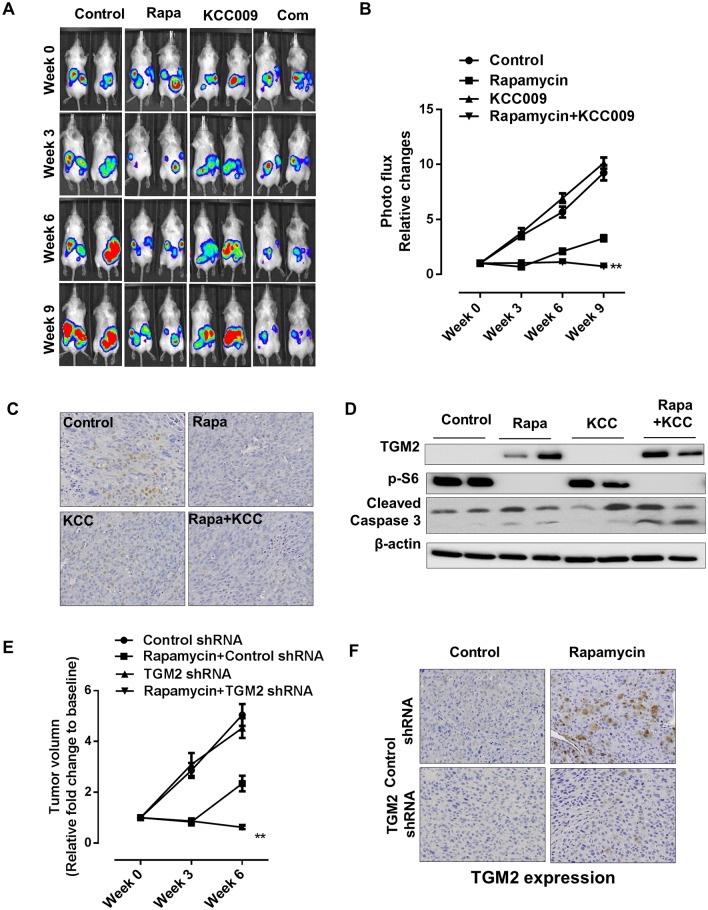
The mechanistic target of rapamycin complex 1 (mTORC1) plays a crucial role in controlling cell growth and homeostasis. Deregulation of mTOR signaling is frequently observed in some cancers, making it an attractive drug target for cancer therapy. Although mTORC1 inhibitor rapalog-based therapy has shown positive results in various pre-clinical animal cancer studies, tumors rebound upon treatment discontinuation. Moreover, several recent clinical trials showed that the mTORC1 inhibitors rapamycin and rapalog only reduce the capacity for cell proliferation without promoting cell death, consistent with the concept that rapamycin is cytostatic and reduces disease progression but is not cytotoxic. It is imperative that rapamycin-regulated events and additional targets for more effective drug combinations be identified. Here, we report that rapamycin treatment promotes a compensatory increase in transglutaminase 2 (TGM2) levels in mTORC1-driven tumors. TGM2 inhibition potently sensitizes mTORC1-hyperactive cancer cells to rapamycin treatment, and a rapamycin-induced autophagy blockade inhibits the compensatory TGM2 upregulation. More importantly, tumor regression was observed in MCF-7-xenograft tumor-bearing mice treated with both mTORC1 and TGM2 inhibitors compared with those treated with either a single inhibitor or the vehicle control. These results demonstrate a critical role for the compensatory increase in transglutaminase 2 levels in promoting mTORC1 inhibitor resistance and suggest that rational combination therapy may potentially suppress cancer therapy resistance.


Conflict of interest statement

Competing Interests: The authors have declared that no competing interests exist.

Figures

Fig 1
Fig 1. Rapamycin regulates Transglutaminase 2 in Tsc2−/− MEFs.
(A) Hypothetical Venn diagram of the two major changes in gene expression observed in this study. Rapamycin-regulated transcripts were classified as those that met all four criteria at a statistical cut-off *p < 0.01. (B) Scatter plot of the expression levels (log2) of the 39,000 probed genes comparing rapamycin- and vehicle-treated Tsc2-/- cells (x-axis), and rapamycin- and vehicle-treated Tsc1-/- cells (24 h) (y-axis). The larger red dots indicate the expression pattern of the 29 gene probes meeting the criteria described in (A). The gray dots indicate the expression pattern of the entire dataset. (E) Heat map of the 29 rapamycin-regulated probes identified in this study showing their expression levels and regulation in response to rapamycin over time in WT, Tsc2-/- and Tsc1-/- cells. The expression levels are representative of the log2 value per sample. (D) Top 10 probes of rapamycin-regulated genes as well as those that were not reverted towards wild type levels by rapamycin treatment in TSC1 and TSC2-deficient cells. (E) Tgm2 transcript levels were compared among WT, Tsc2-/- and Tsc1-/- cells using the log2 values from the GSE21755 GEO dataset. (F) Tgm2 transcript levels were compared between TSC2-deficient (TSC2-) and TSC2-addback (TSC2+) cells, and rapamycin- and vehicle-treated TSC2-deficient cells (Rapa+ TSC2-) from the GSE16944 GEO dataset. (G) Immunoblots of TSC1, TSC2, phospho-S6 and phospho-p70 S6K in Tsc1+/+, Tsc1-/-, Tsc2+/+ and Tsc2-/- MEF cells. All data are shown as means ± S.D. ** P < 0.01, *P < 0.05, Student’s t-test.
Fig 2
Fig 2. Rapamycin treatment promotes expression of transglutaminase 2.
(A) Comparison of Tgm2 transcript levels in Tsc2-/- and Tsc1-/- MEF cells treated with either vehicle or rapamycin (n = 3). (B) Immunoblots of TGM2 and phospho-S6 in Tsc2-/- and Tsc1-/- MEF cells treated with either vehicle or rapamycin. (C) Tgm2 transcript levels in rapamycin-treated MCF-7 cells at various time points (n = 3). (D) Immunoblots of TGM2 and phospho-S6 in vehicle- and rapamycin-treated MCF-7 cells at various time points. (E) Tgm2 transcript levels in rapamycin-treated 786-O cells at various time points (n = 3). (F) Immunoblots of TGM2 and phospho-S6 in vehicle- and rapamycin-treated 786-O cells at various points. (G) Immunoblots of TGM2 and phosphor-S6 in in vehicle- and rapamycin-treated Tsc1-/- and Tsc2-/- MEFs, MCF-7 and 786-O cells transfected with vehicle or TGM2 plasmids. All data are shown as means ± S.D. ** P < 0.01, *P < 0.05, Student’s t-test.
Fig 3
Fig 3. Combined TGM2 and mTORC1 inhibition leads to morphological changes and reduced viability.
(A) Tsc2-/- MEF cells were treated with siRNAs against TGM2 and lysates were used for immunoblotting. Densitometry is shown in the bar chart (n = 3). (B) Tsc2-/- MEF cells were treated with either TGM2 siRNA or 20 nM rapamycin for 24 hours and cell morphologies were recorded using phase-contract microscopy. (C) Tsc2-/- MEF cell viability following treatment with TGM2 siRNA and 20 nM rapamycin (n = 8). (D) Tsc2-/- MEF cell viability following treatment with 20 nM rapamycin and the indicated doses of TGM2 inhibitor KCC009. (E) Viability of MCF-7 cells treated with 20 nM rapamycin and the indicated doses of TGM2 inhibitor KCC009 (n = 8). (F) Viability of 786-O cells treated with 20 nM rapamycin and the indicated doses of TGM2 inhibitor KCC009 (n = 8). All data are shown as means ± S.D. ** P < 0.01, *P < 0.05, Student’s t-test.
Fig 4
Fig 4. TGM2 and mTORC1 inhibition causes potent Tsc2−/− cell apoptosis.
Tsc2-/- MEF cells were treated with 20 nM rapamycin and 0.5 mM TGM2 inhibitor KCC009 for 24 hours. (A) Cell death was analyzed using PI and ANNEXIN V staining and flow cytometry. (B) Cell death was analyzed by TUNEL staining. Percentage of TUNEL+ cells is indicated in the bar chart (n = 4). All data are shown as means ± S.D. ** P < 0.01, *P < 0.05, Student’s t-test.
Fig 5
Fig 5. Rapamycin treatment-induced increased TGM2 is autophagy dependent.
(A) Immunoblots for TGM2, phospho-S6 and LC3 in vehicle-, rapamycin- and rapamycin plus 3MA 33MA-treated Tsc2-/- MEF cells. (B) Immunoblots for TGM2, phospho-S6 and LC3 in control siRNA-, Atg5 siRNA-, and Atg5 siRNA and rapamycin-treated Tsc2-/- MEF cells. (C) Immunoblots for TGM2, phospho-S6 and LC3 in control siRNA-, mTOR siRNA-, and mTOR siRNA and 3MA-treated Tsc2-/- MEF cells. (D) Immunoblots for TGM2, phospho-S6 and LC3 in control siRNA-, mTOR siRNA-, and mTOR and Atg5 siRNA-treated Tsc2-/- MEF cells. (E) Immunoblots for TGM2 and LC3 in full medium (10% FBS) or starvation (FBS free) condition in Tsc1-/- and Tsc2-/- MEFs, MCF-7 and 786-O cells.
Fig 6
Fig 6. Dual inhibition of mTORC1 and TGM2 causes xenograft tumor regression.
Female CB17-scid mice were s.c. inoculated with luciferase-labeled MCF-7 cells. Mice were treated with vehicle, rapamycin, KCC009, or rapamycin and KCC009 for 9 weeks. (A and B) Representative images of mice bearing MCF-7 xenograft tumors treated with vehicle control, rapamycin, KCC009, or rapamycin and KCC009. Xenograft tumor bioluminescent intensity was recorded and quantified every three weeks. The y-axis indicates relative tumor growth vs. the baseline quantification before drug treatment (n = 8). (C) Representative images of immunohistochemical staining for cell proliferation marker PCNA in tumors from mice treated with vehicle, rapamycin, KCC009, or rapamycin and KCC009. (D) Immunoblot of tumor lysates for TGM2, p-S6, and cleaved caspase 3 in tumors from mice treated with vehicle, rapamycin, KCC009, or rapamycin and KCC009. (E) Mice were inoculated with control or TGM2 shRNA knockdown stable MCF-7 cell lines. Vehicle control or rapamycin was applied to mice with tumor burden. Tumor volume (relative fold change to baseline) was recorded and quantified every three weeks until 6 weeks. (F) Representative images of immunohistochemical staining for TGM2 in tumors from mice inoculated with control or TGM2 shRNA knockdown stable MCF-7 cell lines treated with vehicle or rapamycin. All data are shown as means ± S.D. ** P < 0.01, *P < 0.05, Student’s t-test.

Similar articles

Cited by

References

    1. Ma XM, Blenis J. Molecular mechanisms of mTOR-mediated translational control. Nature reviews Molecular cell biology. 2009;10(5):307–18. 10.1038/nrm2672 . - DOI - PubMed
    1. Guertin DA, Sabatini DM. Defining the role of mTOR in cancer. Cancer cell. 2007;12(1):9–22. 10.1016/j.ccr.2007.05.008 . - DOI - PubMed
    1. Laplante M, Sabatini DM. mTOR signaling in growth control and disease. Cell. 2012;149(2):274–93. 10.1016/j.cell.2012.03.017 - DOI - PMC - PubMed
    1. Menon S, Manning BD. Common corruption of the mTOR signaling network in human tumors. Oncogene. 2008;27 Suppl 2:S43–51. 10.1038/onc.2009.352 - DOI - PMC - PubMed
    1. Sabatini DM. mTOR and cancer: insights into a complex relationship. Nature reviews Cancer. 2006;6(9):729–34. 10.1038/nrc1974 . - DOI - PubMed

Publication types

MeSH terms