

Atrial Anti-Arrhythmic Effects of Heptanol in Langendorff-Perfused Mouse Hearts
- PMID: 26872148
- PMCID: PMC4752503
- DOI: 10.1371/journal.pone.0148858
Atrial Anti-Arrhythmic Effects of Heptanol in Langendorff-Perfused Mouse Hearts
Abstract
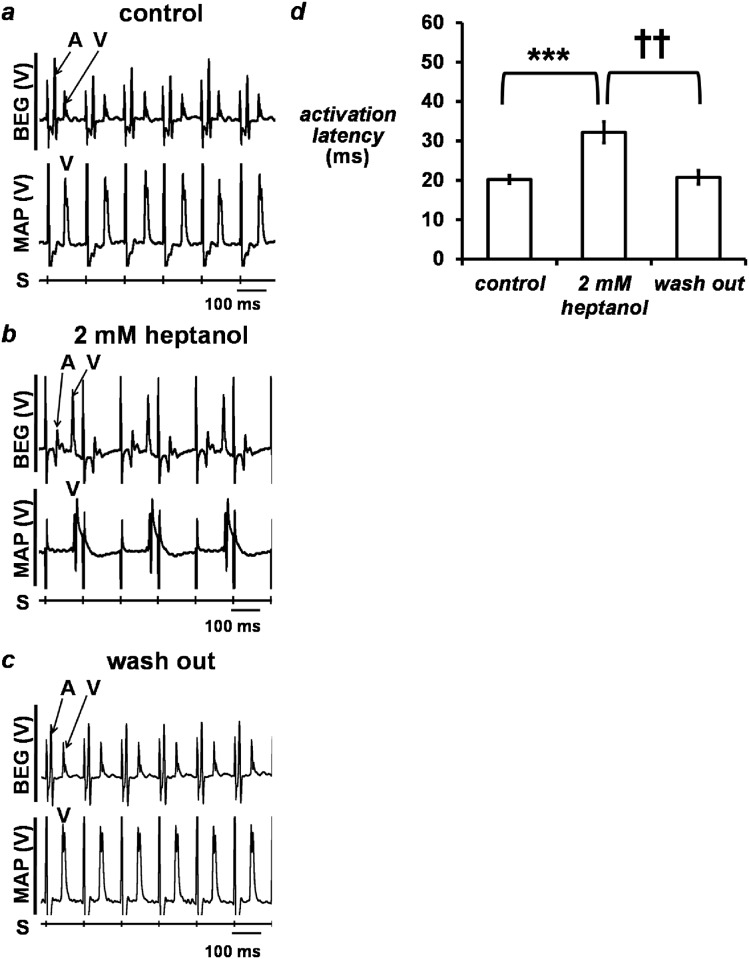
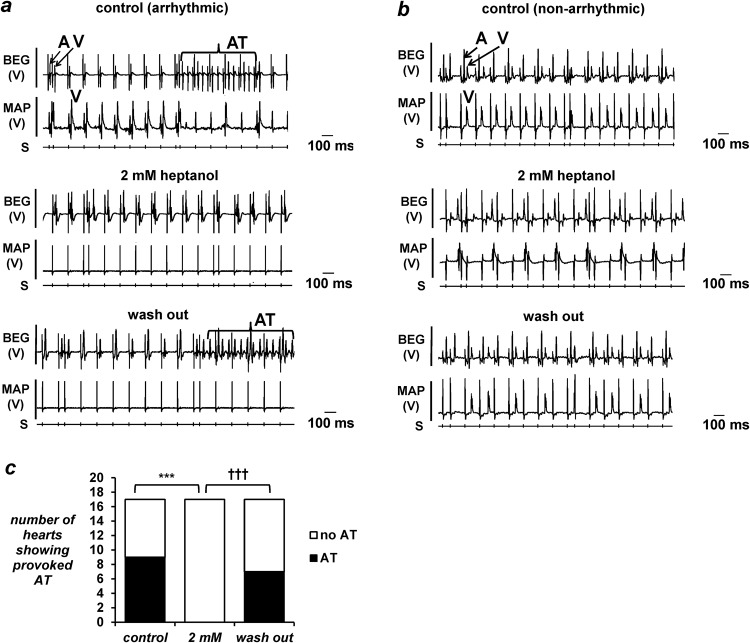
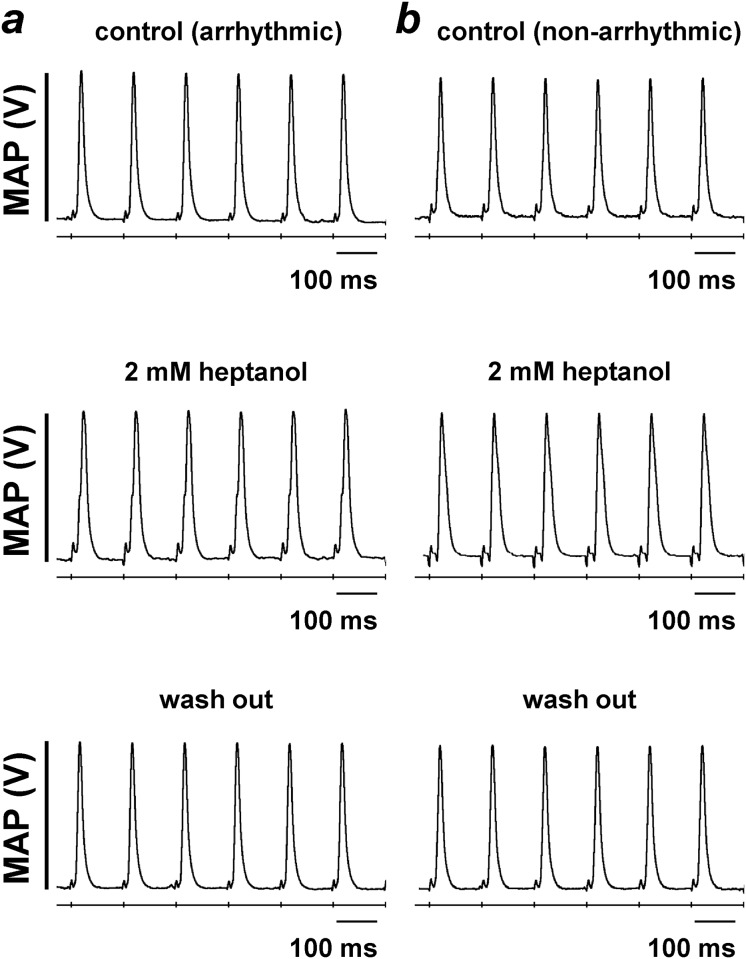
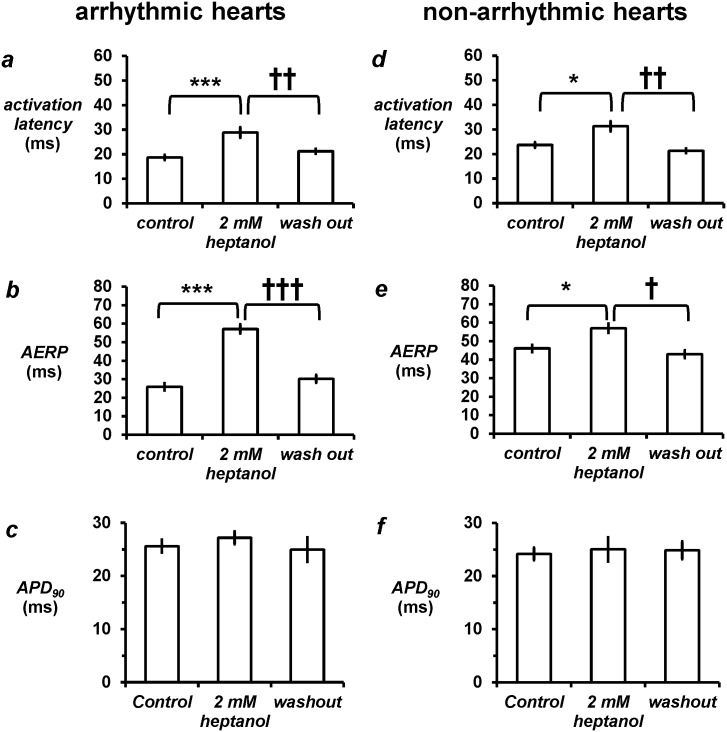
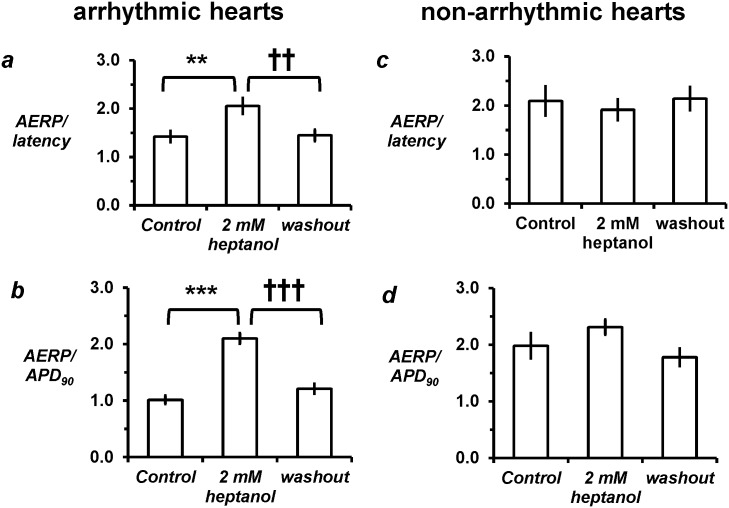
Acute effects of heptanol (0.1 to 2 mM) on atrial electrophysiology were explored in Langendorff-perfused mouse hearts. Left atrial bipolar electrogram or monophasic action potential recordings were obtained during right atrial stimulation. Regular pacing at 8 Hz elicited atrial activity in 11 out of 11 hearts without inducing atrial arrhythmias. Programmed electrical stimulation using a S1S2 protocol provoked atrial tachy-arrhythmias in 9 of 17 hearts. In the initially arrhythmic group, 2 mM heptanol exerted anti-arrhythmic effects (Fisher's exact test, P < 0.05) and increased atrial effective refractory period (ERP) from 26.0 ± 1.9 to 57.1 ± 2.5 ms (ANOVA, P < 0.001) despite increasing activation latency from 18.7 ± 1.1 to 28.9 ± 2.1 ms (P < 0.001) and leaving action potential duration at 90% repolarization (APD90) unaltered (25.6 ± 1.2 vs. 27.2 ± 1.2 ms; P > 0.05), which led to increases in ERP/latency ratio from 1.4 ± 0.1 to 2.1 ± 0.2 and ERP/APD90 ratio from 1.0 ± 0.1 to 2.1 ± 0.2 (P < 0.001). In contrast, in the initially non-arrhythmic group, heptanol did not alter arrhythmogenicity, increased AERP from 47.3 ± 5.3 to 54.5 ± 3.1 ms (P < 0.05) and activation latency from 23.7 ± 2.2 to 31.3 ± 2.5 ms and did not alter APD90 (24.1 ± 1.2 vs. 25.0 ± 2.3 ms; P > 0.05), leaving both AERP/latency ratio (2.1 ± 0.3 vs. 1.9 ± 0.2; P > 0.05) and ERP/APD90 ratio (2.0 ± 0.2 vs. 2.1 ± 0.1; P > 0.05) unaltered. Lower heptanol concentrations (0.1, 0.5 and 1 mM) did not alter arrhythmogenicity or the above parameters. The present findings contrast with known ventricular pro-arrhythmic effects of heptanol associated with decreased ERP/latency ratio, despite increased ERP/APD ratio observed in both the atria and ventricles.
Conflict of interest statement
Figures
Similar articles
-
Gap junction inhibition by heptanol increases ventricular arrhythmogenicity by reducing conduction velocity without affecting repolarization properties or myocardial refractoriness in Langendorff-perfused mouse hearts.Mol Med Rep. 2016 Nov;14(5):4069-4074. doi: 10.3892/mmr.2016.5738. Epub 2016 Sep 13. Mol Med Rep. 2016. PMID: 27633494 Free PMC article.
-
Effects of pharmacological gap junction and sodium channel blockade on S1S2 restitution properties in Langendorff-perfused mouse hearts.Oncotarget. 2017 Jul 28;8(49):85341-85352. doi: 10.18632/oncotarget.19675. eCollection 2017 Oct 17. Oncotarget. 2017. PMID: 29156723 Free PMC article.
-
Ventricular arrhythmogenesis following slowed conduction in heptanol-treated, Langendorff-perfused mouse hearts.J Physiol Sci. 2012 Mar;62(2):79-92. doi: 10.1007/s12576-011-0187-2. Epub 2012 Jan 5. J Physiol Sci. 2012. PMID: 22219003 Free PMC article.
-
The effect of heptanol on the electrical and contractile function of the isolated, perfused rabbit heart.Pflugers Arch. 2000 Jun;440(2):275-82. doi: 10.1007/s004240000264. Pflugers Arch. 2000. PMID: 10898528
-
Modification of class III anti-arrhythmic activity in abnormal myocardium.Cardiovasc Res. 1988 Dec;22(12):847-54. doi: 10.1093/cvr/22.12.847. Cardiovasc Res. 1988. PMID: 3076844 Review. No abstract available.
Cited by
-
Quantification of Beat-To-Beat Variability of Action Potential Durations in Langendorff-Perfused Mouse Hearts.Front Physiol. 2018 Nov 27;9:1578. doi: 10.3389/fphys.2018.01578. eCollection 2018. Front Physiol. 2018. PMID: 30538638 Free PMC article.
-
Mechanisms of Electrical Activation and Conduction in the Gastrointestinal System: Lessons from Cardiac Electrophysiology.Front Physiol. 2016 May 31;7:182. doi: 10.3389/fphys.2016.00182. eCollection 2016. Front Physiol. 2016. PMID: 27303305 Free PMC article. Review.
-
Microelectrode Array Recording of Sinoatrial Node Firing Rate to Identify Intrinsic Cardiac Pacemaking Defects in Mice.J Vis Exp. 2021 Jul 5;(173):10.3791/62735. doi: 10.3791/62735. J Vis Exp. 2021. PMID: 34279515 Free PMC article.
-
Effects of granulocyte colony‑stimulating factor on rabbit carotid and porcine heart models of chronic obliterative arterial disease.Mol Med Rep. 2019 Jun;19(6):4569-4578. doi: 10.3892/mmr.2019.10120. Epub 2019 Apr 3. Mol Med Rep. 2019. PMID: 30942413 Free PMC article.
-
Pinocembrin Decreases Atrial Fibrillation Susceptibility in a Rodent Model of Depression.Front Cardiovasc Med. 2022 May 20;9:766477. doi: 10.3389/fcvm.2022.766477. eCollection 2022. Front Cardiovasc Med. 2022. PMID: 35669473 Free PMC article.
References
-
- Shaw RM, Rudy Y. Ionic mechanisms of propagation in cardiac tissue. Roles of the sodium and L-type calcium currents during reduced excitability and decreased gap junction coupling. Circ Res. 1997;81(5):727–41. - PubMed
-
- Antzelevitch C. Ion channels and ventricular arrhythmias: cellular and ionic mechanisms underlying the Brugada syndrome. Curr Opin Cardiol. 1999;14(3):274–9. Epub 1999/06/08. . - PubMed
Publication types
MeSH terms
Substances
LinkOut - more resources
Full Text Sources
Other Literature Sources
