. 2016 Feb 16;44(2):233-45.
doi: 10.1016/j.immuni.2016.01.010. Epub 2016 Feb 9.

In Vivo Killing Capacity of Cytotoxic T Cells Is Limited and Involves Dynamic Interactions and T Cell Cooperativity

Affiliations

In Vivo Killing Capacity of Cytotoxic T Cells Is Limited and Involves Dynamic Interactions and T Cell Cooperativity

Stephan Halle et al. Immunity. .

Abstract

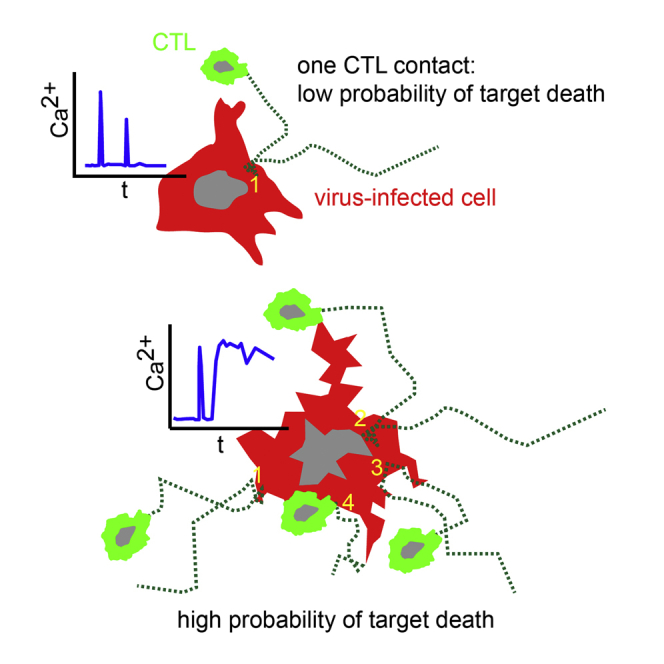
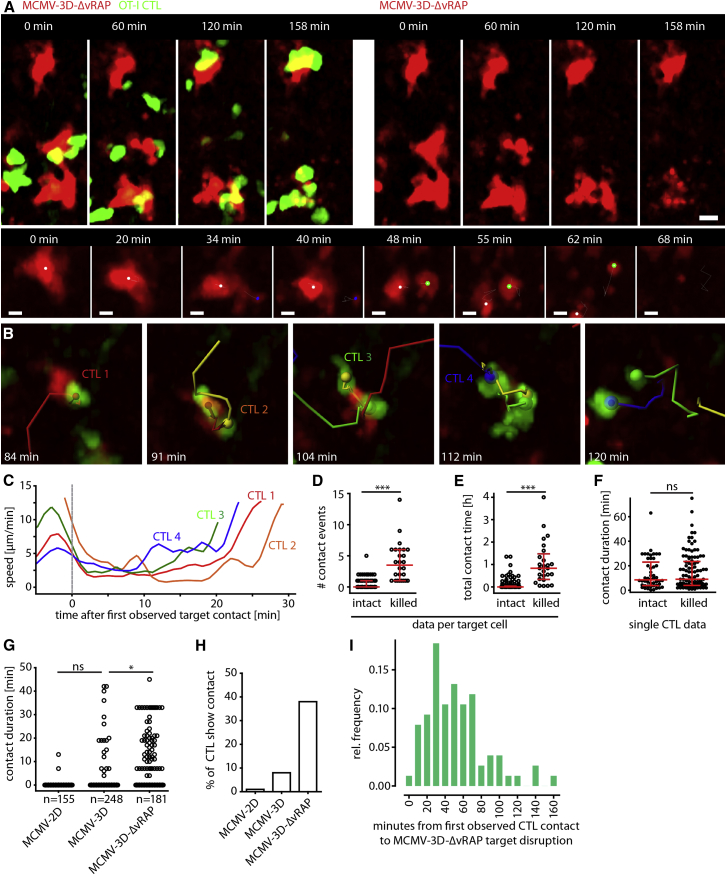
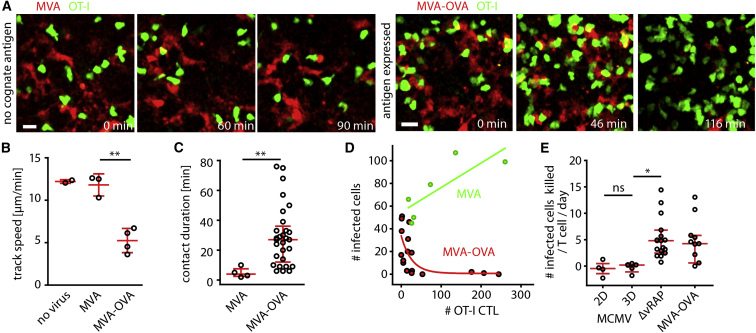
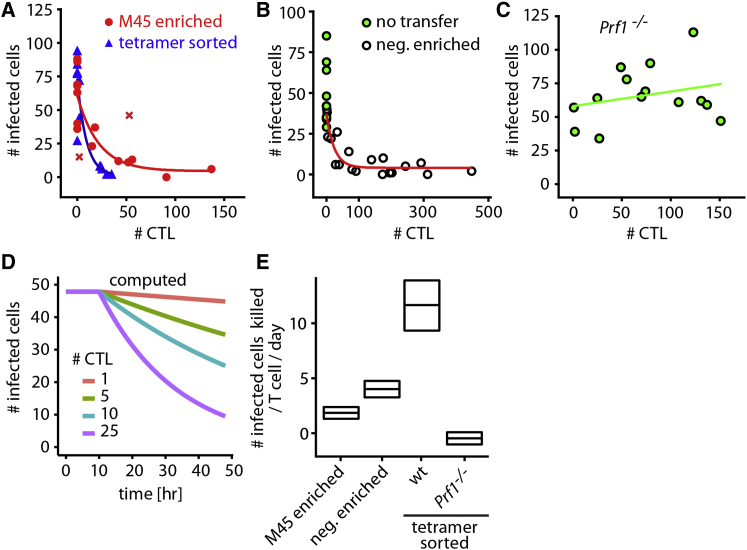
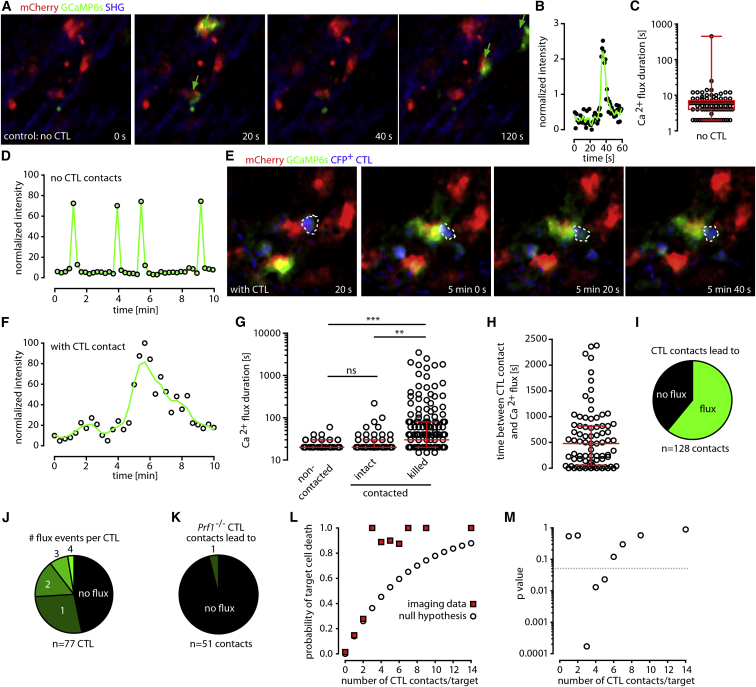
According to in vitro assays, T cells are thought to kill rapidly and efficiently, but the efficacy and dynamics of cytotoxic T lymphocyte (CTL)-mediated killing of virus-infected cells in vivo remains elusive. We used two-photon microscopy to quantify CTL-mediated killing in mice infected with herpesviruses or poxviruses. On average, one CTL killed 2-16 virus-infected cells per day as determined by real-time imaging and by mathematical modeling. In contrast, upon virus-induced MHC class I downmodulation, CTLs failed to destroy their targets. During killing, CTLs remained migratory and formed motile kinapses rather than static synapses with targets. Viruses encoding the calcium sensor GCaMP6s revealed strong heterogeneity in individual CTL functional capacity. Furthermore, the probability of death of infected cells increased for those contacted by more than two CTLs, indicative of CTL cooperation. Thus, direct visualization of CTLs during killing of virus-infected cells reveals crucial parameters of CD8(+) T cell immunity.


Figures

None
Graphical abstract
Figure 1
Figure 1
Single-Cell Visualization Allows for Quantification of Virus-Infected Cell Numbers (A) Detection of mCherry+ MCMV-infected cells (white) by epi-fluorescence microscopy in cortical region of the popliteal lymph node 48 hr after MCMV-3D footpad injection (106 plaque-forming units [PFU]) into B6 mice. (B) One day after infection, MCMV-infected cells expressing mCherry (red) and second harmonic generation signals (SHG, blue) were observed by two-photon microscopy. Scale bar represents 20 μm. (C) Non-infected lymph node imaged at an identical region. Scale bar represents 20 μm. (D) MCMV-3D-infected cells (red) and counterstaining with anti-CD45 (upper panel; green) and anti-CD169 (lower panel; cyan). Pictures shown in (A)–(D) are representative of >15 experiments. Scale bar represents 20 μm. (E) Distance of MCMV-infected cells to the lymph node capsule. Dots represent cells, and bars represent medians. Data were pooled from six mice from two independent experiments. ns, not significant. (F) After infection with different doses of MCMV-3D, the number of MCMV-infected cells observed by microscopy was plotted against MCMV-expressed luciferase signals. The red line represents linear regression, and the 99% prediction interval is shown in gray.
Figure 2
Figure 2
Cytotoxic T lymphocytes Fail to Kill Infected Cells Protected by Viral MHC-I Immune Evasion Protocol for generation of CTLs: 105 naive FP-expressing OT-I cells were transferred into C57BL/6 mice and activated at day 1 by different protocols. After expansion, different MCMV strains were injected into the footpad, and two-photon microscopy was used for studying CTL behavior and the number of infected cells in the draining popliteal lymph node. (A) On day 5 after priming, all GFP+ FP-OT-I CTLs expressed CD44 after expansion. Flow cytometry was gated on all blood CD8+ T cells. (B) The percentage of FP-OT-I CTLs (of total leukocytes) in blood after priming by different protocols (data were pooled from at least six independent experiments). (C) The percentage of OT-I CTLs in blood is plotted against the percentage of OT-I CTLs found in brachial lymph nodes. Dots represent lymph nodes, and the red line represents linear regression. Data were pooled from three independent experiments. (D) One day after infection, OT-I CTLs in the popliteal lymph node were stained for surface CD69 expression. MCMV-2D (2D) was used as a SIINFEKL-negative control, and Kruskal-Wallis and Dunn’s tests were used for comparing multiple groups. Dots represent lymph nodes, and red lines represent medians. Data were pooled from at least three experiments. ∗∗p < 0.01; ns, not significant. (E–G) One day after infection with the viruses indicated, OT-I CTLs were observed in regions harboring infected cells (upper panel), and numbers of infected cells were counted (lower panel). In the upper panels, 10 min tracks are shown in gray, and scale bars represent 20 μm. In the lower panels, dots represent lymph nodes, and lines represent linear regression (E and F) or one-phase exponential decay (G). Data were pooled from at least six experiments. CTL priming was performed with SIINFEKL and poly(I:C) in (C)–(G).
Figure 3
Figure 3
Cognate Antigen Presentation and Viral Immune Evasion Determine the Migration Behavior of CTLs while Attacking Virus-Infected Cells (A–C) One day after infection, two-photon microscopy was used to quantify OT-I CTL track speed (A), motility coefficient, (B) and turning angles (C) in movies with intact MCMV-infected cells. Dots represent median values from all tracks per movie, and red bars represent IQRs. Kruskal-Wallis and Dunn’s tests were used for comparing multiple groups. Data were pooled from two to six independent experiments per condition. p < 0.05; ∗∗p < 0.01; ns, not significant. (D) OT-I CTL population median track straightness (y axis) was compared to median track speed (x axis) per imaging region (dots represent median track straightness and median track speed for the different viruses per mouse). CTL priming was performed with SIINFEKL and poly(I:C); see also Figure S1.
Figure 4
Figure 4
Two-Photon Microscopy Allows for Real-Time Visualization of CTL-Mediated Killing of Virus-Infected Cells (A) Upper panel: two-photon microscopy revealed disruption of mCherry+ infected cells (red) and contact events by OT-I CTLs (green) 14 hr after MCMV-3D-ΔvRAP infection of mice harboring FP-CTLs (elapsed time displayed). Scale bar represents 20 μm. Lower panel: example of mCherry+ cell-body morphology during disruption (CTLs not shown). Dots represent center spots of original cell and large fragments. Scale bar represents 5 μm. (B) Example of four CTLs (red, orange, green, and blue tracks) that interacted with one virus-infected target (red). (C) Instantaneous speed of the four CTLs shown in (B). (D) Number of OT-I CTL contacts (>1 min) with MCMV-3D-ΔvRAP-infected target cells that survived (intact) or were killed during the observation period of 1–3 hr. Dots represent target cells. ∗∗∗p < 0.001. (E) Cumulative CTL-contact duration per target cell. Dots represent target cells. ∗∗∗p < 0.001. (F) Duration of individual CTL-contact events. Dots represent CTL contacts. ns, not significant. (D–F) Red bars represent the median with IQR, and data were pooled from nine movies from four independent experiments. A Mann-Whitney test was used for comparing intact and killed target cells. (G) Duration of OT-I CTL contact with MCMV-2D-, MCMV-3D-, and MCMV-3D-ΔvRAP-infected cells. Here, data from CTLs not in contact with infected cells are shown (independent analysis of dataset used in D–F). p < 0.05; ns, not significant. (H) Percentage of CTLs that showed target-cell contact (data from G). (I) Time from first observed CTL contact to death of MCMV-3D-ΔvRAP-infected cells. Target-cell death was defined as complete target disintegration, as shown in (A) and (B) (relative frequencies and binned data from 76 killed infected cells from four independent experiments are shown). CTL priming was performed with SIINFEKL and poly(I:C) in (A)–(H). In (I), data with MVA-OVA priming was also added; see also Figures S2, S3, and S4.
Figure 5
Figure 5
CTLs Show Low Average PCKRs in Both Poxvirus and Cytomegalovirus Infection Models Experimental setup for two-photon imaging of MVA-infected lymph nodes: transfer of FP-OT-I (day 0), expansion with SIINFEKL plus poly(I:C) (day 1), infection with MVA or MVA-OVA (day 6), and two-photon imaging (day 7). (A) One day after footpad infection with MVA or MVA-OVA (107 PFU), two-photon microscopy was used for observing OT-I CTLs (green) at the site of MVA-infected mCherry+ cells (red). (B) Median track speed of the OT-I CTL population in non-infected or MVA- or MVA-OVA-infected lymph nodes. Dots represent the mean of >50 CTLs analyzed per lymph node, and red bars represent the mean ± SD. A t test with Welch’s correction was used for comparing MVA and MVA-OVA. ∗∗p < 0.01. (C) OT-I CTL contacts with MVA- or MVA-OVA-infected cells were analyzed. Dots represent contact duration per CTL, and red bars represent IQRs. A Mann-Whitney test was used for comparing MVA and MVA-OVA. ∗∗p < 0.01. (D) One day after infection, the number of OT-I CTLs and MVA-infected cells per imaging region was correlated (green dots, MVA infection; green line, linear regression; red dots, MVA-OVA infection; red line, one-phase exponential decay). Dots represent individual mice (B), cells (C), and lymph nodes (D). Data were pooled from three independent experiments in (B)–(D). Scale bars represent 20 μm. (E) OT-I CTLs PCKRs were calculated from automated-cell-tracking data for different MCMV and MVA strains. Dots represent movies, and red bars represent IQRs. A Kruskal-Wallis test was used for comparing multiple groups (outliers are not shown but were included in the test). p < 0.05; ns, not significant.
Figure 6
Figure 6
Intralymphatic CTL Transfer and Mathematical Modeling Show Low Killing Rates Protocol for intralymphatic transfer: MCMV-3D-ΔvRAP footpad infection (0 hr), intralymphatic injection of different types of CTLs (∼4 hr), and two-photon imaging of single time points (∼24 hr). (A) One day after infection and intralymphatic delivery of M45-tetramer-enriched CTLs (red) or M45-, M38-, and M139-tetramer-sorted CTLs (blue), the number of MCMV-3D-ΔvRAP-infected cells and CTLs per imaging region was counted from images of single time points. (B) Same as (A) either without cell transfer or after injection of negatively enriched CTLs (magnetic depletion of CD62Lhi and non-CD8+ T cells). (C) Same as (A) after injection of perforin-deficient tetramer-sorted CTLs. (A–C) Data pooled from seven independent experiments (dots represent lymph nodes, and lines represent exponential decay). CTL priming was performed with intraperitoneal infection of CTL-donor mice with MCMV-3D. (D) Mathematical modeling calculating the kinetics of infected cell numbers in a standard imaging region at the infected site of the lymph node cortical sinus, depending on the number of CTLs present (plot of infected cell numbers over time). (E) The number of infected cells killed per T cell per day (PCKR) for the different CTL populations was calculated by the mathematical model from the raw data (median and 95% confidence interval) shown in (A)–(C). See Supplemental Experimental Procedures for details on the mathematical model.
Figure 7
Figure 7
CTLs Trigger Ca2+ Fluxes in Virus-Infected Cells and Cooperate during Killing (A) One day after infection with MCMV-expressing Ca2+ sensor GCaMP6s (MCMV-3D-ΔvRAP-Ca), two-photon microscopy was used to record GCaMP6s intensity (green) in virus-infected cells (red). (B) Kinetics of GCaMP6s intensity in an infected cell imaged at 0.2 Hz. (C) Ca2+ flux (defined as GCaMP6sbright event) duration in virus-infected cells in the absence of specific CTLs (dots represent cells, and red bars represent IQRs; n = 98 infected cells from three mice). (D) Kinetics of Ca2+ fluxes in one infected cell imaged for 10 min at 0.07 Hz. (E) In lymph nodes with MVA-OVA-primed CTLs present, a CFP+ OT-I CTL (blue; dotted line) contacted a MCMV-3D-ΔvRAP-Ca-infected cell (long flux defined as GCaMP6sbright event lasting >30 s). (F) Kinetics of a long-lasting Ca2+ flux of an infected cell imaged for 10 min at 0.05 Hz. The green line represents the locally weighted scatterplot smoothing curve. (G) Duration of Ca2+ fluxes of infected cells that were not contacted, were contacted but stayed intact, or were contacted and killed. Dots represent cells, and red bars represent IQRs. A Kruskal-Wallis test was used for comparing multiple groups. Data were pooled from four experiments from six different mice for a total of 307 flux events analyzed. ∗∗p < 0.01; ∗∗∗p < 0.001; ns, not significant. (H) Time interval between CTL contact and subsequent long-lasting Ca2+ flux (n = 79 events from four experiments analyzed; red bars represent IQRs). (I) Percentages of CTL contacts that were followed by a long-lasting Ca2+ flux (n = 128 CTLs). Data were pooled from four experiments. (J) Percentages of different numbers of long-lasting Ca2+ fluxes that followed a CTL contact event (n = 77 CTLs). Data were pooled from four experiments. (K) Percentage of long-lasting Ca2+ fluxes that followed contacts of Prf−/− CTLs (n = 51 contacts pooled from three experiments). (L) Probability of target-cell death for infected cells contacted by 0–14 CTLs. Hypothetical values for the no-cooperativity null hypothesis (open dots) and observed data (red squares) are provided. In total, 660 infected cells were analyzed, and data were pooled from >12 independent experiments. (M) p values for comparing data derived from the null hypothesis and observed data (0.05 significance level indicated by dotted line); see also Figures S5, S6, and S7.

Comment in

References

    1. Altman J.D., Moss P.A., Goulder P.J., Barouch D.H., McHeyzer-Williams M.G., Bell J.I., McMichael A.J., Davis M.M. Phenotypic analysis of antigen-specific T lymphocytes. Science. 1996;274:94–96. - PubMed
    1. Aramburu J., Garcia-Cózar F., Raghavan A., Okamura H., Rao A., Hogan P.G. Selective inhibition of NFAT activation by a peptide spanning the calcineurin targeting site of NFAT. Mol. Cell. 1998;1:627–637. - PubMed
    1. Beltman J.B., Marée A.F.M., de Boer R.J. Analysing immune cell migration. Nat. Rev. Immunol. 2009;9:789–798. - PubMed
    1. Braun A., Worbs T., Moschovakis G.L., Halle S., Hoffmann K., Bölter J., Münk A., Förster R. Afferent lymph-derived T cells and DCs use different chemokine receptor CCR7-dependent routes for entry into the lymph node and intranodal migration. Nat. Immunol. 2011;12:879–887. - PubMed
    1. Breart B., Lemaître F., Celli S., Bousso P. Two-photon imaging of intratumoral CD8+ T cell cytotoxic activity during adoptive T cell therapy in mice. J. Clin. Invest. 2008;118:1390–1397. - PMC - PubMed

Publication types

MeSH terms