. 2016 Oct 15:272:19-32.
doi: 10.1016/j.jneumeth.2016.02.004. Epub 2016 Feb 10.

Mass spectrometry imaging of rat brain lipid profile changes over time following traumatic brain injury

Affiliations

Mass spectrometry imaging of rat brain lipid profile changes over time following traumatic brain injury

Aurelie Roux et al. J Neurosci Methods. .

Abstract

Background: Mild traumatic brain injury (TBI) is a common public health issue that may contribute to chronic degenerative disorders. Membrane lipids play a key role in tissue responses to injury, both as cell signals and as components of membrane structure and cell signaling. This study demonstrates the ability of high resolution mass spectrometry imaging (MSI) to assess sequences of responses of lipid species in a rat controlled cortical impact model for concussion.

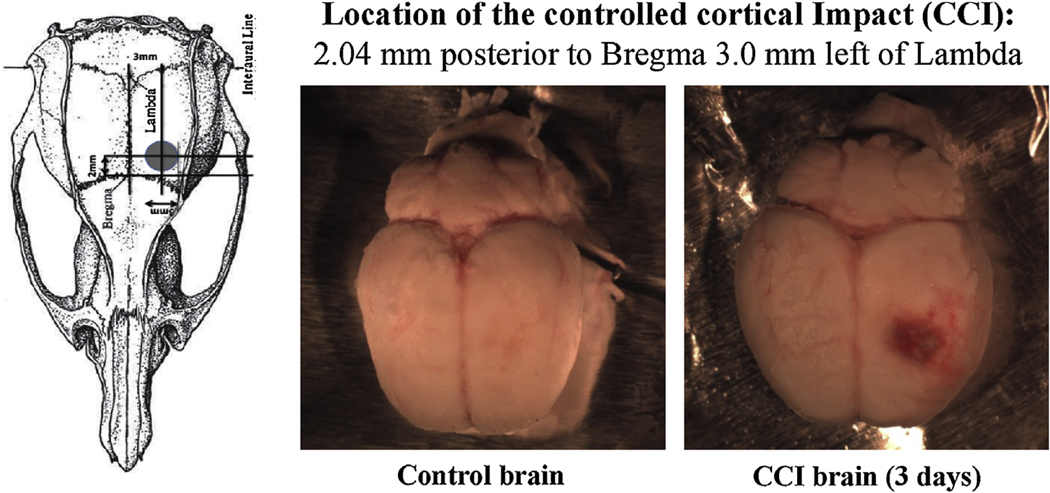
New method: A matrix of implanted silver nanoparticles was implanted superficially in brain sections for matrix-assisted laser desorption (MALDI) imaging of 50μm diameter microdomains across unfixed cryostat sections of rat brain. Ion-mobility time-of-flight MS was used to analyze and map changes over time in brain lipid composition in a rats after Controlled Cortical Impact (CCI) TBI.

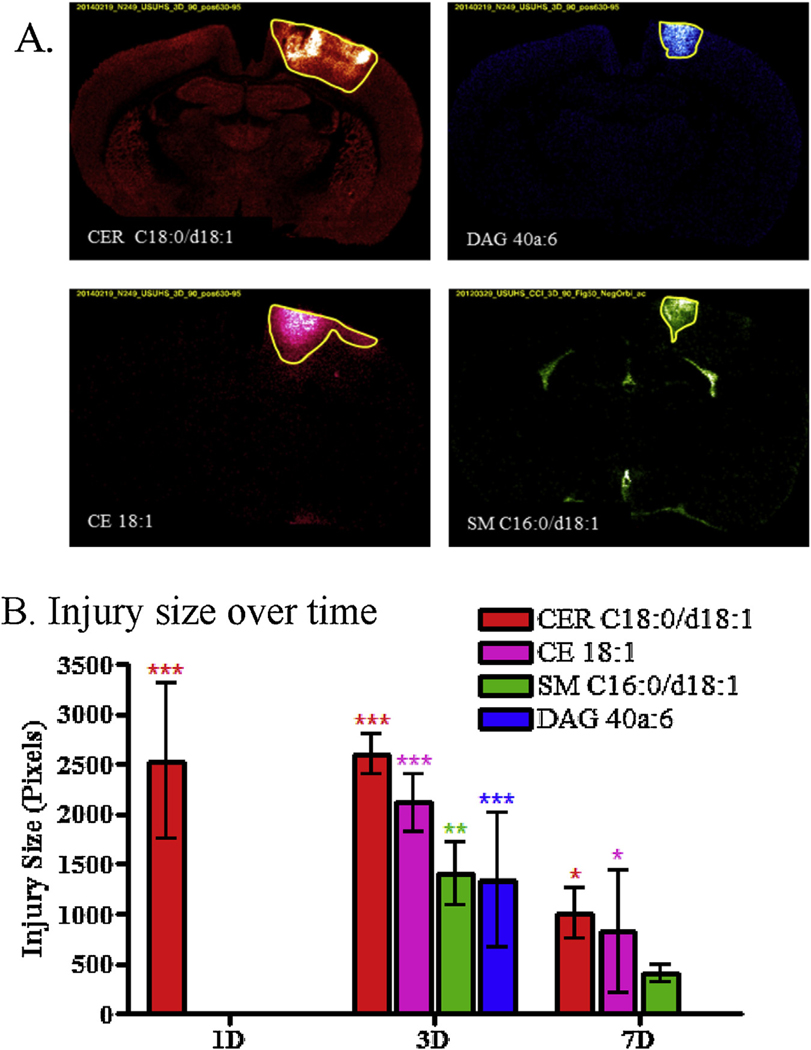
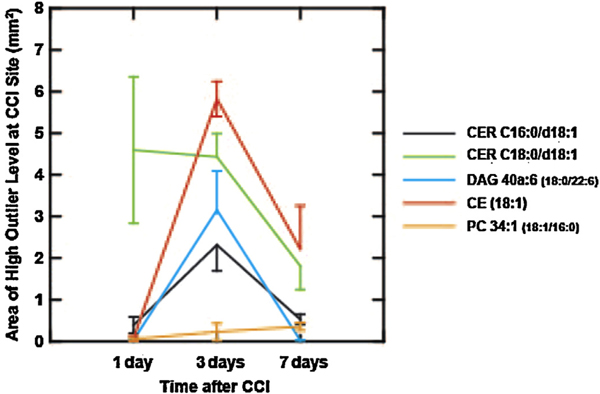
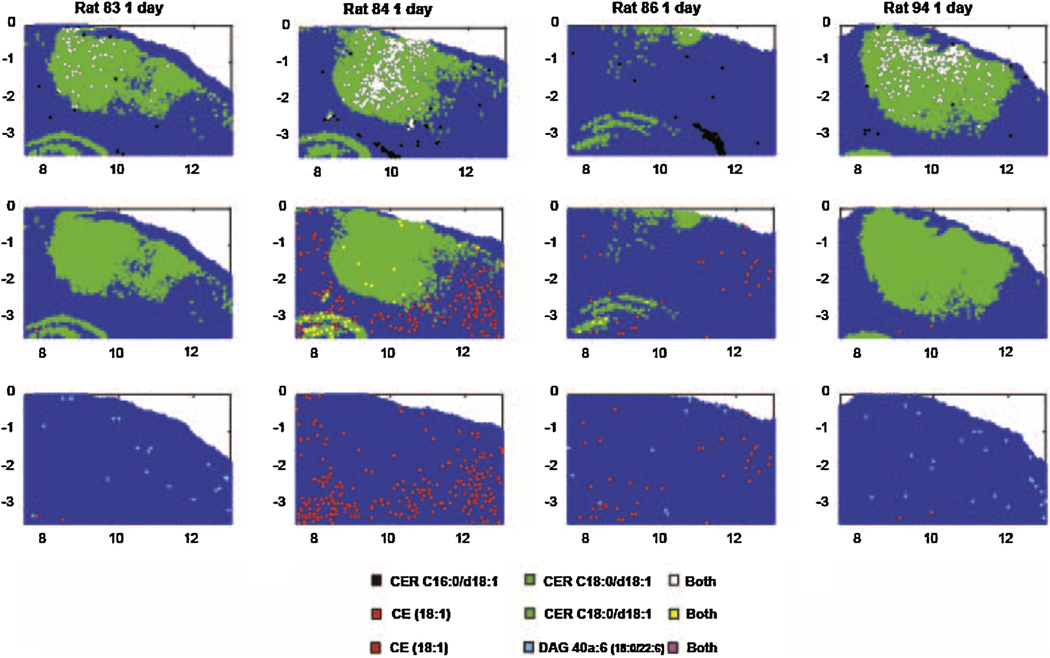
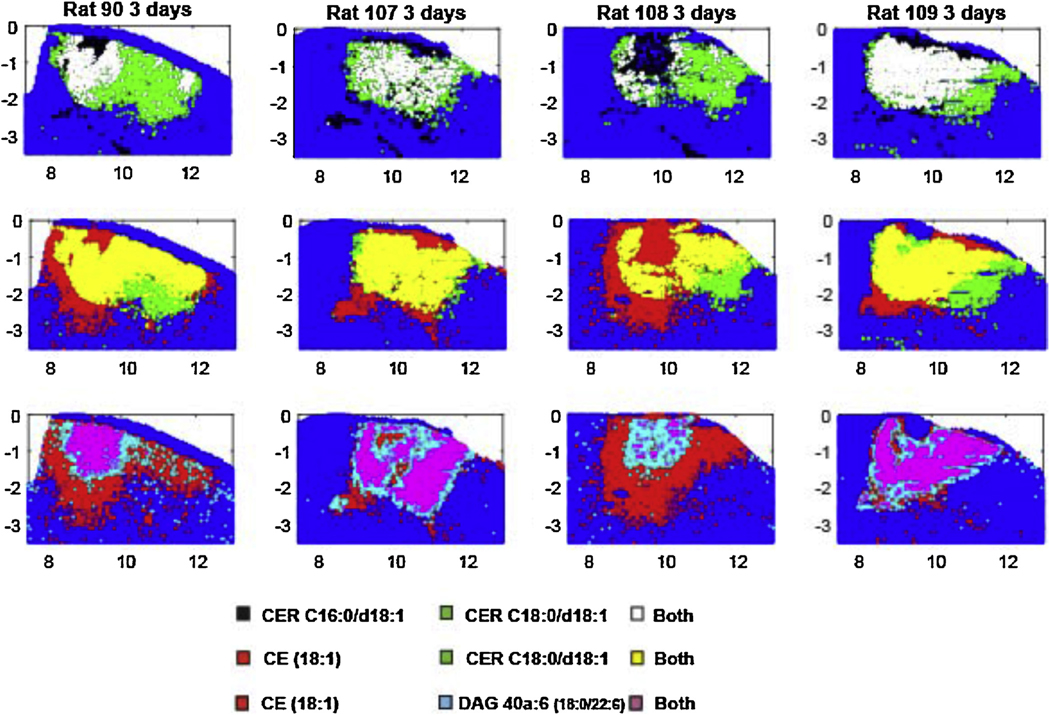
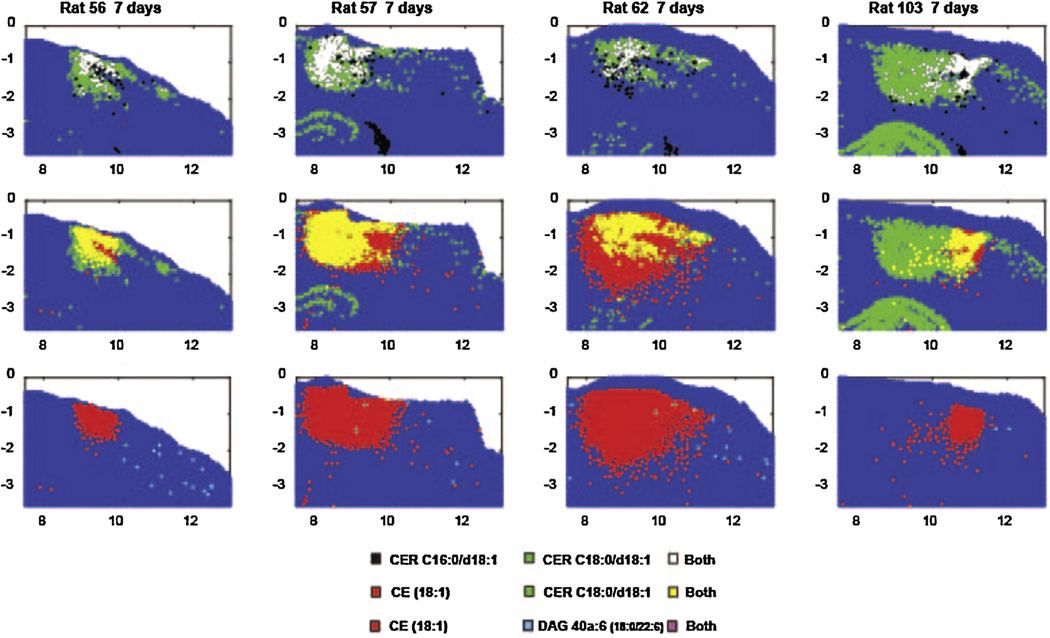
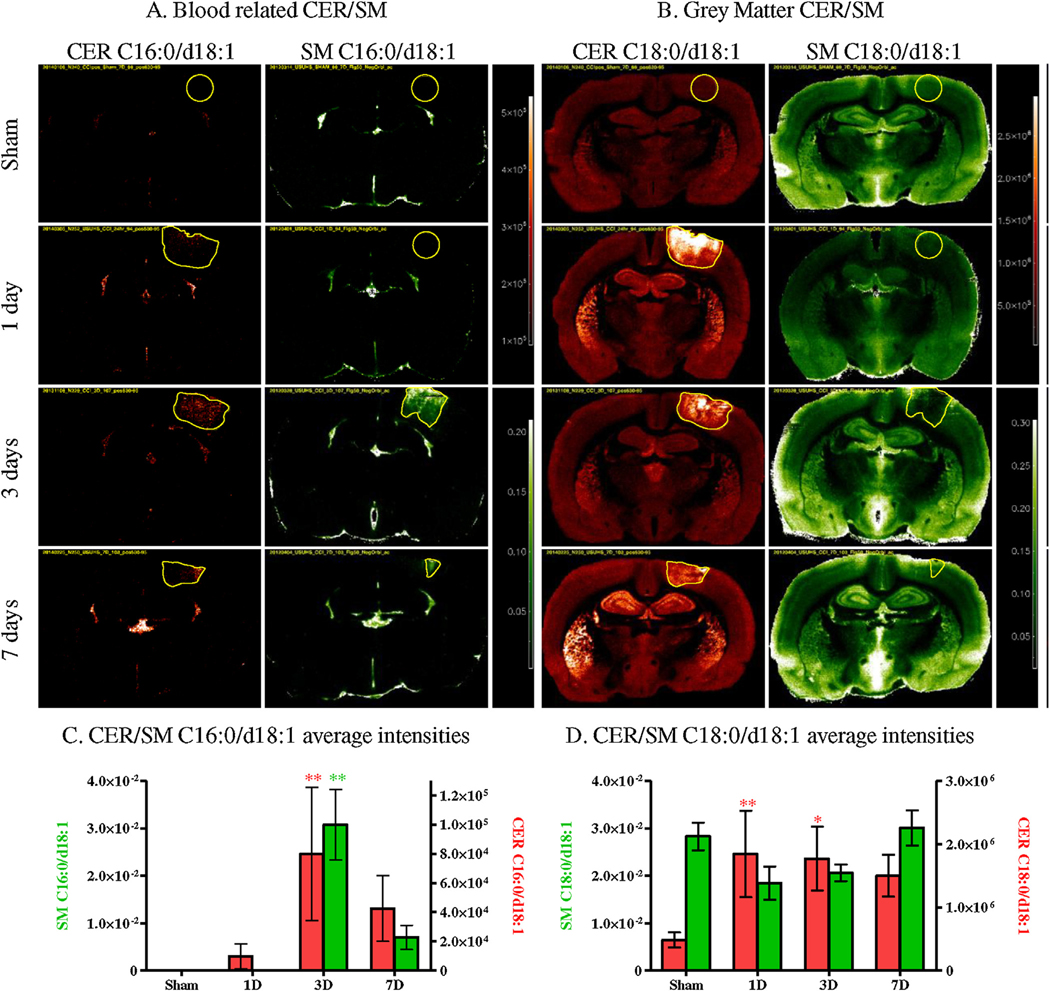
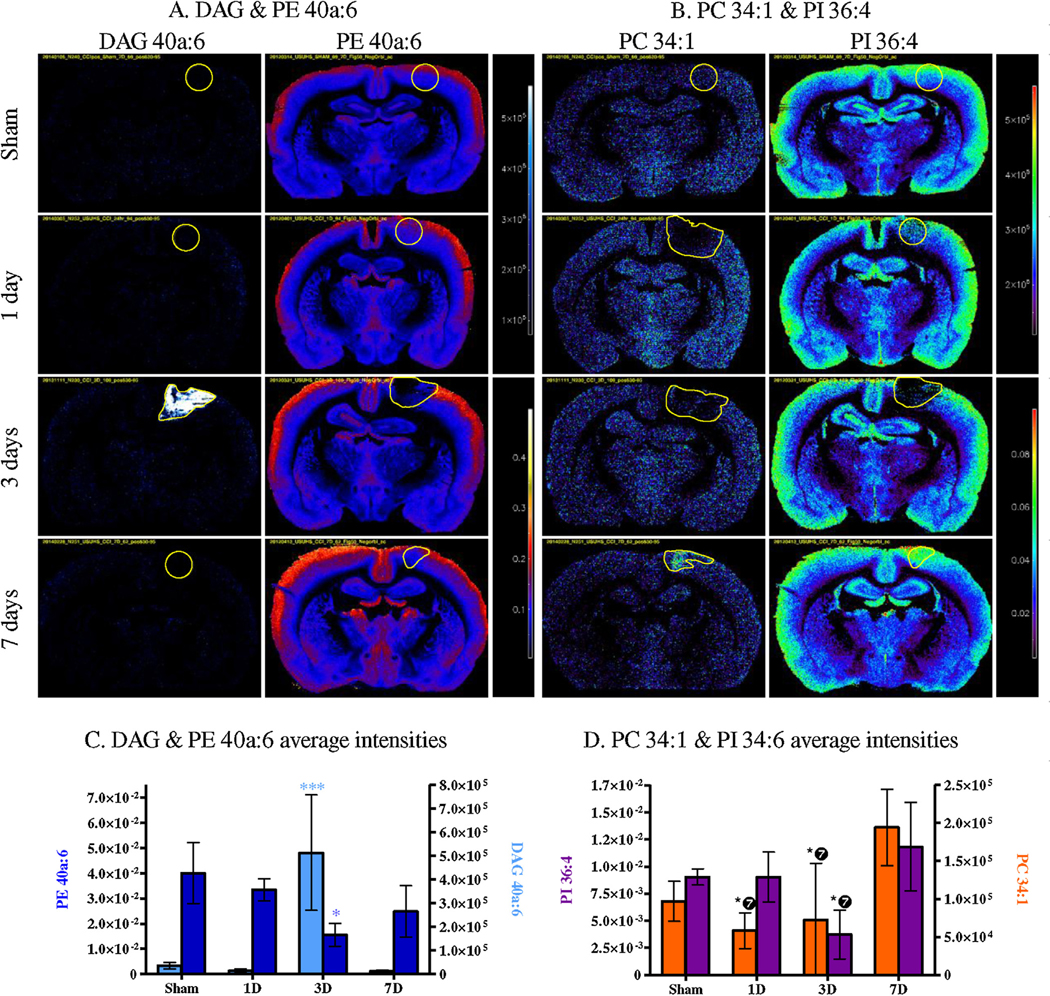
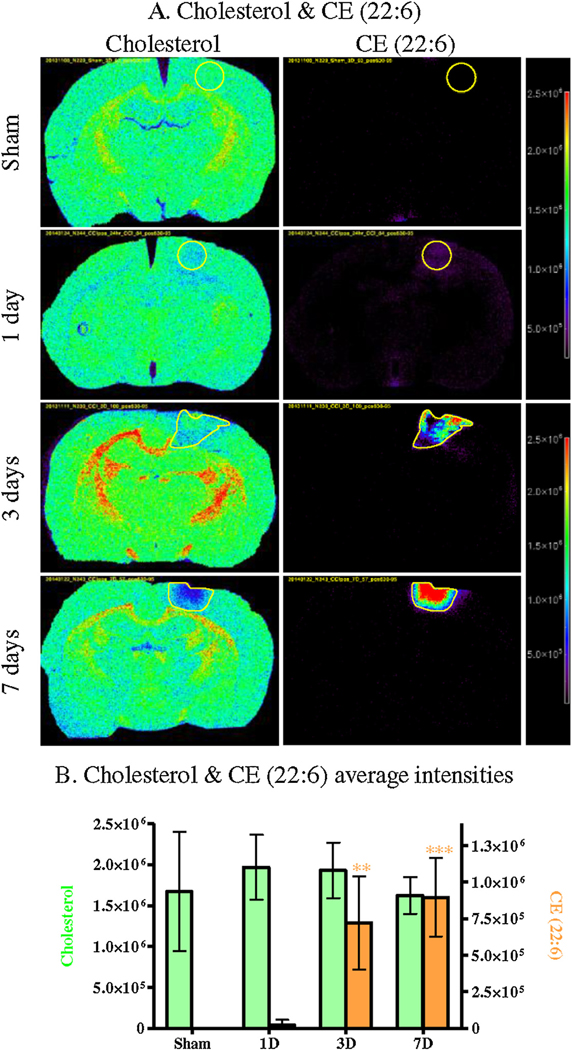
Results: Brain MS images showed changes in sphingolipids near the CCI site, including increased ceramides and decreased sphingomyelins, accompanied by changes in glycerophospholipids and cholesterol derivatives. The kinetics differed for each lipid class; for example ceramides increased as early as 1 day after the injury whereas other lipids changes occurred between 3 and 7 days post injury.

Comparison with existing method(s): Silver nanoparticles MALDI matrix is a sensitive new tool for revealing previously undetectable cellular injury response and remodeling in neural, glial and vascular structure of the brain.

Conclusions: Lipid biochemical and structural changes after TBI could help highlighting molecules that can be used to determine the severity of such injuries as well as to evaluate the efficacy of potential treatments.

Keywords: Controlled cortical impact; Lipids; Mass spectrometry imaging; Silver nanoparticles implantation; Traumatic brain injury.


Figures

Fig. 1.
Fig. 1.
Location of the Controlled cortical Impact in the Adult male Sprague-Dawley rat brains.
Fig. 2.
Fig. 2.
Size of the different ROIs defining the area of injury region for CER C18:0/d18:1 (m/z 674.45, red), CE 18:1 (m/z 757.51, pink), SM C16:0/d18:1 (m/z 687.54, green) and DAG 40a:6 (m/z 775.44, blue). (A) MSI at 3 days for the lipids that were used to define the injury ROI. (B) Graphs of the size of the injury ROI over time (Bonferroni post-test compared to controls injury size = 0, * p < 0.05, ** p < 0.01, *** p < 0.001). When no changes were observed at a specific time point, no ROI was defined as for CE 18:1, SM C16:0/d18:1 and DAG 40a:6 1 day after the injury. (For interpretation of the references to color in this figure legend, the reader is referred to the web version of this article.)
Fig. 3.
Fig. 3.
The area occupied by 50 μm samples that showed levels greater than the 99.5th percentile of sham control brains for five lipid species. The levels were measured at the total area under the MS peaks for each positive ion species (m/z 644.4171 CER C16:0/d18:1[M + Ag107]+, m/z 674.4481 CER C18:0/d18:1 [Ag109] [M + Ag109]+, m/z 775.4430 DAG 40a:6 (18:0/22:6) [M + Ag107]+, m/z 757.5052 CE (18:1) [M + Ag107]+, and m/z 866.4824 PC 34:1 (18:1/16:0) [M + Ag107]+ ), and the 99.5th percentile point was identified from more than 200,000 pooled sampling sites from sections from 4 sham control rats (anesthesia and craniotomy but no CCI). The spatial distributions of sites showing lipid concentrations greater than the respective 99.5th percentile cutoff at the CCI site are shown in Figs. 4–6. The number of 50 μm sites was divided by 400 to yield the area of high outlier levels this graph; error bars represent the standard error.
Fig. 4.
Fig. 4.
The distribution 50 μm samples that showed levels greater than the 99.5th percentile of sham control brains for four lipid species, one day after CCI. The levels were measured at the total area under the MS peaks for each positive ion species (m/z 644.4171 CER C16:0/d18:1[M + Ag107]+, m/z 674.4481 CER C18:0/d18:1 [Ag109] [M + Ag109]+, m/z 775.4430 DAG 40a:6 (18:0/22:6) [M + Ag107]+, m/z 757.5052 CE (18:1) [M + Ag107]+, and m/z 866.4824 PC 34:1 (18:1/16:0) [M + Ag107]+). The data are displayed from a section through the CCI site in four rats. The upper row shows data for sample sites displaying high values of the CER C16 alone, CER C18 alone and both. The middle row shows data for sample sites displaying high values of the cholesteryl ester (CE) alone, CER C18 alone and both. The lower row shows the distributions for outlier levels of CE alone, outlier levels of the DAG species alone and both in the same sample.
Fig. 5.
Fig. 5.
The distribution 50 μm samples that showed levels greater than the 99.5th percentile of sham control brains for four lipid species, three days after CCI. The levels were measured at the total area under the MS peaks for each positive ion species (m/z 644.4171 CER C16:0/d18:1[M + Ag107]+, m/z 674.4481 CER C18:0/d18:1 [Ag109] [M + Ag109]+, m/z 775.4430 DAG 40a:6 (18:0/22:6) [M + Ag107]+, m/z 757.5052 CE (18:1) [M + Ag107]+, and m/z 866.4824 PC 34:1 (18:1/16:0) [M + Ag107]+). The data are displayed from a section through the CCI site in four rats. The upper row shows data for sample sites displaying high values of the CER C16 alone, CER C18 alone and both. The middle row shows data for sample sites displaying high values of the cholesteryl ester (CE) alone, CER C18 alone and both. The lower row shows the distributions for outlier levels of CE alone, outlier levels of the DAG species alone and both in the same sample.
Fig. 6.
Fig. 6.
The distribution 50 μm samples that showed levels greater than the 99.5th percentile of sham control brains for four lipid species, seven days after CCI. The levels were measured at the total area under the MS peaks for each positive ion species (m/z 644.4171 CER C16:0/d18:1[M + Ag107]+, m/z 674.4481 CER C18:0/d18:1 [Ag109] [M + Ag109]+, m/z 775.4430 DAG 40a:6 (18:0/22:6) [M + Ag107]+, m/z 757.5052 CE (18:1) [M + Ag107]+, and m/z 866.4824 PC 34:1 (18:1/16:0) [M + Ag107]+). The data are displayed from a section through the CCI site in four rats. The upper row shows data for sample sites displaying high values of the CER C16 alone, CER C18 alone and both. The middle row shows data for sample sites displaying high values of the cholesteryl ester (CE) alone, CER C18 alone and both. The lower row shows the distributions for outlier levels of CE alone, outlier levels of the DAG species alone and both in the same sample.
Fig. 7.
Fig. 7.
MSI of controls (Sham) and CCI brains (1 day, 3 days and 7 days) for blood related CER/SM C16:0/d18:1 (A) and grey matter CER/SM C18:0/d18:1 (B) (CER in red, SM in green). Average intensities within the injury ROI in controls (Sham) and CCI brains (1 day, 3 days and 7 days) for CER/SM C16:0/d18:1 (C) and CER/SM C18:0/d18:1 (D) (CER in red, SM in green) (Bonferroni post-test compared intensity in controls, * p < 0.05, ** p < 0.01, *** p < 0.001).
Fig. 8.
Fig. 8.
MSI of controls (Sham) and CCI brains (1 day, 3 days and 7 days) for DAG and PE 40a:6 (A), PC 34:1 and PI 36:4 (B) (DAG in blue/white, PE in red/blue, PC and PI in rainbow). Average intensities within the injury ROI in controls (Sham) and CCI brains (1 day, 3 days and 7 days) for DAG and PE 40a:6 (C), PC 34:1 and PI 36:4 (D) (DAG in light blue, PE in navy blue, PC in dark orange and PI in purple). (Bonferroni post-test compared intensity in controls, * p < 0.05, ** p < 0.01, *** p < 0.001, for PC and PI ❼ means the significance is compared to 7 days, not sham).
Fig. 9.
Fig. 9.
MSI of controls (Sham) and CCI brains (1 day, 3 days and 7 days) for cholesterol and CE 22:6 (A) (CHL and CE in rainbow). Average intensities within the injury ROI in controls (Sham) and CCI brains (1 day, 3 days and 7 days) for cholesterol and CE 22:6 (CGL in light green, CE in light orange) (B). (Bonferroni post-test compared intensity in controls, * p < 0.05, ** p < 0.01, *** p < 0.001).

Similar articles

Cited by

References

    1. Adibhatla RM, Hatcher JF, Dempsey RJ. Lipids and lipidomics in brain injury and diseases. AAPS J 2006;8:E314–21. - PMC - PubMed
    1. Agrawal A, Timothy J, Pandit L, Manju M. Post-traumatic epilepsy: an overview. Clin Neurol Neurosurg 2006;108:433–9. - PubMed
    1. Altura BM, Gebrewold A, Zheng T, Altura BT. Sphingomyelinase and ceramide analogs induce vasoconstriction and leukocyte-endothelial interactions in cerebral venules in the intact rat brain: insight into mechanisms and possible relation to brain injury and stroke. Brain Res Bull 2002;58:271–8. - PubMed
    1. Aureli M, Murdica V, Loberto N, Samarani M, Prinetti A, Bassi R, Sonnino S. Exploring the link between ceramide and ionizing radiation. Glycoconj J 2014;31: 449–59. - PubMed
    1. Colsch B, Woods AS. Localization and imaging of sialylated glycosphingolipids in brain tissue sections by MALDI mass spectrometry. Glycobiology 2010;20:661–7. - PMC - PubMed

Publication types