. 2016 Feb 23;113(8):2258-63.
doi: 10.1073/pnas.1525564113. Epub 2016 Feb 12.

Transcription-associated processes cause DNA double-strand breaks and translocations in neural stem/progenitor cells

Affiliations

Transcription-associated processes cause DNA double-strand breaks and translocations in neural stem/progenitor cells

Bjoern Schwer et al. Proc Natl Acad Sci U S A. .

Abstract

High-throughput, genome-wide translocation sequencing (HTGTS) studies of activated B cells have revealed that DNA double-strand breaks (DSBs) capable of translocating to defined bait DSBs are enriched around the transcription start sites (TSSs) of active genes. We used the HTGTS approach to investigate whether a similar phenomenon occurs in primary neural stem/progenitor cells (NSPCs). We report that breakpoint junctions indeed are enriched around TSSs that were determined to be active by global run-on sequencing analyses of NSPCs. Comparative analyses of transcription profiles in NSPCs and B cells revealed that the great majority of TSS-proximal junctions occurred in genes commonly expressed in both cell types, possibly because this common set has higher transcription levels on average than genes transcribed in only one or the other cell type. In the latter context, among all actively transcribed genes containing translocation junctions in NSPCs, those with junctions located within 2 kb of the TSS show a significantly higher transcription rate on average than genes with junctions in the gene body located at distances greater than 2 kb from the TSS. Finally, analysis of repair junction signatures of TSS-associated translocations in wild-type versus classical nonhomologous end-joining (C-NHEJ)-deficient NSPCs reveals that both C-NHEJ and alternative end-joining pathways can generate translocations by joining TSS-proximal DSBs to DSBs on other chromosomes. Our studies show that the generation of transcription-associated DSBs is conserved across divergent cell types.

Keywords: alternative end-joining; neural stem cells; nonhomologous end-joining; transcription; translocation.


Conflict of interest statement

The authors declare no conflict of interest.

Figures

Fig. 1.
Fig. 1.
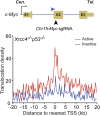
DSBs and translocations are enriched around active TSSs in NSPCs. (A, Upper) Diagram of the N-myc locus and sgRNA target site (Chr12-sgRNA-1; vertical black arrowhead) and the location and orientation of HTGTS primer (horizontal blue arrowhead). Cen, centromere; E, exon; Tel, telomere. (Lower) Distribution of HTGTS junctions relative to TSSs genome-wide. Junctions from Chr12-sgRNA-1expressing Xrcc4−/−p53−/− NSPCs (n = 12,236) are plotted in relation to the nearest RefGene (42) TSS (0 on the x axis). Negative numbers on the x axis indicate locations upstream of TSS; positive numbers on the x axis indicate locations downstream of TSS. The translocation density per 10,000 junctions (bin size 300 bp) relative to the TSS of active (red) or inactive (blue) genes, as determined by GRO-seq. (4), is shown. (B, Upper) Diagram of the 25×I-SceI c-Myc locus; the HTGTS primer and orientation are indicated by the horizontal blue arrowhead. (Lower) Distribution of HTGTS junctions relative to TSSs genome-wide. Junctions from TA-treated ATM−/− R26I-SceI-GR c-Myc25xI-SceI NSPCs (n = 9,788) are plotted in relation to the nearest RefGene (42) TSS; details are as in A.
Fig. S1.
Fig. S1.
Analyses of NSPCs GRO-seq libraries. (A) Reproducibility of GRO-seq biological replicates from Xrcc4−/−p53−/− (Left) or ATM−/− R26I-SceI-GR c-Myc25xI-SceI (Right) NSPCs. The GRO-seq signal per 10-kb genomic bin per replicate is plotted. The Pearson correlation coefficient (r) among biological replicates (n = 3) is stated and indicated by red lines. (B) Combined Metagene profiles of Xrcc4−/−p53−/− (Left) or ATM−/− R26I-SceI-GR c-Myc25xI-SceI (Right) GRO-seq libraries within 1.5 kb of TSSs; antisense (red trace) and sense (blue trace) transcriptions are indicated.
Fig. S2.
Fig. S2.
Regions proximal to active TSSs are enriched with DSBs and translocations in NSPCs. (Upper) Diagram of the c-Myc locus. The sgRNA target site (Chr15-Myc-sgRNA) and HTGTS primer are indicated as in Fig. 1A. (Lower) Distribution of HTGTS junctions relative to TSSs genome-wide. Junctions from Chr15-Myc-sgRNA–expressing Xrcc4−/−p53−/− NSPCs (n = 8,640) are plotted in relation to the nearest RefGene (42) TSS; details are as in Fig. 1A.
Fig. 2.
Fig. 2.
TSS-proximal junctions occur in genes that are highly and commonly transcribed in NSPCs and B lymphocytes. (A) Venn diagram illustrating the three classes (1–3) of genes transcribed in WT CSR-activated B lymphocytes and Xrcc4−/−p53−/− NSPCs. (B) Venn diagram showing class 1–3 genes transcribed in WT CSR-activated B lymphocytes and ATM−/−R26I-SceI-GR c-Myc25x I-SceI NSPCs. Class 1 genes are actively transcribed in NSPCs but are inactive in B cells. Class 2 genes are actively transcribed in both NSPCs and B cells. Class 3 genes are transcribed in B cells but not in NSPCs. Gene activity [reads per kilobase of transcript per million reads mapped (RPKM) ≥ 0.05] was determined by GRO-seq analysis. Numbers of genes per category are listed. (C and D) Plots showing the relative distance of junctions from Chr12-sgRNA-1–expressing Xrcc4−/−p53−/− NSPCs (C) or ATM−/−R26I-SceI-GR c-Myc25x I-SceI NSPCs (D) to the closest TSS of class 1 (blue trace), class 2 (red trace), and class 3 (black trace) genes. Figures are organized as described in Fig. 1A. (E) Box-and-whiskers plots of the transcription activity (GRO-seq density) of class 1 (Left) and class 2 (Center) genes and genes in class 2 containing HTGTS junctions located within 2 kb of the TSS from Chr12-sgRNA-1–expressing Xrcc4−/−p53−/− NSPCs or ATM−/−R26I-SceI-GR c-Myc25× I-SceI NSPCs (Right). (F) The number of genes in each group in E is indicated. The upper and lower box edges represent the 25th and 75th percentile, respectively; the horizontal line denotes the median. ****P < 0.0001; **P < 0.01 (Mann–Whitney u test).
Fig. S3.
Fig. S3.
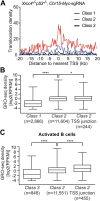
Distribution of HTGTS junctions in relation to the closest TSS of genes within class 1, 2, or 3. (A) The plot shows the relative distance of junctions from Chr15-Myc-sgRNA–expressing Xrcc4−/−p53−/− NSPCs to the closest TSS of class 1 (blue trace), class 2 (red trace), and class 3 (black trace) genes. Categories are as described in Fig. 2 A and B. Other details are as described for Fig. 2C. (B) Box-and-whiskers plot of transcription activity (GRO-seq density) of Xrcc4−/−p53−/− NSPCs genes in class 1 (Left) and class 2 (Center) genes and genes in class 2 that contain HTGTS junctions located within 2 kb of the TSS (Right) from Chr15-Myc-sgRNA–expressing Xrcc4−/−p53−/− NSPCs. The figure is organized as in Fig. 2E. ****P < 0.0001; *P < 0.05 (Mann–Whitney u test). (C) Box-and-whiskers plot of the transcription activity of WT CSR-activated B-cell genes in class 3 (Left) and class 2 (Center) and of genes in class 2 that contain HTGTS junctions located within 2 kb of the TSS (Right) from ATM−/− c-Myc25×I-SceI B cells; other details are as described in B. ****P < 0.0001 (Mann–Whitney u test).
Fig. 3.
Fig. 3.
Genes with TSS-proximal junctions show higher transcriptional activity than genes with junctions in the gene body located more than 2 kb from the TSS. (A) Active genes were determined by GRO-seq and were classified as class A (active genes with junctions located within 2 kb of the TSS) or class B (active genes with junctions within the gene body located more than 2 kb from the TSS). TTS, transcription termination site. (B) Box-and-whiskers plots of transcriptional activity (GRO-seq density) of class A and class B genes in Chr12-sgRNA-1–expressing Xrcc4−/−p53−/− NSPCs from four independent experiments or in TA-treated ATM−/− R26I-SceI-GR c-Myc25× I-SceI NSPCs from four independent experiments. Numbers of genes within each group: Chr12-sgRNA-1 Xrcc4−/−p53−/−: class A = 440 genes; class B = 2,377 genes; ATM−/− R26I-SceI-GR c-Myc25× I-SceI: class A = 311 genes; class B = 1,807 genes. The upper and lower box edges represent the 25th and 75th percentile, respectively; the horizontal line denotes the median. ****P < 0.0001 (Mann–Whitney u test).
Fig. S4.
Fig. S4.
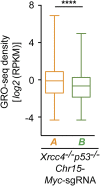
Active genes with TSS-proximal junctions show higher transcriptional activity on average than active genes with junctions in the gene body located more than 2 kb from the TSS. Box-and-whiskers plots of transcriptional activity (GRO-seq density) of class A and class B genes in Chr15-Myc-sgRNA–expressing Xrcc4−/−p53−/− NSPCs from four independent experiments. Numbers of genes within each group: Chr15-Myc-sgRNA Xrcc4−/−p53−/−: class A = 338 genes; class B = 1,915 genes; details are as described in Fig. 3B. ****P < 0.0001 (Mann–Whitney u test).
Fig. 4.
Fig. 4.
Repair junction signatures of TSS-proximal HTGTS junctions. (A) TSS-proximal HTGTS junction profiles (located within 2 kb of all TSSs) from Chr12-sgRNA-1–expressing NSPCs of the indicated genotypes. Joins with 0 (direct or “blunt” joins) to 10 bp of junctional MH were identified and plotted as a percentage of total junctions; insertions were excluded from the dataset. The number of independent experiments is indicated. Total junction numbers analyzed: n = 366 WT and n = 509 Xrcc4−/−p53−/− NSPCs. (B) The mean MH length of TSS-proximal HTGTS junctions indicated in bar graphs was determined in the indicated number of independent experiments. Data represent mean ± SEM; ***P < 0.001; **P < 0.01; *P < 0.05 (unpaired two-tailed t test).
Fig. S5.
Fig. S5.
Repair junction profiles of TSS-proximal HTGTS junctions. (A) TSS-proximal (located within 2 kb of annotated TSSs) HTGTS junction profiles from Chr15-Myc-sgRNA–expressing NSPCs of the indicated genotypes; details are as in Fig. 4A. Total junction numbers analyzed: 421 WT and 374 Xrcc4−/−p53−/− NSPCs. (B) Mean MH length; details are as in Fig. 4B. Data represent mean ± SEM; ***P < 0.001; **P < 0.01; *P < 0.05 (unpaired two-tailed t test).

Similar articles

Cited by

References

    1. Aguilera A, García-Muse T. Causes of genome instability. Annu Rev Genet. 2013;47:1–32. - PubMed
    1. Kim N, Jinks-Robertson S. Transcription as a source of genome instability. Nat Rev Genet. 2012;13(3):204–214. - PMC - PubMed
    1. Alt FW, Zhang Y, Meng FL, Guo C, Schwer B. Mechanisms of programmed DNA lesions and genomic instability in the immune system. Cell. 2013;152(3):417–429. - PMC - PubMed
    1. Wei PC, et al. Long neural genes harbor recurrent DNA break clusters in neural stem/progenitor cells. Cell. doi: 10.1016/j.cell.2015.12.039. - DOI - PMC - PubMed
    1. Ju BG, et al. A topoisomerase IIbeta-mediated dsDNA break required for regulated transcription. Science. 2006;312(5781):1798–1802. - PubMed

Publication types

MeSH terms