

Alpha- and Gammaproteobacterial Methanotrophs Codominate the Active Methane-Oxidizing Communities in an Acidic Boreal Peat Bog
- PMID: 26873322
- PMCID: PMC4959502
- DOI: 10.1128/AEM.03640-15
Alpha- and Gammaproteobacterial Methanotrophs Codominate the Active Methane-Oxidizing Communities in an Acidic Boreal Peat Bog
Abstract
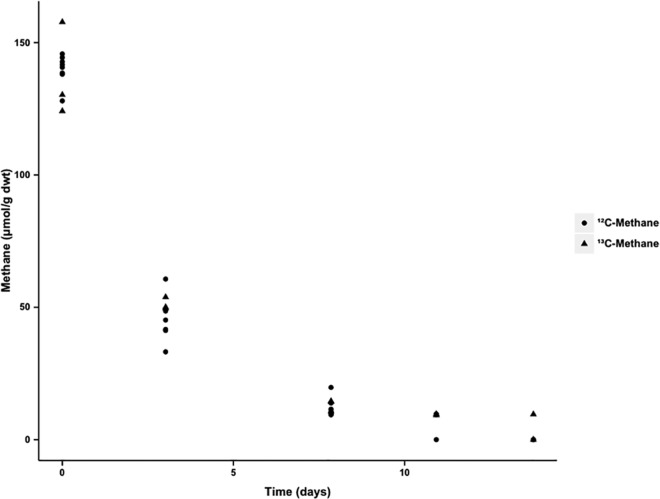
The objective of this study was to characterize metabolically active, aerobic methanotrophs in an ombrotrophic peatland in the Marcell Experimental Forest, in Minnesota. Methanotrophs were investigated in the field and in laboratory incubations using DNA-stable isotope probing (SIP), expression studies on particulate methane monooxygenase (pmoA) genes, and amplicon sequencing of 16S rRNA genes. Potential rates of oxidation ranged from 14 to 17 μmol of CH4g dry weight soil(-1)day(-1) Within DNA-SIP incubations, the relative abundance of methanotrophs increased from 4% in situ to 25 to 36% after 8 to 14 days. Phylogenetic analysis of the(13)C-enriched DNA fractions revealed that the active methanotrophs were dominated by the genera Methylocystis(type II;Alphaproteobacteria),Methylomonas, and Methylovulum(both, type I;Gammaproteobacteria). In field samples, a transcript-to-gene ratio of 1 to 2 was observed for pmoA in surface peat layers, which attenuated rapidly with depth, indicating that the highest methane consumption was associated with a depth of 0 to 10 cm. Metagenomes and sequencing of cDNA pmoA amplicons from field samples confirmed that the dominant active methanotrophs were Methylocystis and Methylomonas Although type II methanotrophs have long been shown to mediate methane consumption in peatlands, our results indicate that members of the genera Methylomonas and Methylovulum(type I) can significantly contribute to aerobic methane oxidation in these ecosystems.
Copyright © 2016, American Society for Microbiology. All Rights Reserved.
Figures


Similar articles
-
Active methanotrophs in two contrasting North American peatland ecosystems revealed using DNA-SIP.Microb Ecol. 2012 Feb;63(2):438-45. doi: 10.1007/s00248-011-9902-z. Epub 2011 Jul 5. Microb Ecol. 2012. PMID: 21728037
-
Microbial Community Composition and Methanotroph Diversity of a Subarctic Wetland in Russia.Mikrobiologiia. 2016 Sep;85(5):545-554. Mikrobiologiia. 2016. PMID: 29364602
-
[Abundance and diversity of methanotrophic Gammaproteobacteria in northern wetlands].Mikrobiologiia. 2014 Mar-Apr;83(2):204-14. Mikrobiologiia. 2014. PMID: 25423724 Russian.
-
Molecular ecology techniques for the study of aerobic methanotrophs.Appl Environ Microbiol. 2008 Mar;74(5):1305-15. doi: 10.1128/AEM.02233-07. Epub 2007 Dec 28. Appl Environ Microbiol. 2008. PMID: 18165358 Free PMC article. Review. No abstract available.
-
Facultative methanotrophs - diversity, genetics, molecular ecology and biotechnological potential: a mini-review.Microbiology (Reading). 2020 Oct;166(10):894-908. doi: 10.1099/mic.0.000977. Microbiology (Reading). 2020. PMID: 33085587 Free PMC article. Review.
Cited by
-
Methane Monooxygenase Gene Transcripts as Quantitative Biomarkers of Methanotrophic Activity in Methylosinus trichosporium OB3b.Appl Environ Microbiol. 2020 Nov 10;86(23):e01048-20. doi: 10.1128/AEM.01048-20. Print 2020 Nov 10. Appl Environ Microbiol. 2020. PMID: 32948519 Free PMC article.
-
A Novel Laboratory-Scale Mesocosm Setup to Study Methane Emission Mitigation by Sphagnum Mosses and Associated Methanotrophs.Front Microbiol. 2021 Apr 26;12:652486. doi: 10.3389/fmicb.2021.651103. eCollection 2021. Front Microbiol. 2021. PMID: 33981290 Free PMC article.
-
RNA Biomarker Trends across Type I and Type II Aerobic Methanotrophs in Response to Methane Oxidation Rates and Transcriptome Response to Short-Term Methane and Oxygen Limitation in Methylomicrobium album BG8.Microbiol Spectr. 2022 Jun 29;10(3):e0000322. doi: 10.1128/spectrum.00003-22. Epub 2022 Jun 9. Microbiol Spectr. 2022. PMID: 35678574 Free PMC article.
-
Diversity and Interactomics of Bacterial Communities Associated with Dominant Trees During Tropical Forest Recovery.Curr Microbiol. 2021 Sep;78(9):3417-3429. doi: 10.1007/s00284-021-02603-9. Epub 2021 Jul 10. Curr Microbiol. 2021. PMID: 34244846
-
Candidatus Methylumidiphilus Drives Peaks in Methanotrophic Relative Abundance in Stratified Lakes and Ponds Across Northern Landscapes.Front Microbiol. 2021 Aug 12;12:669937. doi: 10.3389/fmicb.2021.669937. eCollection 2021. Front Microbiol. 2021. PMID: 34456882 Free PMC article.
References
-
- Intergovernmental Panel on Climate Change. 2015. Climate change 2014: synthesis, report. Contribution of working groups I, II and III to the Fifth Assessment Report of the Intergovernmental Panel on Climate Change. IPCC, Geneva, Switzerland.
-
- Bodelier PLE, Steenbergh AK. 2014. Interactions between methane and the nitrogen cycle in light of climate change. Curr Opin Environ Sustain 9-10:26–36.
-
- Chanton JP, Chasar LC, Glaser P, Siegel D. 2005. Carbon and hydrogen isotopic effects in microbial methane from terrestrial environments, p 85–105. In Flanagan LB, Ehleringer JR, Pataki DE (ed), Stable isotopes and biosphere-atmosphere interactions: processes and biological controls. Elsevier Academic Press, San Diego, CA.
Publication types
MeSH terms
Substances
LinkOut - more resources
Full Text Sources
Other Literature Sources
Miscellaneous
