. 2016 Jun 15;32(12):1840-7.
doi: 10.1093/bioinformatics/btw076. Epub 2016 Feb 11.

SplAdder: identification, quantification and testing of alternative splicing events from RNA-Seq data

Affiliations

SplAdder: identification, quantification and testing of alternative splicing events from RNA-Seq data

André Kahles et al. Bioinformatics. .

Abstract

Motivation: Understanding the occurrence and regulation of alternative splicing (AS) is a key task towards explaining the regulatory processes that shape the complex transcriptomes of higher eukaryotes. With the advent of high-throughput sequencing of RNA (RNA-Seq), the diversity of AS transcripts could be measured at an unprecedented depth. Although the catalog of known AS events has grown ever since, novel transcripts are commonly observed when working with less well annotated organisms, in the context of disease, or within large populations. Whereas an identification of complete transcripts is technically challenging and computationally expensive, focusing on single splicing events as a proxy for transcriptome characteristics is fruitful and sufficient for a wide range of analyses.

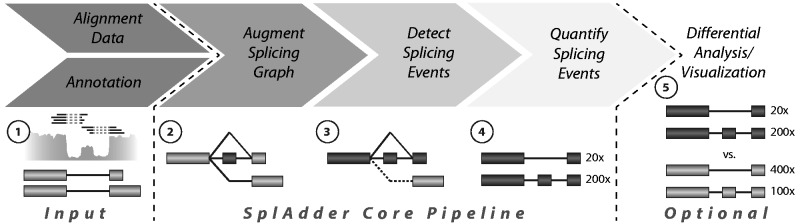
Results: We present SplAdder, an alternative splicing toolbox, that takes RNA-Seq alignments and an annotation file as input to (i) augment the annotation based on RNA-Seq evidence, (ii) identify alternative splicing events present in the augmented annotation graph, (iii) quantify and confirm these events based on the RNA-Seq data and (iv) test for significant quantitative differences between samples. Thereby, our main focus lies on performance, accuracy and usability.

Availability: Source code and documentation are available for download at http://github.com/ratschlab/spladder Example data, introductory information and a small tutorial are accessible via http://bioweb.me/spladder

Contacts: : andre.kahles@ratschlab.org or gunnar.ratsch@ratschlab.org

Supplementary information: Supplementary data are available at Bioinformatics online.


Figures

Fig. 1.
Fig. 1.
SplAdder analysis flowchart. The main steps of the SplAdder workflow consist of (1) integrating annotation information and RNA-Seq data, (2) generating an augmented splicing graph from the integrated data, (3) extraction of splicing events from that graph, (4) quantifying the extracted events and optionally (5) the differential analysis between samples and producing visualizations
Fig. 2.
Fig. 2.
SplAdder evaluation results. This matrix of bar charts summarizes the evaluation results for the comparison of rMATS, SpliceGrapher, JuncBase and SplAdder (see legend) on different sets of simulated RNA-Seq read data. The metric shown here is the F-Score, defined as the harmonic mean of precision and recall. (Plots of the same design with details on precision and recall are provided in Supplemental Figs S6 and S7.) The rows of the plot matrix represent four different event types: (a) exon skip, (b) intron retention, (c) alternative 3′ splice site and (d) alternative 5′ splice site. The columns represent different read set sizes (5 million, 10 million, 20 million). The four bar groups represent the different aligners used (from left to right: STAR 1-pass, STAR 2-pass, TopHat2 and the simulated ground truth alignment) (Color version of this figure is available at Bioinformatics online.)
Fig. 3.
Fig. 3.
Differential testing evaluation. Testing accuracy for four different methods (SplAdder + GLM, SplAdder + rDiff, rMATS and JuncBase; see legend). Each plot represents a different test set. The plot shown on the left represents the sample dataset with large biological variance between replicates, whereas the plot on the right is based on the sample set with small biological variance between replicates. The dashed line represents the diagonal and reflects the performance of a random assignment of classes (Color version of this figure is available at Bioinformatics online.)

References

    1. Behr J. et al. (2013) MITIE: Simultaneous RNA-Seq-based transcript identification and quantification in multiple samples. Bioinformatics, 29, 2529–2538. - PMC - PubMed
    1. Brooks A.N. et al. (2011) Conservation of an RNA regulatory map between Drosophila and mammals. Genome Res., 21, 193–202. - PMC - PubMed
    1. Dobin A. et al. (2013) STAR: ultrafast universal RNA-seq aligner. Bioinformatics, 29, 15–21. - PMC - PubMed
    1. Drechsel G. et al. (2013) Nonsense-mediated decay of alternative precursor mRNA splicing variants is a major determinant of the arabidopsis steady state transcriptome. Plant Cell, 25, 3726–3742. - PMC - PubMed
    1. Drewe P. et al. (2013) Accurate detection of differential RNA processing. Nucleic Acids Res., 41, 5189–5198. - PMC - PubMed