

Association of Borderline Pulmonary Hypertension With Mortality and Hospitalization in a Large Patient Cohort: Insights From the Veterans Affairs Clinical Assessment, Reporting, and Tracking Program
- PMID: 26873944
- PMCID: PMC4811678
- DOI: 10.1161/CIRCULATIONAHA.115.020207
Association of Borderline Pulmonary Hypertension With Mortality and Hospitalization in a Large Patient Cohort: Insights From the Veterans Affairs Clinical Assessment, Reporting, and Tracking Program
Abstract
Background: Pulmonary hypertension (PH) is associated with increased morbidity across the cardiopulmonary disease spectrum. Based primarily on expert consensus opinion, PH is defined by a mean pulmonary artery pressure (mPAP) ≥25 mm Hg. Although mPAP levels below this threshold are common among populations at risk for PH, the relevance of mPAP <25 mm Hg to clinical outcome is unknown.
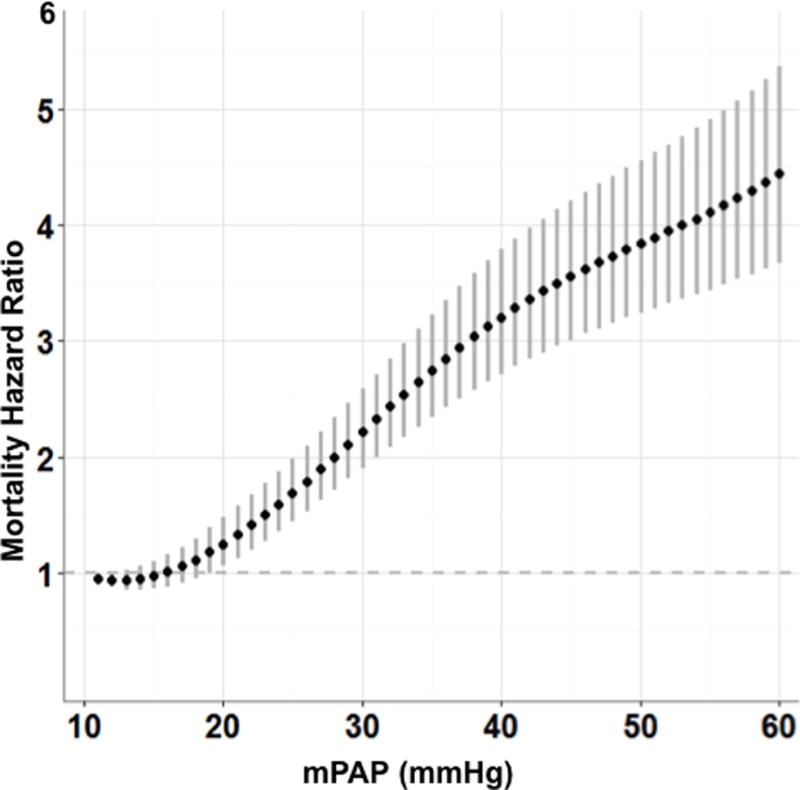
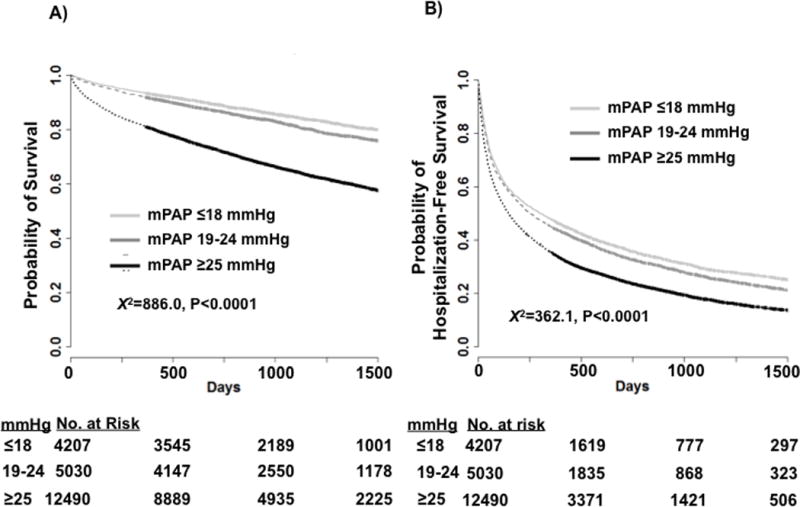
Methods and results: We analyzed retrospectively all US veterans undergoing right heart catheterization (2007-2012) in the Veterans Affairs healthcare system (n=21,727; 908-day median follow-up). Cox proportional hazards models were used to evaluate the association between mPAP and outcomes of all-cause mortality and hospitalization, adjusted for clinical covariates. When treating mPAP as a continuous variable, the mortality hazard increased beginning at 19 mm Hg (hazard ratio [HR]=1.183; 95% confidence interval [CI], 1.004-1.393) relative to 10 mm Hg. Therefore, patients were stratified into 3 groups: (1) referent (≤18 mm Hg; n=4,207); (2) borderline PH (19-24 mm Hg; n=5,030); and (3) PH (≥25 mm Hg; n=12,490). The adjusted mortality hazard was increased for borderline PH (HR=1.23; 95% CI, 1.12-1.36; P<0.0001) and PH (HR=2.16; 95% CI, 1.96-2.38; P<0.0001) compared with the referent group. The adjusted hazard for hospitalization was also increased in borderline PH (HR=1.07; 95% CI, 1.01-1.12; P=0.0149) and PH (HR=1.15; 95% CI, 1.09-1.22; P<0.0001). The borderline PH cohort remained at increased risk for mortality after excluding the following high-risk subgroups: (1) patients with pulmonary artery wedge pressure >15 mm Hg; (2) pulmonary vascular resistance ≥3.0 Wood units; or (3) inpatient status at the time of right heart catheterization.
Conclusions: These data illustrate a continuum of risk according to mPAP level and that borderline PH is associated with increased mortality and hospitalization. Future investigations are needed to test the generalizability of our findings to other populations and study the effect of treatment on outcome in borderline PH.
Keywords: outcome assessment; pulmonary heart disease; pulmonary hypertension.
© 2016 American Heart Association, Inc.
Conflict of interest statement
All other authors report no relevant conflicts of interest. The views expressed are those of the authors alone and do not represent the views of the Veterans Affairs or other Federal government agencies.
Figures
Comment in
-
Hypertension: Definition of pulmonary hypertension challenged?Nat Rev Cardiol. 2016 May;13(5):250-1. doi: 10.1038/nrcardio.2016.44. Epub 2016 Mar 24. Nat Rev Cardiol. 2016. PMID: 27009424 No abstract available.
References
-
- Shah SJ. Pulmonary hypertension. JAMA. 2012;308:1366–74. - PubMed
-
- Rich JD, Rich S. Clinical diagnosis of pulmonary hypertension. Circulation. 2014;130:1820–30. - PubMed
-
- Galiè N, Humbert M, Cahciery J-L, Gibbs S, Lang I, Torbicki A, Simonneau G, Peackock A, Vonk Noordegraf A, Beghetti M, Ghofrani A, Gomez Sanchez MA, Hansmann G, Kleptko W, Lancellotti P, Matucci M, McDonagh T, Pierard LA, Trindade PT, Zompatori M, Hoper M. 2015 ESC/ERS guidelines for the diagnosis and treatment of pulmonary hypertension. The joint task force for the diagnosis and treatment of pulmonary hypertension of the European Society of Cardiology (ESC) and the European Respiratory Society (ERS) Eur Respir J. 2015;46:1855–6. - PubMed
-
- Hatano S, Strasser T. World Health Organization. 1975
-
- Aronson D, Eitan A, Dragu R, Burger AJ. Relationship between pulmonary hypertension and mortality in patients with acute decompensated heart failure. Circ Heart Fail. 2011;4:644–50. - PubMed
Publication types
MeSH terms
Grants and funding
- N01 HV00242/HV/NHLBI NIH HHS/United States
- K08 HL111207/HL/NHLBI NIH HHS/United States
- CDA 08-021/VA/VA/United States
- P01 HL108797/HL/NHLBI NIH HHS/United States
- U01 HL125215/HL/NHLBI NIH HHS/United States
- U01 HL107393/HL/NHLBI NIH HHS/United States
- UO1 HL107393/HL/NHLBI NIH HHS/United States
- 1U01HL125215-01/HL/NHLBI NIH HHS/United States
- I01 BX000711/BX/BLRD VA/United States
- R01 HL139613/HL/NHLBI NIH HHS/United States
- R24 HL123767/HL/NHLBI NIH HHS/United States
- 1K08HL11207-01A1/HL/NHLBI NIH HHS/United States
- I01 BX002042/BX/BLRD VA/United States
LinkOut - more resources
Full Text Sources
Other Literature Sources
Medical
