. 2016 Mar;67(6):1935-50.
doi: 10.1093/jxb/erw016. Epub 2016 Feb 11.

The cotton MYB108 forms a positive feedback regulation loop with CML11 and participates in the defense response against Verticillium dahliae infection

Affiliations

The cotton MYB108 forms a positive feedback regulation loop with CML11 and participates in the defense response against Verticillium dahliae infection

Huan-Qing Cheng et al. J Exp Bot. 2016 Mar.

Abstract

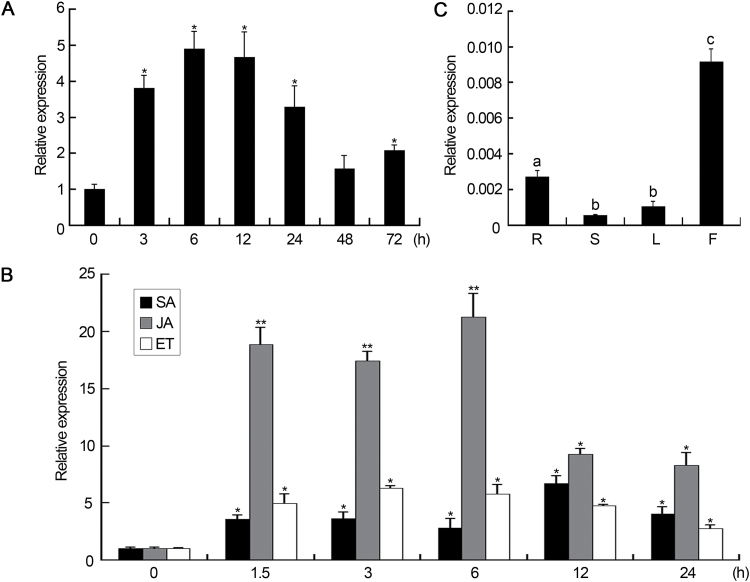
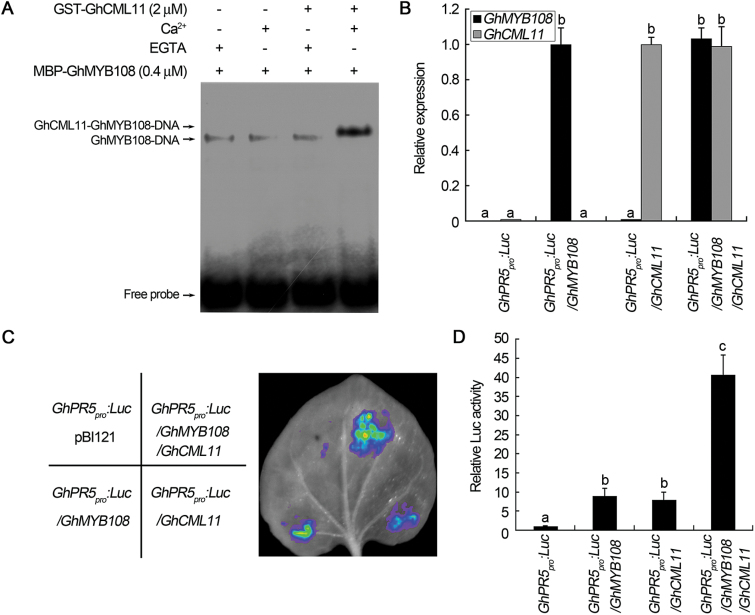
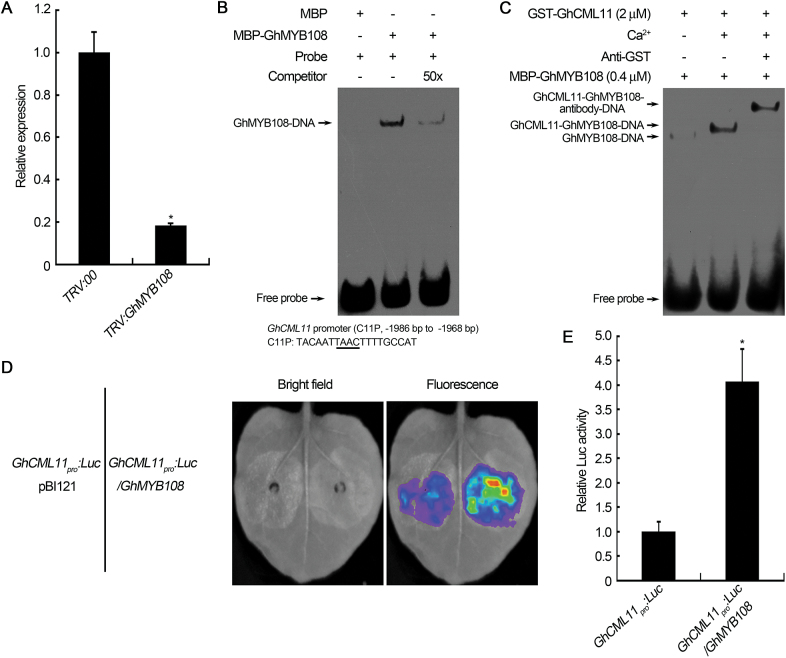
Accumulating evidence indicates that plant MYB transcription factors participate in defense against pathogen attack, but their regulatory targets and related signaling processes remain largely unknown. Here, we identified a defense-related MYB gene (GhMYB108) from upland cotton (Gossypium hirsutum) and characterized its functional mechanism. Expression of GhMYB108 in cotton plants was induced by Verticillium dahliae infection and responded to the application of defense signaling molecules, including salicylic acid, jasmonic acid, and ethylene. Knockdown of GhMYB108 expression led to increased susceptibility of cotton plants to V. dahliae, while ecotopic overexpression of GhMYB108 in Arabidopsis thaliana conferred enhanced tolerance to the pathogen. Further analysis demonstrated that GhMYB108 interacted with the calmodulin-like protein GhCML11, and the two proteins form a positive feedback loop to enhance the transcription of GhCML11 in a calcium-dependent manner. Verticillium dahliae infection stimulated Ca(2+) influx into the cytosol in cotton root cells, but this response was disrupted in both GhCML11-silenced plants and GhMYB108-silenced plants in which expression of several calcium signaling-related genes was down-regulated. Taken together, these results indicate that GhMYB108 acts as a positive regulator in defense against V. dahliae infection by interacting with GhCML11. Furthermore, the data also revealed the important roles and synergetic regulation of MYB transcription factor, Ca(2+), and calmodulin in plant immune responses.

Keywords: Calcium; MYB; Verticillium dahliae.; calmodulin; cotton; plant defense.


Figures

Fig. 1.
Fig. 1.
Expression pattern of the GhMYB108 gene in cotton plants. (A) Accumulation of GhMYB108 transcripts in cotton roots in response to V. dahliae infection. Error bars represent the SD of three biological replicates. Asterisks indicate statistically significant differences, as determined by Student’s t-test (*P<0.05). (B) Expression of GhMYB108 after treatments with salicylic acid, jasmonic acid, and ethylene. Asterisks indicate statistically significant differences, as determined by Student’s t-test (*P<0.05, **P<0.01). (C) qRT-PCR analysis of GhMYB108 expression in root (R), stem (S), leaf (L), and flower (F) of cotton plants. Different letters indicate statistically significant differences at P<0.05 (Student’s t-test, three biological replicates).
Fig. 2.
Fig. 2.
Transcriptional activity of GhMYB108 and subcellular localization of GhMYB108–GFP fusion proteins. (A) EMSA analysis of the binding of GhMYB108 to the MBS cis-elements. GhMYB108 proteins were incubated with biotin-labeled probe (2× TAACGGAC) in the absence or presence of a 20-, 50-, or 100-fold excess of unlabeled competitor. (B) Transcriptional activation activity of GhMYB108 in Arabidopsis protoplasts. The empty vector pRT-BD and pRT-BD-VP16 were used as negative and positive control, respectively. Error bars represent the SD of three biological replicates. Asterisks indicate statistically significant differences, as determined by Student’s t-test (*P<0.05, **P<0.01). (C) Subcellular localization of intact and truncated fusion proteins. GFP, GhMYB108–GFP, GhMYB108ΔC–GFP, and GhMYB108ΔN–GFP fusion proteins were transiently expressed in N. benthamiana leaves. GFP fluorescence was visualized by confocal microscopy. Numbers represent amino acid residues. Scale bars=20 μm. (This figure is available in colour at JXB online.)
Fig. 3.
Fig. 3.
Increased susceptibility of GhMYB108-silenced cotton plants to V. dahliae. (A) Analysis of GhMYB108 expression levels. Total RNAs were extracted from leaves of cotton plants at 14 d post-agroinfiltration, and the expression level of GhMYB108 in VIGS plants was compared with that of the control plant (TRV:00). Asterisks indicate statistically significant differences, as determined by Student’s t-test (**P<0.01). (B) Disease symptoms of control (TRV:00) and GhMYB108-silenced (TRV:GhMYB108) plants infected by V. dahliae. (C) Rate of diseased plants and disease index of the control and GhMYB108-silenced plants. Error bars represent the SD of three biological replicates (n≥30). Asterisks indicate statistically significant differences, as determined by Student’s t-test (*P<0.05). (D) Comparison of a longitudinal section of stem between control and GhMYB108-silenced cotton plants 20 d after V. dahliae infection. Arrows indicate the vascular part of the stem. (E) Fungal recovery assay. The stem sections from cotton plants 20 d after V. dahliae infection were plated on potato dextrose agar medium. Photos were taken at 6 d after plating. The number of stem sections on which the fungus grew showed the extent of fungal colonization. (This figure is available in colour at JXB online.)
Fig. 4.
Fig. 4.
Enhanced disease tolerance of Arabidopsis plants overexpressing GhMYB108. (A) Expression levels of GhMYB108 in WT (wild-type) and transgenic Arabidopsis lines (7-4, 35-3, and 39-2). (B) Symptoms of WT and GhMYB108 transgenic plants inoculated with V. dahliae for 22 d. (C and D) Rate of diseased plants and disease index of WT and transgenic plants. Error bars indicate the SD of three biological replicates with 36 plants per repeat. (E) Quantification of fungal biomass. Real-time PCR analysis was conducted to compare the transcript levels between the ITS gene (as a measure for fungal biomass) of V. dahliae and the Rubisco gene of Arabidopsis (for equilibration) at 22 d post-inoculation. Relative amounts of fungal DNA were set to 100% for the WT. Asterisks indicate statistically significant differences, as determined by Student’s t-test (*P<0.05, **P<0.01). (This figure is available in colour at JXB online.)
Fig. 5.
Fig. 5.
Interaction of GhMYB108 and GhCML11 proteins. (A) Yeast two-hybrid assay to detect interaction between GhMYB108 and GhCML11. The yeast strain containing the indicated plasmids was grown on SD/–Leu/–Trp DO (DDO) plates and SD/–Leu/–Trp/–Ade/–His DO (QDO) plates (containing 5mM 3-AT) for 3 d. Interaction of GhMYB108 with the AD domain in the pGADT7 empty vector was used as a negative control. (B) Pull-down assay. GST–GhCML11 fusion protein was used as bait, and MBP–GhMYB108 fusion protein was used as prey. Alternatively, MBP–GhMYB108 fusion protein was used as bait, and GST–GhCML11 fusion protein was used as prey. The anti-MBP and anti-GST antibodies were used to detect bait and prey proteins. MBP and GST proteins were used as negative controls. (C) LCI analysis of the interaction between GhMYB108 and GhCML11. Agrobacterium strains containing the indicated pairs were co-expressed in N. benthamiana. The luminescent signal was collected at 48h after infiltration. (D) Quantification of relevant Luc activities in (C). Error bars represent the SD of three biological replicates. Asterisks indicate statistically significant differences, as determined by Student’s t-test (**P<0.01). (This figure is available in colour at JXB online.)
Fig. 6.
Fig. 6.
Subcellular localization of GhCML11 proteins. (A) Co-localization of GhMYB108 and GhCML11 in the nucleus. Agrobacterium strains containing the indicated pair of GhMYB108-GFP and GhCML11-mCherry were co-expressed in N. benthamiana. The signal was visualized with confocal microscopy. Scale bars=20 μm. (B) Localization of GhCML11 transiently expressed in onion epidermal cells. The two left-hand panels show the cells containing the empty vector before and after plasmolysis. The two right-hand panels show the cells harboring the GhCML11–GFP construct before and after plasmolysis. Arrows indicate the cell wall region after plasmolysis. Scale bars=20 μm. (This figure is available in colour at JXB online.)
Fig. 7.
Fig. 7.
GhCML11 promotes transcriptional activity of GhMYB108. (A) Effect of GhCML11 on the DNA binding activity of GhMYB108. (B) qRT-PCR analysis of GhMYB108 and GhCML11 expression in the infiltrated N. benthamiana leaves transformed with the indicated constructs in (C). Different letters indicate statistically significant differences at P<0.01 (Student’s t-test, n≥15, three biological repeats). (C) Effect of GhCML11 on the transcription factor activity of GhMYB108. Luminescence imaging was performed 48h after co-infiltration. (D) Quantitative analysis of luminescence intensity in (C). Different letters indicate statistically significant differences at P<0.05 (Student’s t-test, n=30, three biological repeats).
Fig. 8.
Fig. 8.
GhMYB108 regulates the transcription of GhCML11. (A) Expression analysis of GhCML11 in control (TRV:00) and GhMYB108-silenced (TRV:GhMYB108) plants. Asterisks indicate statistically significant differences, as determined by Student’s t-test (*P<0.05). (B) EMSA of the binding of GhMYB108 to the promoter of GhCML11. The underlined sequence indicates the core motif of the MYB-binding site. (C) Analysis of the effect of GhCML11 proteins on the binding activity of GhMYB108 to the GhCML11 promoter. Anti-GST antibody against GST-tagged GhCML11 was added in the reaction to detect the presence of GhCML11 in the GhMYB108–DNA complexes. (D) Activation of GhCML11 transcription by GhMYB108. Luminescence imaging was performed 48h after co-infiltration of N. benthamiana leaves with equal amounts of Agrobacterium cells containing the indicated constructs on the left panel. (E) Quantitative analysis of luminescence intensity in (D). Error bars represent the SD (n=30) of three biological replicates. Asterisks indicate statistically significant differences, as determined by Student’s t-test (*P<0.05). (This figure is available in colour at JXB online.)
Fig. 9.
Fig. 9.
Ca2+ levels in cytosol of root cells in control, GhMYB108-silenced, and GhCML11-silenced cotton plants. (A) Change in fluorescent intensity of control, GhMYB108-, and GhCML11-silenced cotton root cells treated with Fluo-4/AM at the indicated time points after inoculation with V. dahliae. Error bars represent the SD (n≥10) of three biological replicates. Asterisks indicate statistically significant differences, as determined by Student’s t-test (*P<0.05). (B) Fluorescence images of cotton root cells at 0, 4, and 60min post-inoculation with V. dahliae. The fluorescence signals were visualized by confocal microscopy. Scale bars=20 μm.
Fig. 10.
Fig. 10.
Transcript profiling analysis of differentially expressed genes in the GhMYB108-silenced cotton plants. (A) Functional classification of genes up- or down-regulated in GhMYB108-silenced cotton plants. The percentage of each category of up-regulated or down-regulated genes indicates the number of genes in that category relative to the 181 annotated up-regulated or 210 annotated down-regulated genes. (B) The expression levels of calcium signaling genes between control (TRV:00) and GhMYB108-silenced (TRV:GhMYB108) plants. These genes included Ca2+-binding protein genes GhEHD2 (EPS15 homology domain protein), GhPBP1 (PINOID-binding protein), GhNRT1.2 (Nitrate transporter1.2), GhRBOHF (Respiratory burst oxidase homolog protein), calmodulin-binding protein genes GhIQD1, GhIQD14, and GhIQD31 (IQ-domain protein), and the CBL-binding protein gene GhCIPK6. Error bars represent the SD of three biological replicates. Asterisks indicate statistically significant differences, as determined by Student’s t-test (*P<0.05).

References

    1. Bolek Y, El-Zik KM, Pepper AE, Bell AA, Magill CW, Thaxton PM, Reddy OUK. 2005. Mapping of verticillium wilt resistance genes in cotton. Plant Science 168, 1581–1590.
    1. Bouché N, Yellin A, Snedden WA, Fromm H. 2005. Plant-specific calmodulin-binding proteins. Annual Review of Plant Biology 56, 435–466. - PubMed
    1. Buscaill P, Rivas S. 2014. Transcriptional control of plant defence responses. Current Opinion in Plant Biology 20, 35–46. - PubMed
    1. Cai Y, He X, Mo J, Sun Q, Yang J, Liu J. 2009. Molecular research and genetic engineering of resistance to Verticillium wilt in cotton. African Journal of Biotechnology 8, 7363–7372.
    1. Chen H, Zou Y, Shang Y, Lin H, Wang Y, Cai R, Tang X, Zhou JM. 2008. Firefly luciferase complementation imaging assay for protein–protein interactions in plants. Plant Physiology 146, 368–376. - PMC - PubMed

Publication types

MeSH terms