. 2016 Mar 15;196(6):2847-59.
doi: 10.4049/jimmunol.1502364. Epub 2016 Feb 12.

Expression Profiling of Macrophages Reveals Multiple Populations with Distinct Biological Roles in an Immunocompetent Orthotopic Model of Lung Cancer

Affiliations

Expression Profiling of Macrophages Reveals Multiple Populations with Distinct Biological Roles in an Immunocompetent Orthotopic Model of Lung Cancer

Joanna M Poczobutt et al. J Immunol. .

Abstract

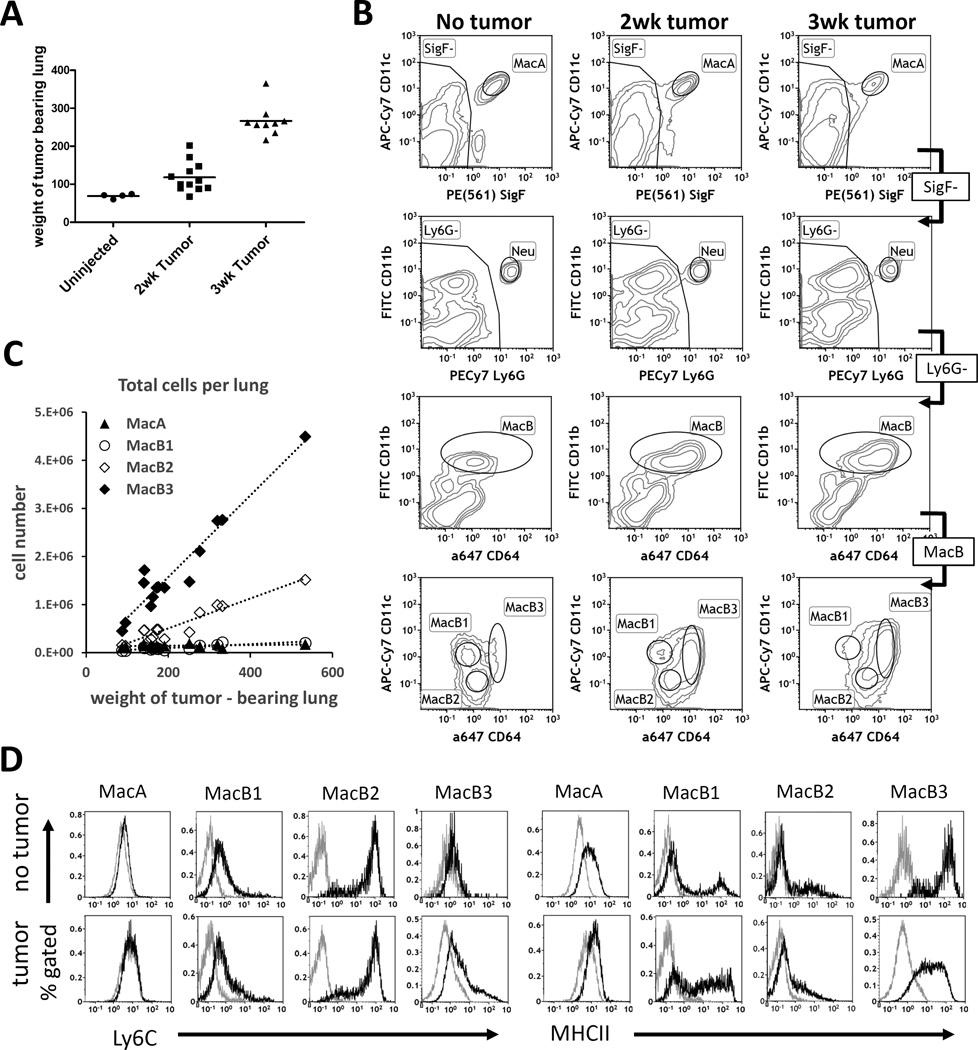
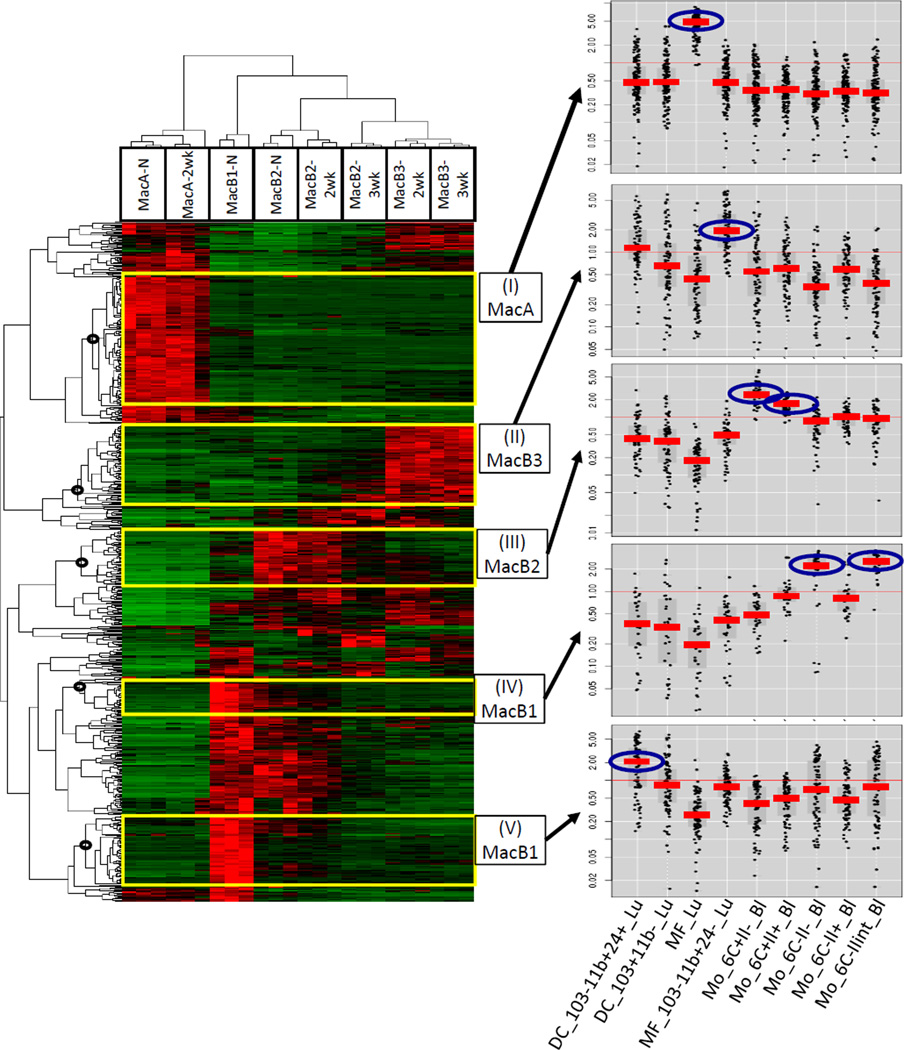
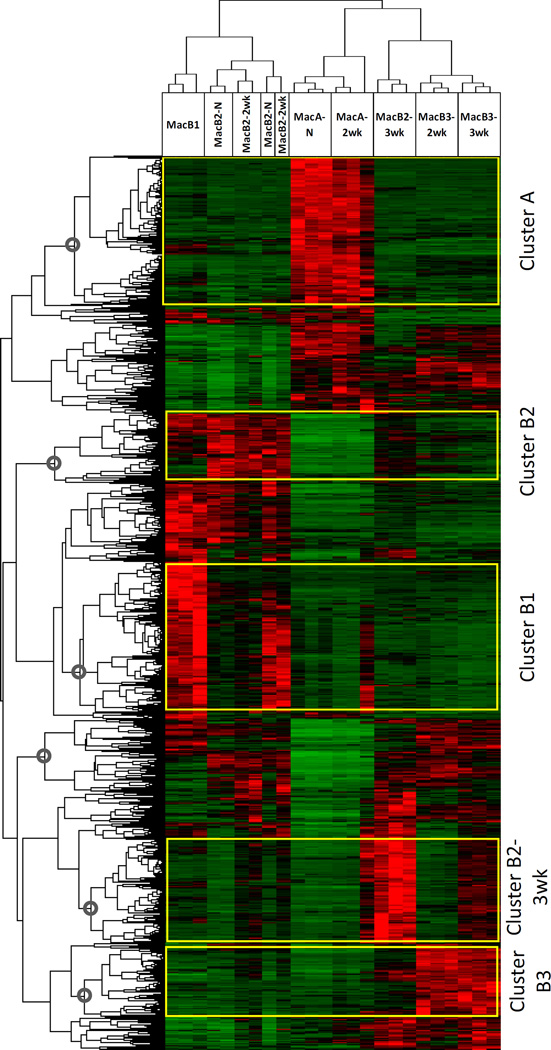
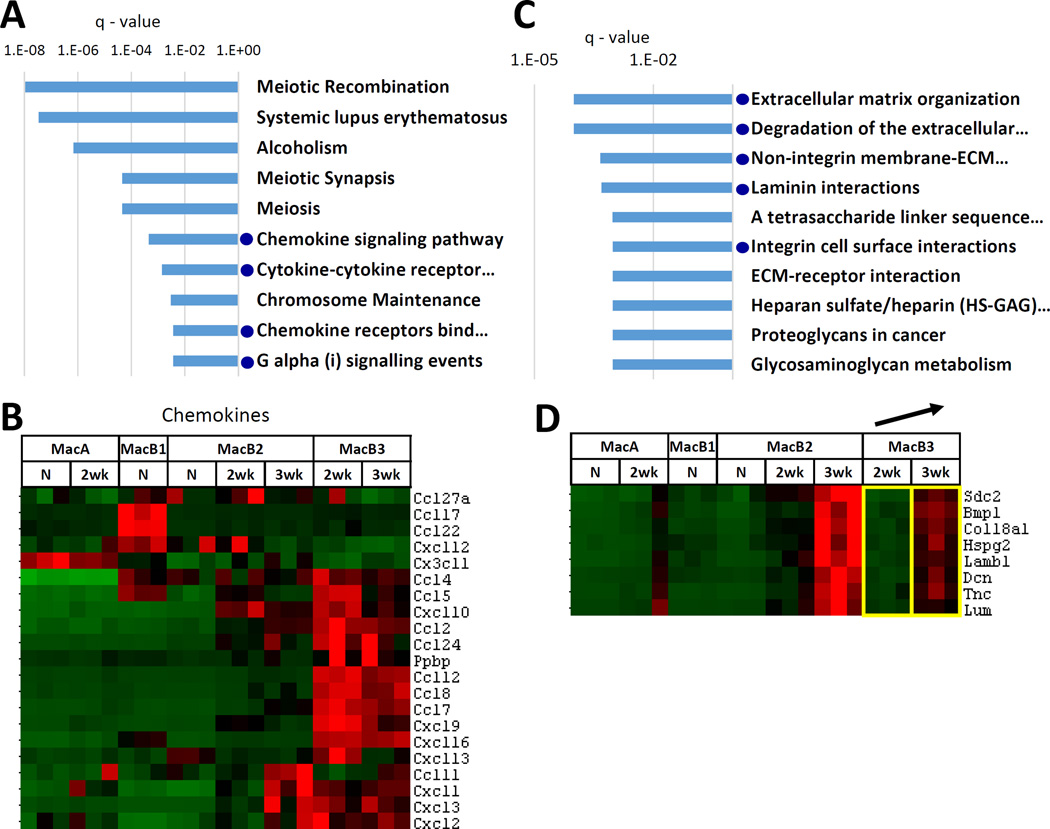
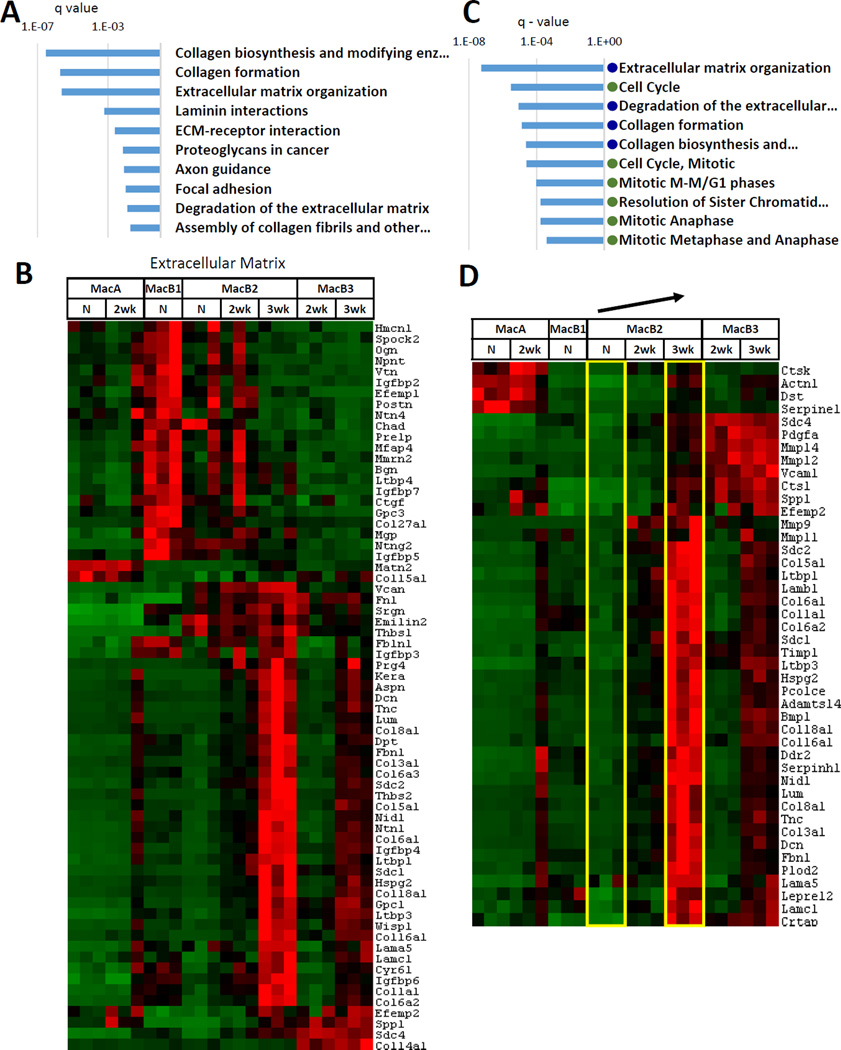
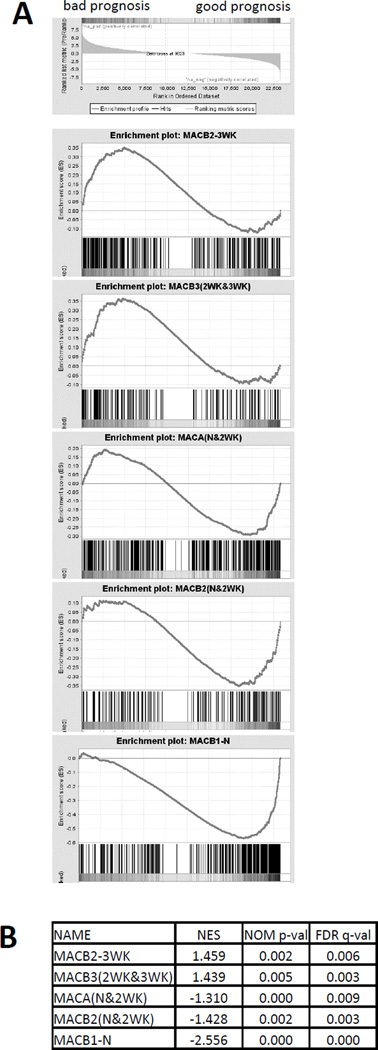
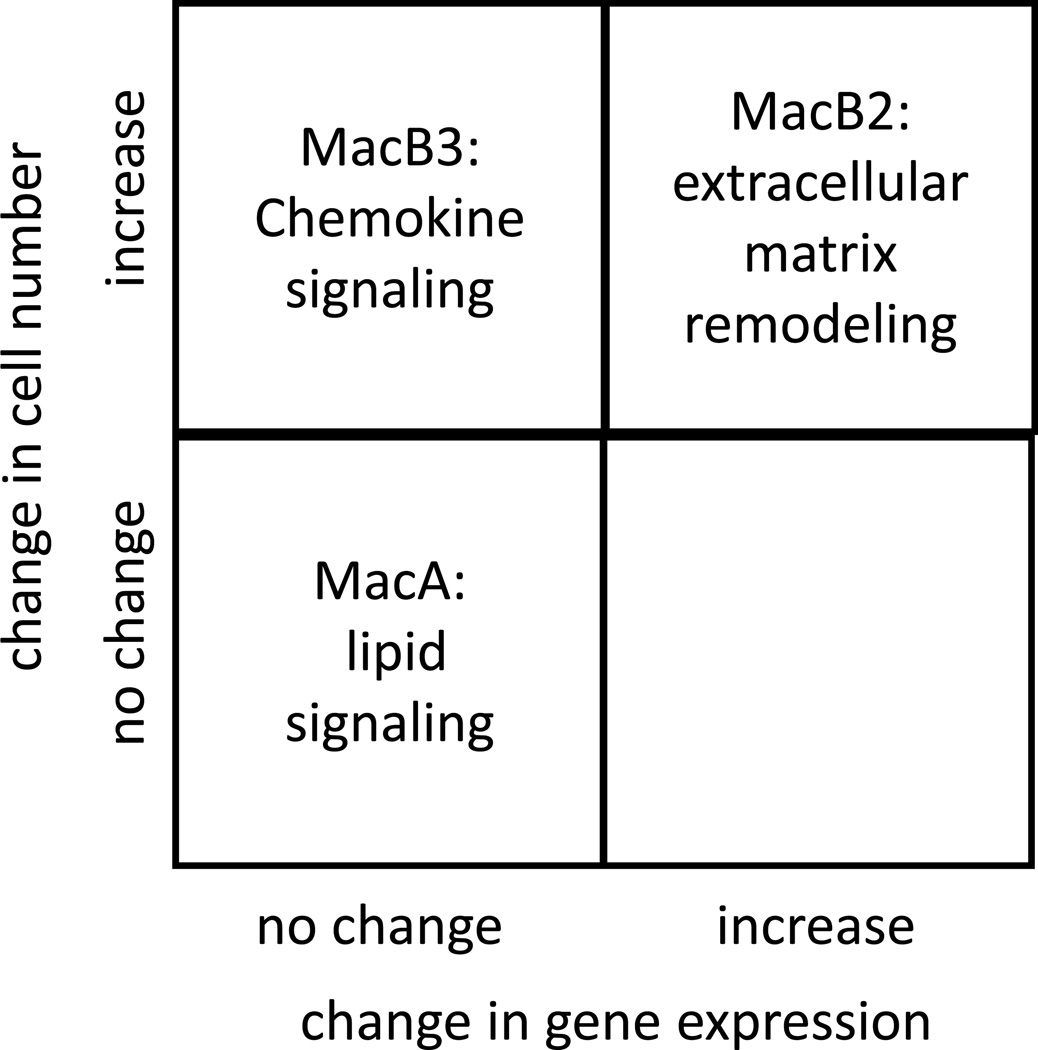
Macrophages represent an important component of the tumor microenvironment and play a complex role in cancer progression. These cells are characterized by a high degree of plasticity, and they alter their phenotype in response to local environmental cues. Whereas the M1/M2 classification of macrophages has been widely used, the complexity of macrophage phenotypes has not been well studied, particularly in lung cancer. In this study we employed an orthotopic immunocompetent model of lung adenocarcinoma in which murine lung cancer cells are directly implanted into the left lobe of syngeneic mice. Using multimarker flow cytometry, we defined and recovered several distinct populations of monocytes/macrophages from tumors at different stages of progression. We used RNA-seq transcriptional profiling to define distinct features of each population and determine how they change during tumor progression. We defined an alveolar resident macrophage population that does not change in number and expresses multiple genes related to lipid metabolism and lipid signaling. We also defined a population of tumor-associated macrophages that increase dramatically with tumor and selectively expresses a panel of chemokine genes. A third population, which resembles tumor-associated monocytes, expresses a large number of genes involved in matrix remodeling. By correlating transcriptional profiles with clinically prognostic genes, we show that specific monocyte/macrophage populations are enriched in genes that predict outcomes in lung adenocarcinoma, implicating these subpopulations as critical determinants of patient survival. Our data underscore the complexity of monocytes/macrophages in the tumor microenvironment, and they suggest that distinct populations play specific roles in tumor progression.


Figures

Fig. 1
Fig. 1. Identification of myeloid cell populations in lung during tumor growth
Lewis lung carcinoma cells were injected directly into the lungs of syngeneic C57BL/6 mice, and tumor-bearing left lobes were harvested 2 or 3 weeks after injection, along with lungs from uninjected mice. For each time point, the injection and harvest was repeated 3 times independently, with 3-5 mice pooled each time. (A). Tumor growth: weights of uninjected and tumor-bearing left lung lobes. Uninjected n=12 mice total (weight measurements not taken for all mice), 2wk tumor n= 12 mice, 3wk tumor n=9 mice. (B) Gating strategy to identify MacA, MacB1, MacB2, and MacB3 cells. Representative plots for No-tumor control, 2-week tumor, and 3-week tumor bearing mice. (C) Total absolute numbers of MacA and MacB populations in tumor – bearing left lung lobes quantified in separate experiments. (D) Characterization of Ly6C and MHCII expression in MacA and MacB populations.
Fig. 2
Fig. 2. Comparison of transcriptional profiles of MacA and MacB populations to immune cells from naïve mouse published by the Immgen Project Consortium
MacA and MacB populations were recovered from 3 independently injected and harvested pools of tumor bearing and control mice by flow-cytometry-based sorting. Sufficient cell numbers were obtained for: naive mice: MacA (MacA-N), MacB1 (MacB1-N), MacB2 (MacB2-N); 2 week tumor bearing mice: MacA (MacA-2wk), MacB2 (MacB2-2wk), MacB3 (MacB3-3wk); 3-week tumor bearing mice: MacB2 (MacB2-3wk), MacB3 (MacB3-3wk). RNA was extracted from these populations, transcriptional profiles were assessed by RNA-seq, We constructed a list of 645 genes that were differentially expressed among the following cell types profiled by the Immgen Project: lung alveolar macrophages, lung CD11b+ macrophages, blood monocytes classical (Ly6C+MHCII+, Ly6C+/MHCII−), blood monocytes nonclassical (Ly6C−/MHCII+, Ly6C−/MHCII−, Ly6C−/MHCII int), lung dendritic cells (CD11b+ and CD11b-). The expression of these 645 genes among the MacA and MacB cells was examined by hierarchical clustering and is shown as a heatmap. Clusters of genes highly expressed selectively in one cell type were outlined based on the nodes in the dendrogram (black circles): (I) MacA – cluster expressed in MacA-N and −2wk; (II) MacB3 - cluster expressed in MacB3-2wk and −3wk; (III) MacB2 – cluster expressed in MacB2-N, −2wk, and −3wk; (IV) and (V) 2 separate clusters expressed in MacB1-N. The genes in the clusters were mapped back to the reference Immgen populations using the Immgen website tool “my gene set” (panels on the right). The Immgen population(s) with highest expression is circled in blue. DC_103-11b+24+_Lu: CD11b+ lung dendritic cell; DC_103+11b-_Lu: CD11b- lung dendritic cell; MF_Lu: lung alveolar macrophage; MF_103-11b+24-_Lu: lung CD11b+ macrophage; Mo_6C+II−_Bl: blood monocyte, classical Ly6C+/MHCII−; Mo_6C+II+_Bl: blood monocyte classical Ly6C+/MHCII+; Mo_6C−/II−_Bl : blood monocyte nonclassical Ly6C−/MHCII−; Mo_6C−/II+_Bl : blood monocyte nonclassical Ly6C−/MHCII+; Mo_6C−/IIint_Bl : blood monocyte nonclassical Ly6C−/MHCII intermediate.
Fig. 3
Fig. 3. Global analysis of genes differentially expressed between MacA and MacB populations
Differentially expressed genes were identified in all pairwise comparisons between the recovered populations from our RNA-seq analysis (2458 genes) Hierarchical clustering was performed on the set of 2458 genes and clusters with high expression in specific populations were identified: Cluster A – genes highly and selectively expressed in MacA-N and MacA-2wk; Cluster B2 –highly expressed in MacB2-N and MacB2-2wk; Cluster B1 –highly expressed in MacB1-N; Cluster B2-3wk –highly expressed in MacB2-3wk; Cluster B3 –highly expressed in MacB3-2wk and MacB3-3wk.
Fig. 4
Fig. 4. Analysis of MacA cells
(A) Top 10 KEGG/Rectome database pathways overrepresented in gene Cluster A (genes highly expressed in MacA-N and MacA-2wk cells). Blue dots indicate pathways related to lipid metabolism. (B) Levels of differentially expressed genes related to lipid metabolism. Gene list was based on consensus between the top ranking lipid metabolism pathways. (C) Levels of differentially expressed genes related to PPAR signaling. Gene list was based on the KEGG set “PPAR signaling pathway”. (D) Levels of differentially expressed genes in the eicosanoid pathway. The key leukotriene pathway enzymes (Alox5, Ltc4s) and prostaglandin pathway enzymes (Ptgs1, Ptgs2) are indicated. (E) Levels of mRNA of Alox5, Ltc4s, Ptgs1, Ptgs2. The cells were recovered form a separate group of mice, in which the MacB subpopulations were pooled, and mRNA was extracted and quantified by RT-qPCR. Levels were normalized to reference genes (geometric average of beta-actin, Gapdh, 18s and UbqC). (F) Production of LTC4 and PGE2 by MacA and MacB cells recovered by flow cytometry and stimulated in vitro with calcium ionophore (G). Genes upregulated in MacA-2wk compared to MacA-N. The arrow indicates the 2 populations being compared. Shown are only genes that met the differential expression criteria in this comparison, and whose average expression in MacA was higher than in the MacB populations.
Fig. 5
Fig. 5. Analysis of MacB3 cells
(A) Top 10 KEGG/Reactome pathways overrepresented in gene Cluster B3 (genes highly expressed in MacB3-2wk and MacB3-3wk cells). Blue dots indicate pathways related to chemokine signaling. (B) Levels of differentially expressed chemokine genes in MacA and MacB populations. (C) Analysis of genes upregulated in MacB3 cells with tumor progression – comparing MacB3-3wk to MacB3-2wk. Top 10 KEGG/Reactome pathways overrepresented among the 35 upregulated genes. Blue dots indicate extracellular matrix related pathways. (D) Specific genes that were upregulated in MacB3-3wk compared to MacB3-2wk and that belonged to the extracellular matrix – related pathways. The yellow boxes indicate the 2 populations being compared.
Fig. 6
Fig. 6. Analysis of MacB2-3wk
(A) Top 10 KEGG/Reactome pathways overrepresented in gene Cluster B2-3wk (genes highly expressed in MacB2-3wk cells). (B) Levels of differentially expressed extracellular matrix genes. (C) Analysis of genes upregulated in MacB2 cells with tumor progression. Comparison of MacB2-3wk to MacB2-N. Top 10 KEGG/Reactome pathways overrepresented among the 472 upregulated genes. Blue dot indicates extracellular matrix related pathways. Green dot indicates pathways related to cell cycle. (D) Specific genes that were upregulated in MacB2-3wk compared to MacB2-N and that belonged to the extracellular matrix – related pathways. The arrow indicates the 2 populations being compared.
Fig. 7
Fig. 7. Correlation of MacA and MacB transcriptional profiles to prognostic genes in human lung adenocarcinoma
A) Gene Set Enrichment Analysis (GSEA) plots - ~23,000 human genes were ranked according to their survival scores in lung adenocarcinoma as listed in the PRECOG database, and the GSEA pre-ranked analysis tool was used to examine enrichment in good or bad prognosis genes in the gene clusters highly expressed in MacA or MacB cells as defined in Fig. 3. (B) GSEA enrichment scores: NES – normalized enrichment score, NOM p-val – nominal p-value, FDR q-val – false discovery rate
Fig. 8
Fig. 8. Overview of the changes in cell number and gene expression of key monocyte and macrophage populations identified in the lung tumor microenvironment

References

    1. Jemal A, Siegel R, Ward E, Hao Y, Xu J, Murray T, Thun MJ. Cancer statistics, 2008. CA Cancer J Clin. 2008;58:71–96. - PubMed
    1. Kenny PA, Lee GY, Bissell MJ. Targeting the tumor microenvironment. Front Biosci. 2007;12:3468–3474. - PMC - PubMed
    1. Noy R, Pollard JW. Tumor-associated macrophages: from mechanisms to therapy. Immunity. 2014;41:49–61. - PMC - PubMed
    1. Zaynagetdinov R, Sherrill TP, Polosukhin VV, Han W, Ausborn JA, McLoed AG, McMahon FB, Gleaves LA, Degryse AL, Stathopoulos GT, Yull FE, Blackwell TS. A critical role for macrophages in promotion of urethane-induced lung carcinogenesis. J Immunol. 2011;187:5703–5711. - PMC - PubMed
    1. Sharma SK, Chintala NK, Vadrevu SK, Patel J, Karbowniczek M, Markiewski MM. Pulmonary alveolar macrophages contribute to the premetastatic niche by suppressing antitumor T cell responses in the lungs. J Immunol. 2015;194:5529–5538. - PubMed

Publication types

MeSH terms