. 2016 Apr:85:180-194.
doi: 10.1016/j.biomaterials.2016.01.066. Epub 2016 Feb 3.

Transdifferentiation of human endothelial progenitors into smooth muscle cells

Affiliations

Transdifferentiation of human endothelial progenitors into smooth muscle cells

HaYeun Ji et al. Biomaterials. 2016 Apr.

Abstract

Access to smooth muscle cells (SMC) would create opportunities for tissue engineering, drug testing, and disease modeling. Herein we report the direct conversion of human endothelial progenitor cells (EPC) to induced smooth muscle cells (iSMC) by induced expression of MYOCD. The EPC undergo a cytoskeletal rearrangement resembling that of mesenchymal cells within 3 days post initiation of MYOCD expression. By day 7, the reprogrammed cells show upregulation of smooth muscle markers ACTA2, MYH11, and TAGLN by qRT-PCR and ACTA2 and MYH11 expression by immunofluorescence. By two weeks, they resemble umbilical artery SMC in microarray gene expression analysis. The iSMC, in contrast to EPC control, show calcium transients in response to phenylephrine stimulation and a contractility an order of magnitude higher than that of EPC as determined by traction force microscopy. Tissue-engineered blood vessels constructed using iSMC show functionality with respect to flow- and drug-mediated vasodilation and vasoconstriction.

Keywords: Direct reprogramming; Direct transdifferentiation; Myocardin; Smooth muscle cell differentiation; Tissue-engineered blood vessel.


Figures

Figure 1
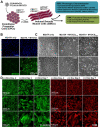
Figure 1. Transdifferentiation of endothelial progenitor cells into induced smooth muscle cells through the transient overexpression of MYOCD
(A) Illustration depicting the experimental design of our study. Human endothelial progenitor cells (EPC, CD31high/CD105high) were transduced with lentiviruses allowing the constitutive overexpression of a reverse tetracycline-controlled transactivator (M2rtTA) and inducible overexpression of MYOCD. Induction of MYOCD overexpression via the exposure to doxycycline (DOX) stimulated morphological changes resembling that of the endothelial-to-mesenchymal transition. The reprogrammed cells (iSMC) resembled smooth muscle cells and expressed smooth muscle actin (ACTA2) and smooth muscle myosin heavy chain 11 (MYH11). iSMC were characterized both morphologically and functionally. (B) EPC transduced with the two genes (M2rtTA and MYOCD) expressed and localized MYOCD in their nucleus, following induction of expression via doxycycline exposure as determined by immunofluorescence (right images). MYOCD expression levels were determined to be inhomogeneous in the cell population as nuclear protein expression was either high (white arrows), low (red arrows), or absent (yellow arrows). No MYOCD expression was detected in control EPC transduced only with M2rtTA (left images). (C) EPC were first transduced with an M2rtTA lentivirus and subsequently with either low or high viral titers of MYOCD lentivirus. Induction of MYOCD overexpression (1 day) provoked a significant amount of cell death which was more evident in cells transduced with high viral titers of MYOCD. Following 7 days of MYOCD overexpression transduced EPC acquired a mesenchymal phenotype and continued to proliferate in the cell population transduced with a low titer of MYOCD lentivirus. Cells transduced with a high lentiviral titer did not recover. Control cells (M2rtTA only) retained an endothelial morphology. (D) Epigenetic reprogramming of EPC into iSMC was associated with significant changes in the cytoskeletal organization of the cells (actin filaments and intermediate filaments) as determined by immunofluorescence. EPC organized actin filaments on their periphery whereas iSMC contained actin filaments which trans versed the entire length of the cell. EPC contained intermediate filaments in the entire cell area apart from the nucleus whereas in iSMC the intermediate filaments covered the entire cell. These changes were detectable as early as three days post induction of MYOCD overexpression and became more pronounced by day seven.
Figure 2
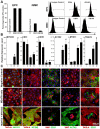
Figure 2. Phenotypic characterization of transdifferentiated iSMC
(A) Epigenetic reprogramming of EPC into iSMC was associated with a significant downregulation of endothelial cell surface markers CD31 and CD105 as determined by flow cytometry. (B) Exposure of transduced EPC to doxycycline induced a robust overexpression of MYOCD as determined by gene expression analysis. Transdifferentiation and iSMC derivation was associated with a significant downregulation of endothelial markers CD31 and CDH5, and a significant upregulation of smooth muscle markers ACTA2, MYH11, and TAGLN. Control EPC (i), M2rtTA (ii), M2rtTA + MYOCDLow (iii), M2rtTA + MYOCDHigh (iv). (C) EPC-to-iSMC transdifferentiation was associated with expression of smooth muscle proteins MYH11, ACTA2, and an upregulation / reorganization of TAGLN as determined by immunofluorescence. Endothelial proteins CD31 and VWF were absent in the transdifferentiated cells. Small foci of VWF+/CD31+ EPC remained in cultures of iSMC which can be attributed to EPC not having be transduced with the MYOCD expressing lentivirus. Expression of CD31 or VWF by MYH11 or ACTA2 expressing iSMC was not detected.
Figure 3
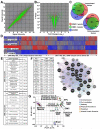
Figure 3. Microarray gene expression analysis performed on four cell populations
(A) Plot of signal intensity ratios for individual chip probe when comparing iSMC (2 weeks post induction of transdifferentiation, red), iSMC (4 weeks post induction of transdifferentiation, green), or control umbilical aorta smooth muscle cells (UASMC, blue) to control EPC. (B) Volcano plot displaying the relationship between the calculated fold change for individual chip probes versus the P-value as calculated using ANOVA statistical analysis (when comparing iSMC 2 weeks, iSMC 4 weeks, or UASMC to EPC). Plot includes probes that are significantly upregulated or downregulated (Fold Change < or >1.5, P-value < 0.05). (C) Venn diagrams displaying the numbers of common or unique genes that are either significantly upregulated or significantly downregulated when comparing each of the three groups (iSMC 2 weeks, iSMC 4 weeks, UASMC) to control EPC. (D) Graphical representation of hierarchical clustering analysis performed on the union of all of the significantly upregulated (Red, +2.88) or significantly downregulated genes (Blue, −2.88). (E) Molecular pathways associated with significantly upregulated or downregulated genes when comparing only iSMC to control EPC as determined by the WEB-based GEne SeT AnaLysis Toolkit (WebGestalt). The “Gene #” column refers to the number of identified genes that belong to a particular pathway and the “P-value” column refers to the P-value of each of the pathways and based on the number of identified genes. (F) A calculated smooth muscle contraction gene network based on known and predicted protein interactions (Co-expression, co-localization, pathway, physical interactions, predicted interactions, share protein domains) as determined by the GeneMANIA prediction server. Black circles mark genes that are significantly upregulated in iSMC (2 and 4 weeks) as compared to the control EPC. The table contains the level of gene upregulation and the P-value for each of the genes based on the ANOVA performed on all the data. Gray circles mark genes predicted to belong in the particular genetic network but found not to be significantly upregulated in iSMC as compared to EPC control cells. (G) Principal component analysis performed on the normalized signal values for each of the chip probes as well as probes from previously published studies: Skeletal Muscle,, Brain, Liver, Umbilical Vein and Coronary Artery Endothelial Cells, Aortic Smooth Muscle Cells,, Dermal Fibroblasts.
Figure 4
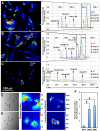
Figure 4. Functional characterization of iSMC using calcium transient mapping and cell traction force mapping
(A-C) Qualitative and quantitative output of calcium transient wave mapping in iSMC at 2 weeks post initiation of transdifferentiation (A), iSMC at 4 weeks after doxycycline removal (B), and control EPC at 4 weeks (C). RGB images (left) highlight cells of interest (numbered circles) at the peak change in fluorescent intensity (RGECO-1) outlined on the graphs (dotted box). The graphs (right) show the change in calcium influx in the highlighted cells over time in response to the indicated substances as measured by the change in fluorescent intensity (RGECO-1) of the highlighted cells. The background fluorescence is labeled as (−). (D-E) Elastic substrate traction mapping of an iSMC (D) and a control EPC (E). Images on the left are phase contrast microscopy images, middle images are bead displacement maps, and images on the right are the calculated constrained traction maps, where color bars indicate relative values. (F) Total cell traction force generated by EPC (n=12), iSMC (n=10), and UASMC (n=10). Error bars represent the standard deviation. There is a significant difference in total cell traction force between EPC and iSMC as well as EPC and UASMC, but there is no significant difference between UASMC and iSMC (# p<0.001, Student’s t-test).
Figure 5
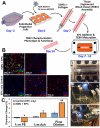
Figure 5. Functional assessment of iSMC-TEBV
(A) Illustration depicting the overall process for assembling a TEBV. A dense collagen gel with iSMC (7 days post-transduction) is molded into a hollow tubular construct using a syringe and a 1 mm diameter mandrel. The construct is then loaded / secured onto a perfusion chamber, and EPC are injected into the lumen of the construct to create an endothelium. The resulting TEBV is then matured under a continuous flow loop for up to 7 days before further assessment is performed. (B) The expression of contractile smooth muscle related genes, CNN1 and ACTA2, was detected by immunofluorescence in iSMC-TEBV (upper row), while the expression was minimal in the control EPC-TEBV (lower row). VWF, a major endothelial marker, was detected in both iSMC-TEBV and control EPC-TEBV, implying the presence of endothelial cells. (C-E) The setup of a perfusion system containing the TEBV. (C) A TEBV of approximately 2.5 cm length is loaded within a perfusion chamber. (D) A continuous flow from the media reservoir into the chamber is delivered using a peristaltic pump. (E) An AMScope connected to video capture software is used to record the vessel diameter change in TEBV for functional assessment. (F) Functional vasoactivity of the TEBV was assessed by measuring the vessel diameter change in response to the addition of vasoactive drugs and increased flow rate. iSMC-TEBV showed predicted vasoconstriction and vasodilation response to phenylephrine and acetylcholine, respectively, while the response was minimal in control EPC-TEBV. The vasodilation response to increased flow rate was higher in iSMC-TEBV than that of EPC-TEBV. N=3. Error bars are the standard error mean (One * for p-value <0.05, Two * for p-value <0.01, Student’s t-test).

References

    1. de Mel A, et al. A potential platform for developing 3D tubular scaffolds for paediatric organ development. J Mater Sci Mater Med. 2015;26:141. doi:10.1007/s10856-015-5477-4. - PubMed
    1. Ha JM, et al. Platelet-derived growth factor regulates vascular smooth muscle phenotype via mammalian target of rapamycin complex 1. Biochem Biophys Res Commun. 2015 doi:10.1016/j.bbrc.2015.05.097. - PubMed
    1. Owens GK, Kumar MS, Wamhoff BR. Molecular regulation of vascular smooth muscle cell differentiation in development and disease. Physiol Rev. 2004;84:767–801. doi:10.1152/physrev.00041.2003. - PubMed
    1. Li S, Sims S, Jiao Y, Chow LH, Pickering JG. Evidence from a novel human cell clone that adult vascular smooth muscle cells can convert reversibly between noncontractile and contractile phenotypes. Circ Res. 1999;85:338–348. - PubMed
    1. Somlyo AP, Somlyo AV. Ca2+ sensitivity of smooth muscle and nonmuscle myosin II: modulated by G proteins, kinases, and myosin phosphatase. Physiol Rev. 2003;83:1325–1358. doi:10.1152/physrev.00023.2003. - PubMed

Publication types

MeSH terms