

Inequalities in dementia incidence between six racial and ethnic groups over 14 years
- PMID: 26874595
- PMCID: PMC4969071
- DOI: 10.1016/j.jalz.2015.12.007
Inequalities in dementia incidence between six racial and ethnic groups over 14 years
Abstract
Introduction: Reducing racial/ethnic disparities is a primary objective of the National Alzheimer's Plan (NAPA), yet direct comparisons within large samples representing diversity of the United States are lacking.
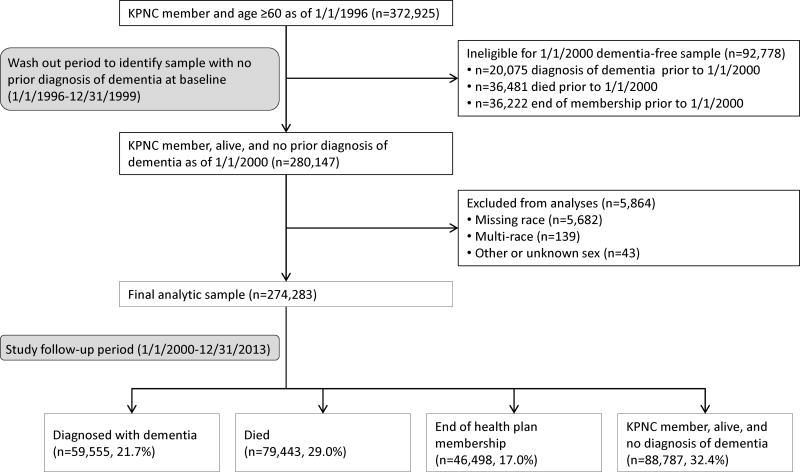
Methods: Dementia incidence from January 1, 2000 to December 31, 2013 and a 25-year cumulative risk in 274,283 health care members aged 64+ (n = 18,778 African-American, n = 4543 American Indian/Alaska Native [AIAN], n = 21,000 Latino, n = 440 Pacific Islander, n = 206,490 white, n = 23,032 Asian-Americans). Cox proportional hazard models were adjusted for age, sex, medical utilization, and comorbidities.
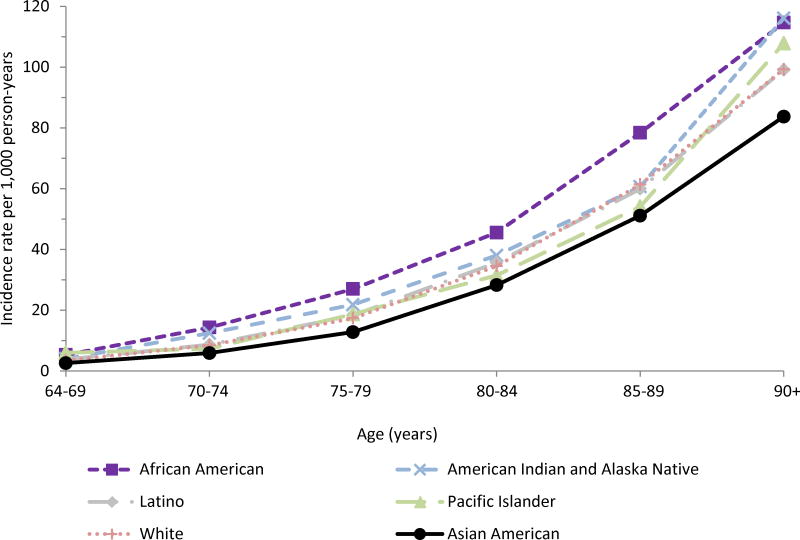
Results: Dementia incidence (n = 59,555) was highest for African-Americans (26.6/1000 person-years) and AIANs (22.2/1000 person-years); intermediate for Latinos (19.6/1000 person-years), Pacific Islanders (19.6/1000 person-years), and whites (19.3/1000 person-years) and lowest among Asian-Americans (15.2/1000 person-years). Risk was 65% greater for African-Americans (hazard ratio = 1.65; 95% confidence interval = 1.58-1.72) versus Asian-Americans. Cumulative 25-year risk at age 65 was as follows: 38% African-Americans, 35% AIANs, 32% Latino, 25% Pacific Islanders, 30% white, and 28% Asian-Americans.
Discussion: Dementia rates varied over 60% between groups, providing a comprehensive benchmark for the NAPA goal of reducing disparities.
Keywords: Cohort; Dementia; Disparities; Epidemiology; Ethnicity; Race.
Copyright © 2016 The Alzheimer's Association. Published by Elsevier Inc. All rights reserved.
Figures
References
-
- US Department of Health and Human Services. National plan to address Alzheimer’s disease: 2014 update. Washington, DC: 2014.
-
- Lines LM, Wiener JM. RACIAL AND ETHNIC DISPARITIES IN ALZHEIMER’S DISEASE: A Literature Review. 2014
-
- Alzheimer’s Association. 2015 Alzheimer’s disease facts and figures. Alzheimer’s & Dementia. 2015;11:332–84. - PubMed
Publication types
MeSH terms
Grants and funding
LinkOut - more resources
Full Text Sources
Other Literature Sources
Medical
Miscellaneous
