. 2016 Feb 23;14(7):1787-1799.
doi: 10.1016/j.celrep.2016.01.043. Epub 2016 Feb 11.

Improved Ribosome-Footprint and mRNA Measurements Provide Insights into Dynamics and Regulation of Yeast Translation

Affiliations

Improved Ribosome-Footprint and mRNA Measurements Provide Insights into Dynamics and Regulation of Yeast Translation

David E Weinberg et al. Cell Rep. .

Abstract

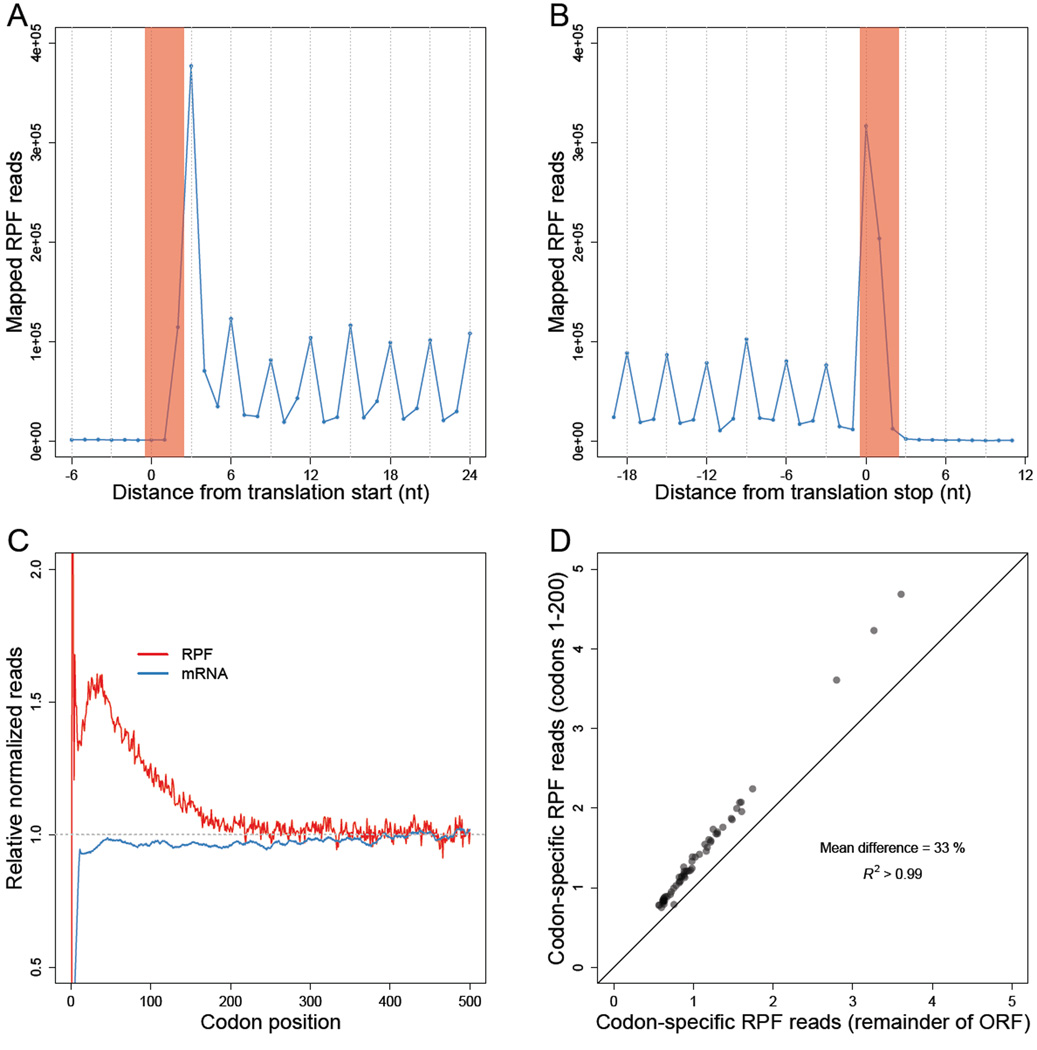
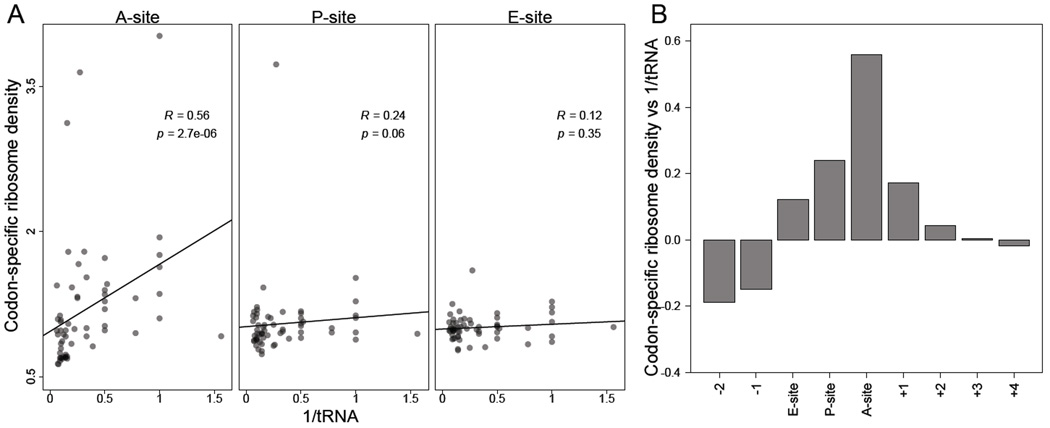
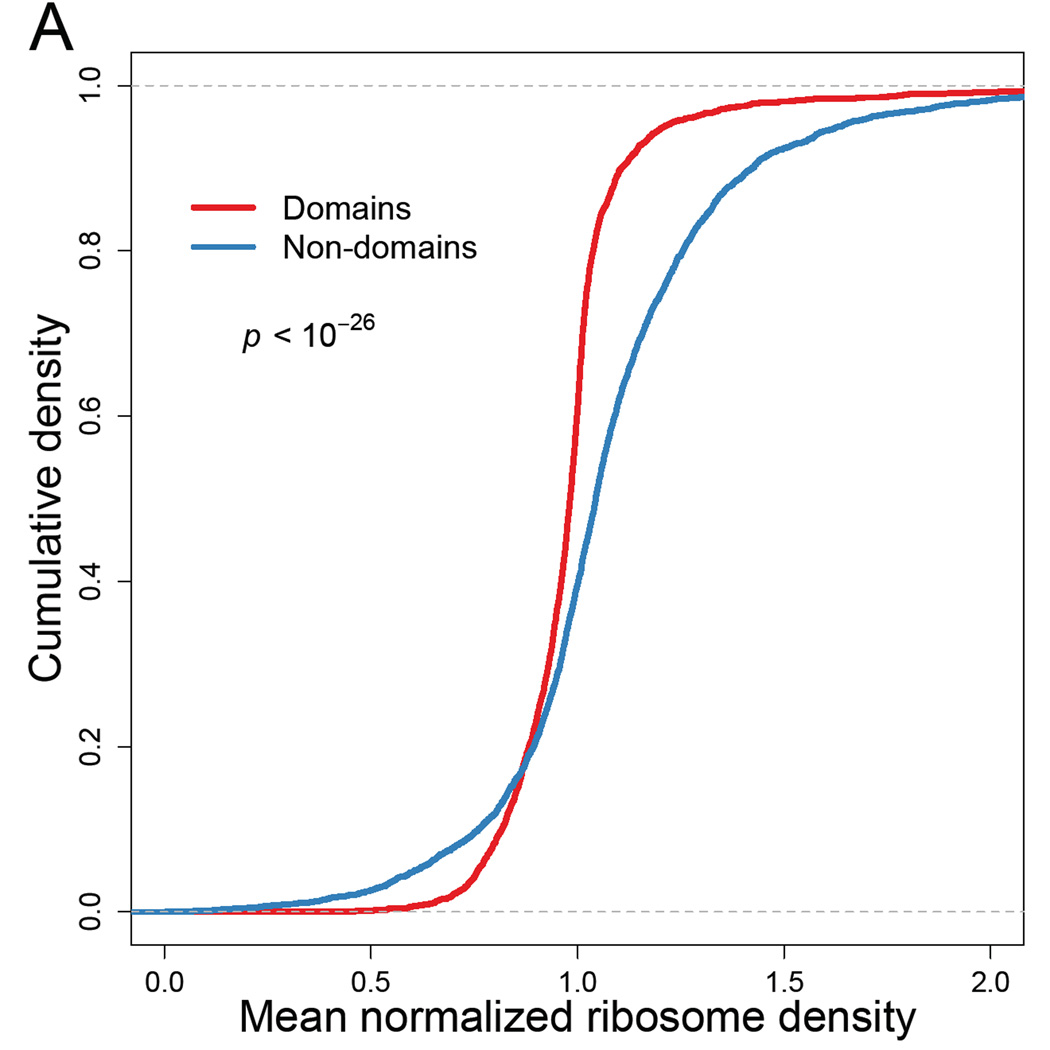
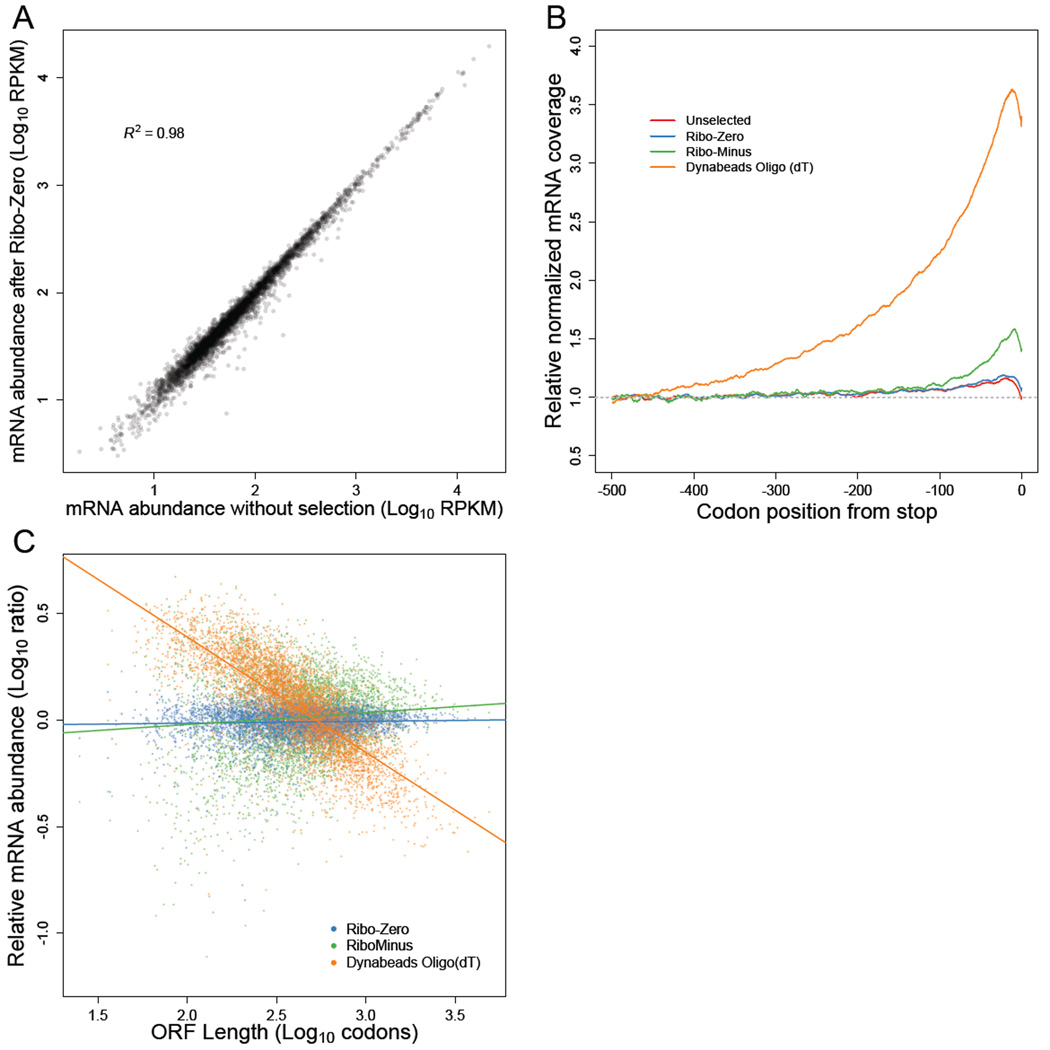
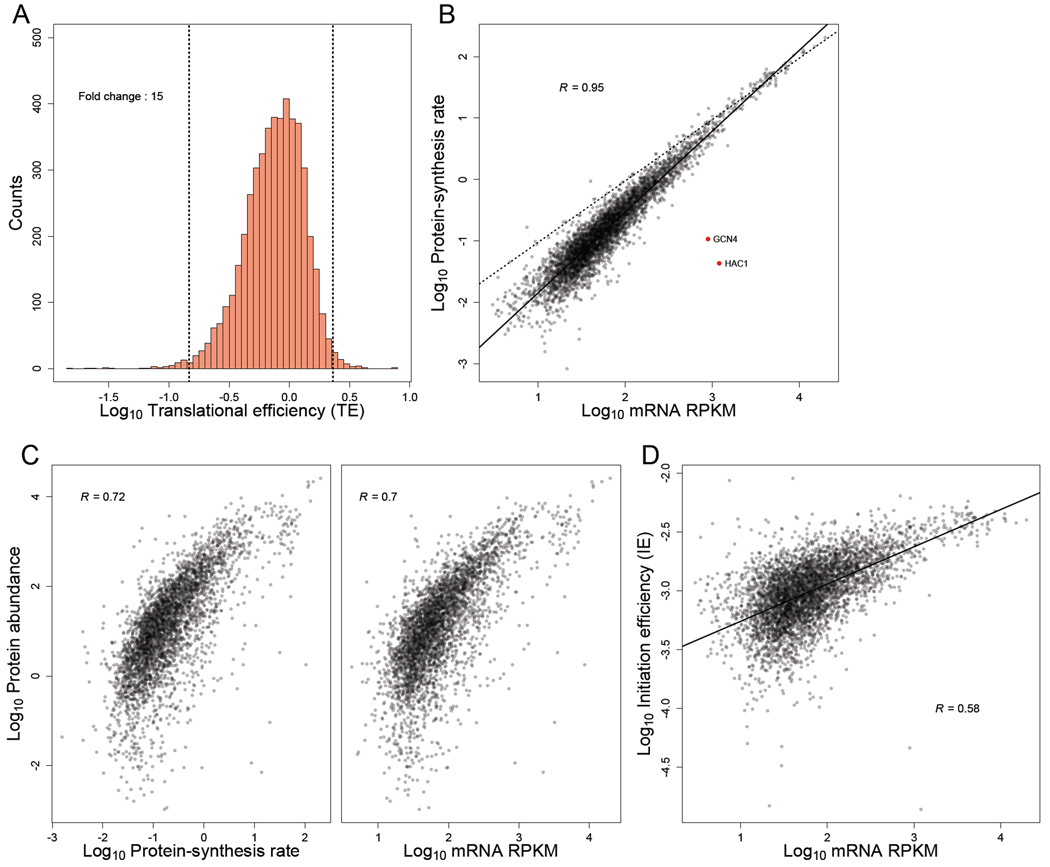
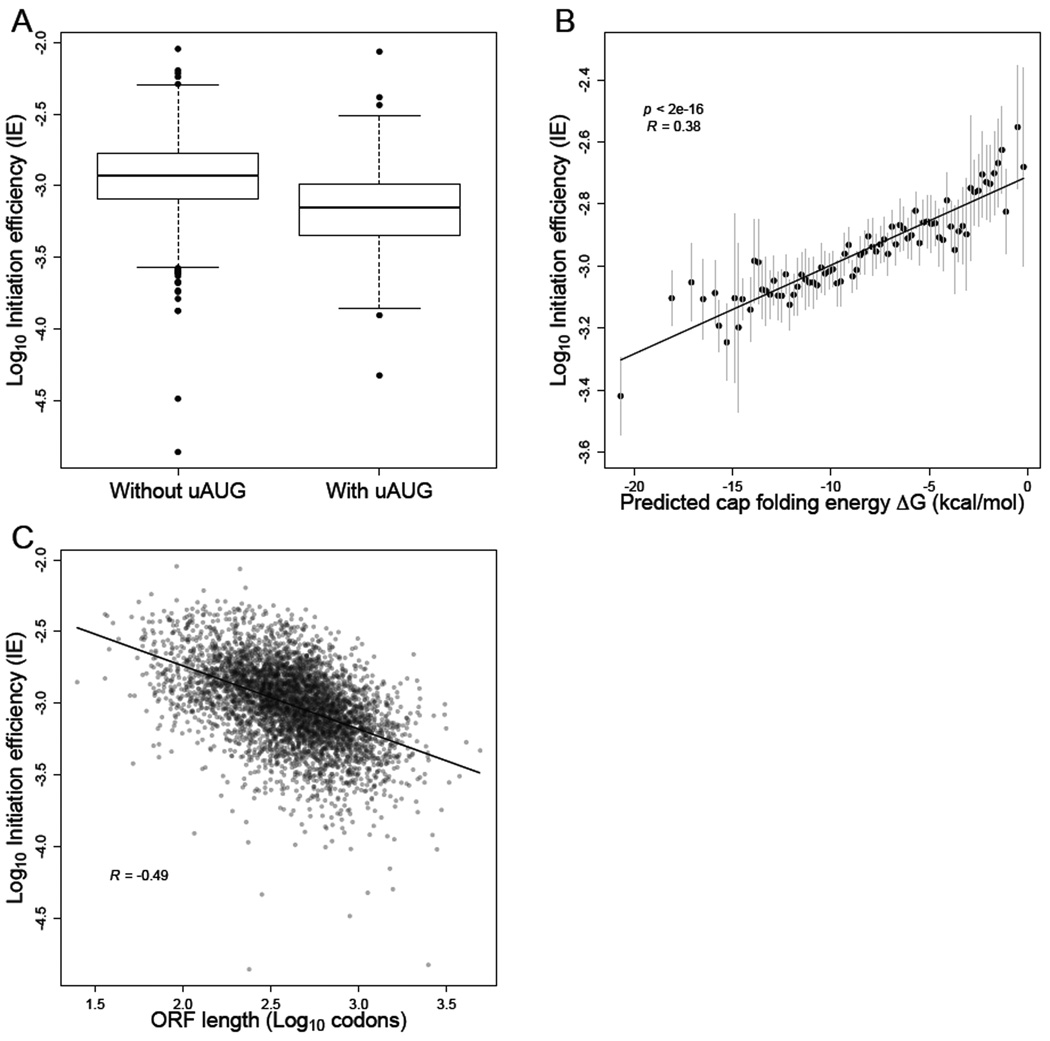
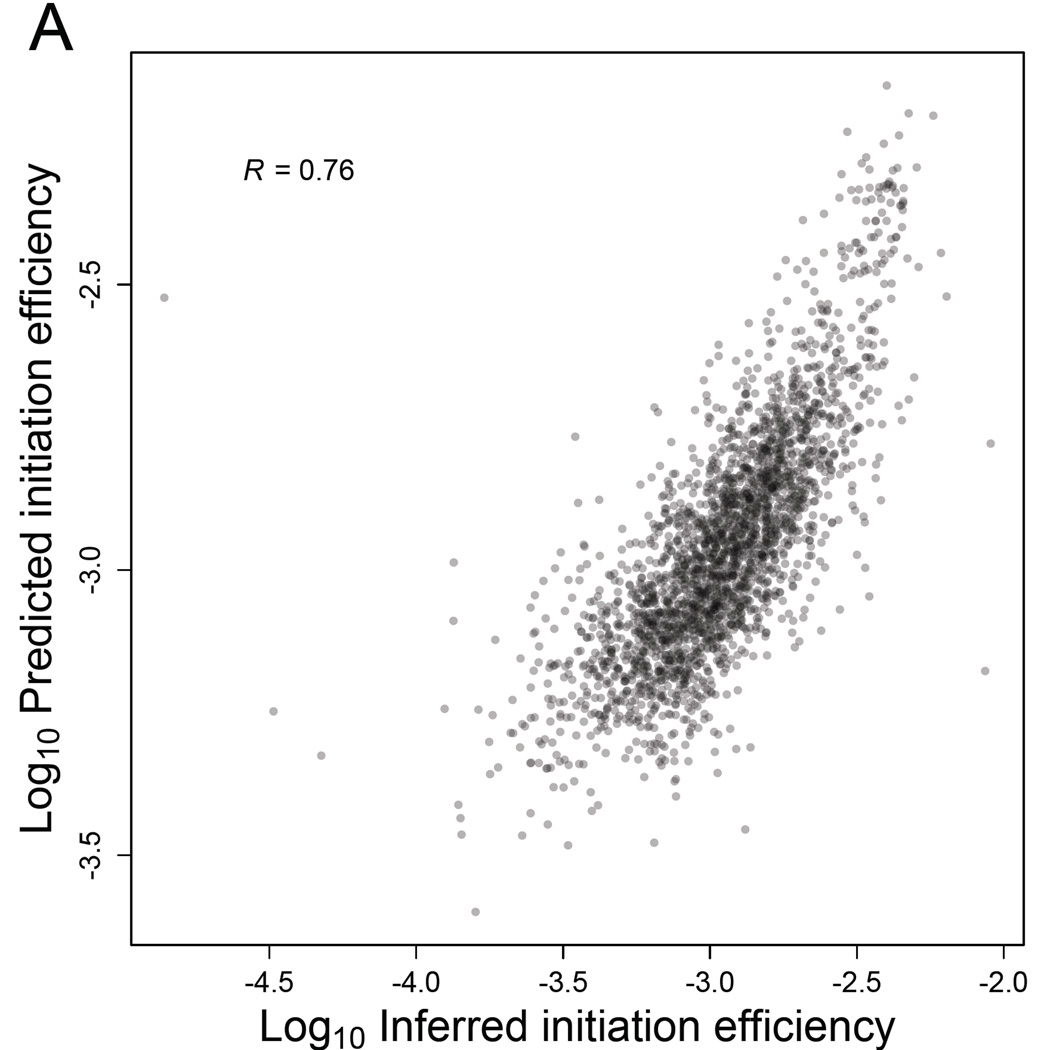
Ribosome-footprint profiling provides genome-wide snapshots of translation, but technical challenges can confound its analysis. Here, we use improved methods to obtain ribosome-footprint profiles and mRNA abundances that more faithfully reflect gene expression in Saccharomyces cerevisiae. Our results support proposals that both the beginning of coding regions and codons matching rare tRNAs are more slowly translated. They also indicate that emergent polypeptides with as few as three basic residues within a ten-residue window tend to slow translation. With the improved mRNA measurements, the variation attributable to translational control in exponentially growing yeast was less than previously reported, and most of this variation could be predicted with a simple model that considered mRNA abundance, upstream open reading frames, cap-proximal structure and nucleotide composition, and lengths of the coding and 5' UTRs. Collectively, our results provide a framework for executing and interpreting ribosome-profiling studies and reveal key features of translational control in yeast.


Figures

Figure 1
Figure 1. Less perturbed RPFs reveal a codon-independent 5' ramp
(A–B) Metagene analyses of RPFs. Coding sequences were aligned by their start (A) or stop (B) codons (red shading). Plotted are the numbers of 28–30-nt RPF reads with the inferred ribosomal A site mapping to the indicated position along the ORF. (C) Metagene analyses of RPFs and RNA-seq reads (mRNA). ORFs with at least 128 total mapped reads between ribosome-profiling (red) and RNA-seq (blue) samples were individually normalized by the mean reads within the ORF, and then averaged with equal weight for each codon position across all ORFs (ej Eqn S10 and hj Eqn S14). (D) Comparison of codon-specific RPFs as a function of the 5' ramp. For each of the codons, densities of RPFs with ribosomal A sites mapping to that codon were calculated using either only the ramp region of each ORF (codons 1–200) or the remainder of each ORF (v5k Eqn S16 and v3k Eqn S17, respectively). The diagonal line indicates the result expected for no difference between the two regions. See also Figure S1.
Figure 2
Figure 2. Codons corresponding to lower-abundance tRNAs are decoded more slowly
(A) Correlation between codon-specific excess ribosome densities and cognate tRNA abundances. Codons within RPFs were assigned to the A-, P-, and E-site positions based on the distance from the 5' ends of fragments, and codonspecific excess ribosome densities were calculated (vk, Eqn S19). Cognate tRNA abundances for each codon were estimated using the genomic copy numbers of iso-accepting tRNAs and wobble parameters (Table S2). Spearman R values are shown, with their significance (p values). (B) The correlations of codon–tRNA abundance at different positions relative to the A site. Analysis was as in (A) using varying offsets from the A-site position within RPFs (x axis) to calculate Spearman correlations (y axis). See also Figures S2–3 and Tables S1–2.
Figure 3
Figure 3. Elongation dynamics correlate domain architecture
(A) Cumulative distributions of normalized ribosome densities within and outside of protein-folding domains. Mean normalized RPF densities (zij, Eqn S7) for codons within the domain-encoding and non-domain-encoding regions were individually calculated for each ORF. Domain assignments were based on InterProScan classifications (Jones et al., 2014) obtained from the Superfamily database (Wilson et al., 2009). Statistical significance was evaluated using paired t-test (p < 10−26). See also Figure S4.
Figure 4
Figure 4. mRNA enrichment methods can bias mRNA abundance measurements
(A) mRNA abundances measured by RNA-seq of Ribo-Zero-treated RNA compared to those measured by RNA-seq of total unselected RNA. Pearson R2 is indicated. (B) Metagene analysis of RNA-seq read density in total unselected or mRNA-enriched RNA samples. Coding sequences were aligned by their stop codons, and RNA-seq reads were individually normalized by the mean reads within the ORF and then averaged with equal weight for each codon position across all ORFs (h’’j Eqn S15). (C) mRNA abundances for mRNA-enriched samples relative to total unselected RNA, as a function of ORF length. See also Figures S5–7 and Tables S3–4.
Figure 5
Figure 5. TEs and IEs span a narrow range in log-phase yeast cells
(A) Distribution of TE measurements, with vertical dashed lines marking the 1st and 99th percentiles, and the fold-change separating these percentiles indicated. All ORFs with at least 128 total reads between the ribosome-profiling and RNA-seq datasets were included (except YCR024C-B, which was excluded because it is likely the 3' UTR of PMP1 rather than an independently transcribed gene). (B) Relationship between estimated protein-synthesis rate and mRNA abundance for genes shown in (A). GCN4 and HAC1 (red points) were the only abundant mRNAs with exceptionally low protein-synthesis rates. The best linear least-squares fit to the data is shown (solid line), with the Pearson R. For reference, a one-to-one relationship between protein-synthesis rate and mRNA abundance is also shown (dashed line). (C) Relationship between with experimentally measured protein abundance (de Godoy et al., 2008) and either (left) or mRNA abundance (right). The 3,845 genes from (A) for which protein-abundance measurements were available were included in these analyses. Pearson correlations are shown (R). (D) Relationship between mRNA abundance and IE for genes shown in (A). The best linear least-squares fit to the data is shown, with the Pearson R. See also Figures S8–9 and Table S5.
Figure 6
Figure 6. mRNA sequence, structure, and length correlate with IE
(A) Reduced IE values for genes with at least one upstream AUG (i.e., an AUG codon located within the annotated 5' UTR). The plots indicated the median (line), quartile (box) and 1st and 99th percentiles (whiskers) of the distributions. (B) Inverse relationship between IE and the folding energy of predicted RNA secondary structure near the cap (Cap-folding energy). RNAfold was used to estimate folding energies for the first 70 nt of the mRNA. Gray bars indicate 1 SD of IE values for genes binned by predicted folding energy. The best linear least-squares fit to the data is shown (solid line), with the Pearson R. (C) Inverse relationship between IE and ORF length. The best linear least-squares fit to the data is shown (solid line), with the Pearson R. See also Figure S7.
Figure 7
Figure 7. Sequence-based features of mRNAs largely explain yeast IEs
(A) Correspondence between predicted IEs and IEs inferred directly from the RPF and RNA-seq data. Initiation efficiencies were predicted using a multiple-regression model, based on mRNA abundance and sequence-based features of the 2549 genes with empirically determined 5'-UTRs. Shown is the Pearson R. See also Table S6.

Similar articles

Cited by

References

    1. Amrani N, Ghosh S, Mangus DA, Jacobson A. Translation factors promote the formation of two states of the closed-loop mRNP. Nature. 2008;453:1276–1280. - PMC - PubMed
    1. Andersson SG, Kurland CG. Codon preferences in free-living microorganisms. Microbiological reviews. 1990;54:198–210. - PMC - PubMed
    1. Arava Y, Wang Y, Storey JD, Liu CL, Brown PO, Herschlag D. Genome-wide analysis of mRNA translation profiles in Saccharomyces cerevisiae. Proceedings of the National Academy of Sciences of the United States of America. 2003;100:3889–3894. - PMC - PubMed
    1. Arribere JA, Gilbert WV. Roles for transcript leaders in translation and mRNA decay revealed by transcript leader sequencing. Genome research. 2013;23:977–987. - PMC - PubMed
    1. Artieri CG, Fraser HB. Evolution at two levels of gene expression in yeast. Genome research. 2014;24:411–421. - PMC - PubMed

Publication types

MeSH terms