. 2016 Feb 23;14(7):1735-1747.
doi: 10.1016/j.celrep.2016.01.038. Epub 2016 Feb 11.

Genome-wide Analysis Identifies Bcl6-Controlled Regulatory Networks during T Follicular Helper Cell Differentiation

Affiliations

Genome-wide Analysis Identifies Bcl6-Controlled Regulatory Networks during T Follicular Helper Cell Differentiation

Xindong Liu et al. Cell Rep. .

Abstract

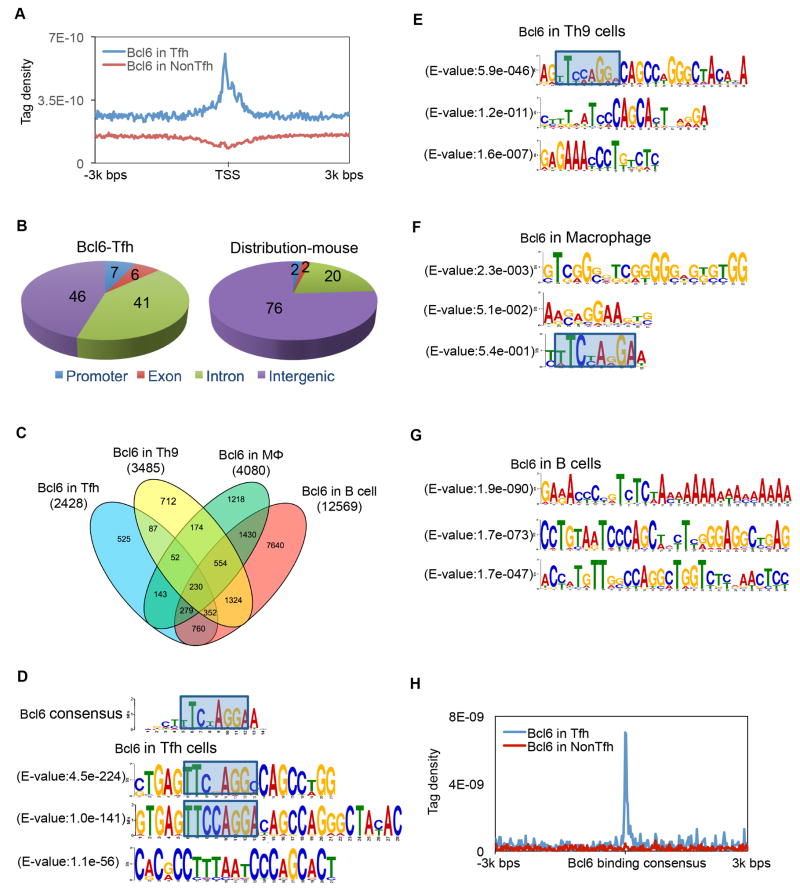
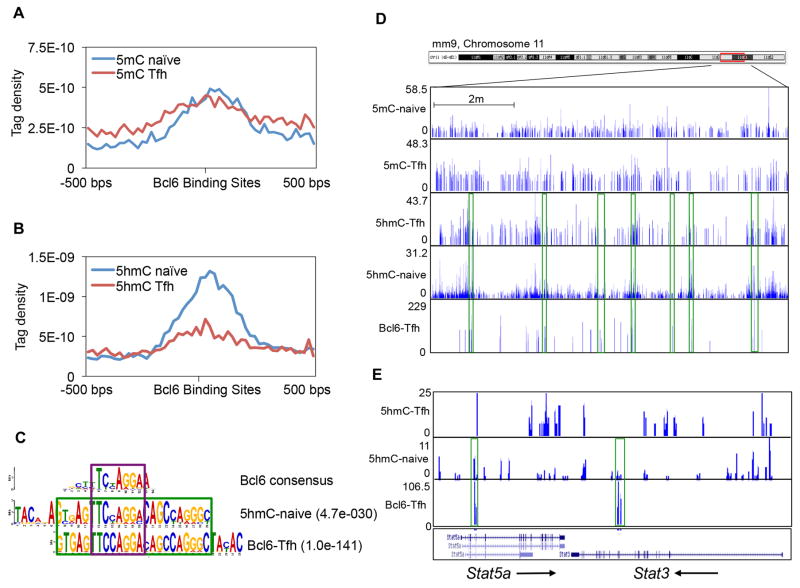
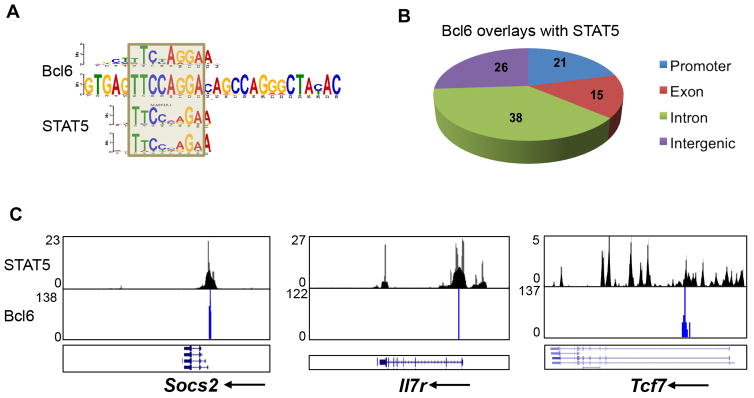
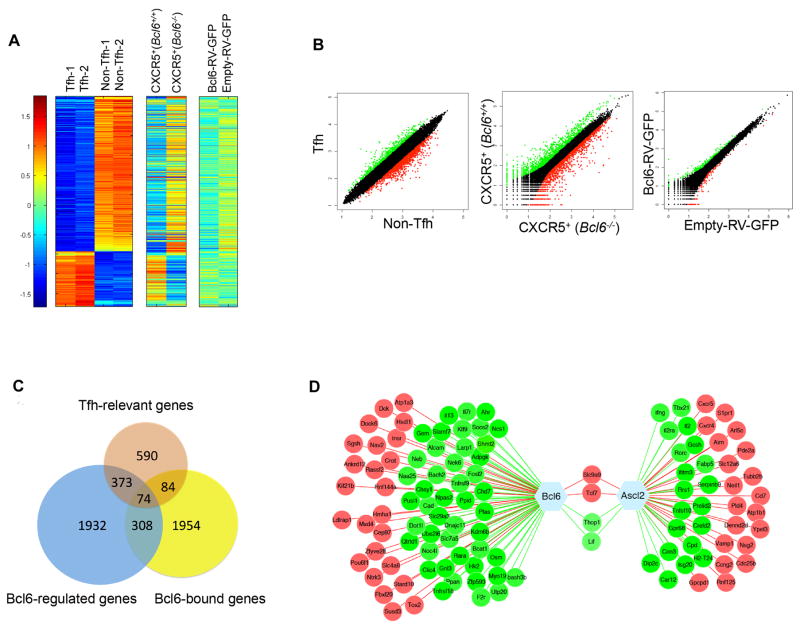
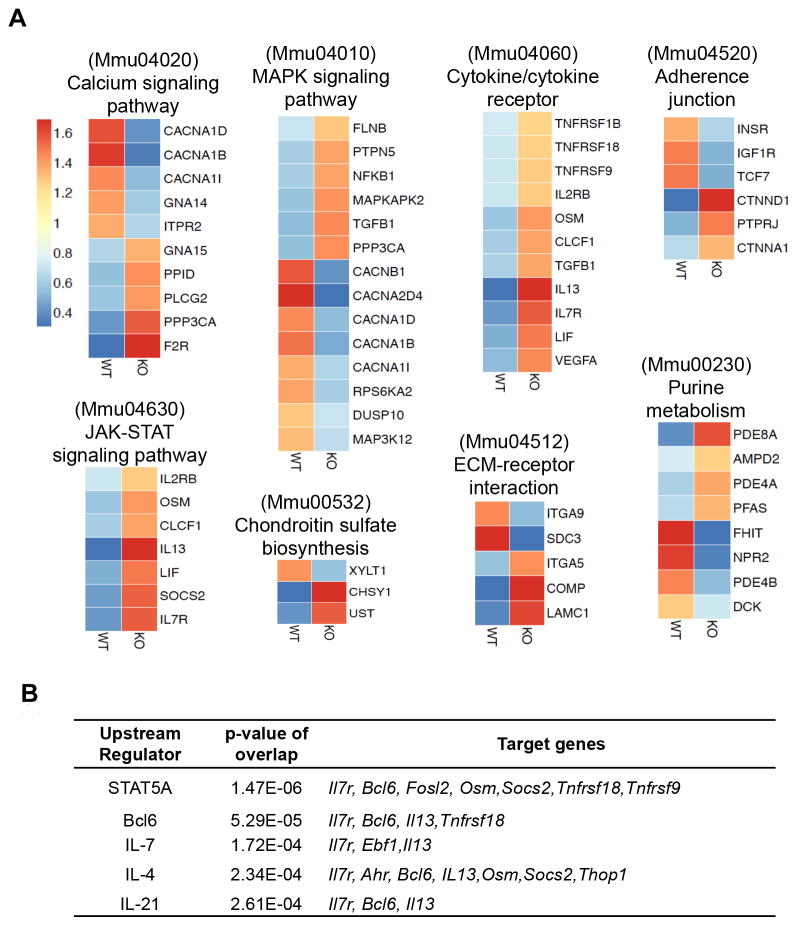
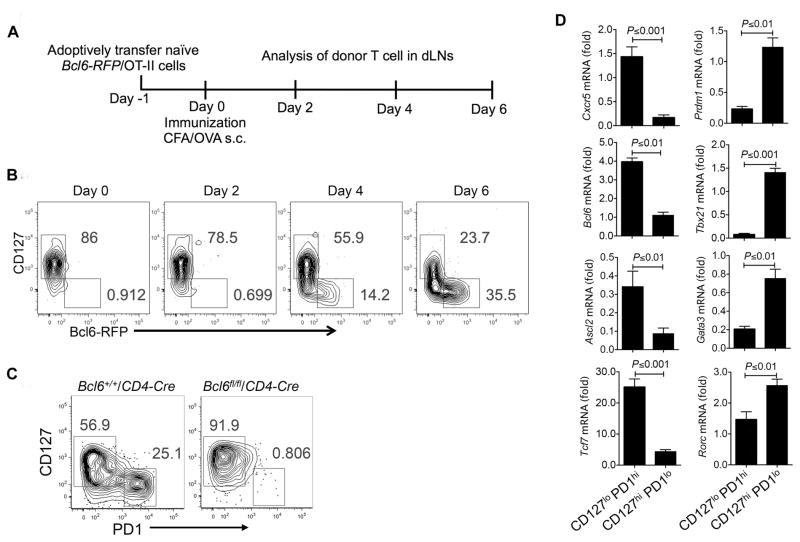
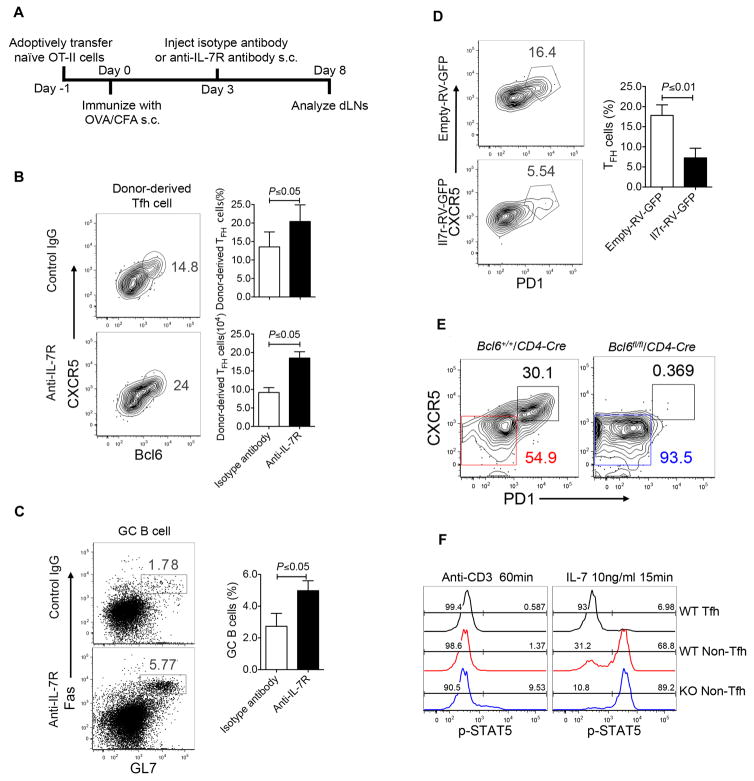
T follicular helper (Tfh) cell is a unique T cell subset specialized in promoting humoral immunity. B-cell lymphoma 6 protein (Bcl6) has been identified as an obligatory transcription factor in Tfh cells; however, the molecular mechanism underlying Bcl6 function remains largely unknown. Here, we defined Bcl6 target genes in Tfh cells by analyzing genome-wide Bcl6 occupancy together with transcriptome profiling. With consensus sequences being different from those in Th9, B cells, and macrophages, Bcl6 binding in Tfh cell was closely associated with a decrease in 5-hydroxymethylcytosine (5hmC). Importantly, Bcl6 promoted Tfh cell differentiation through antagonizing IL-7R (CD127)/signal transducer and activator of transcription (STAT) 5 axis; deletion of the Bcl6 gene in T cells resulted in enhanced IL-7R-STAT5 signaling and substantial expansion of CD127(hi) non-Tfh cells. Thus, our study systemically examines Bcl6-controlled regulatory networks and provides important insights into Bcl6's biological functions in Tfh cells.


Conflict of interest statement

The authors declare no competing financial interests.

Figures

Figure 1
Figure 1. Preferential Bcl6 binding motifs in Tfh, Th9, Macrophage and B cells
A. Bcl6 binding in Tfh vs. Non-Tfh cells. TSS, transcription start site. The tag density of Bcl6 binding around TSS of all RefSeq (mm9) genes, uniquely mapped tags were summarized in 20 bp windows. All window tag counts were normalized by the total number of bases in the windows and the total read number of the given sample. B. Distribution of Bcl6 binding peaks in Tfh cells, and distribution of the genetic features across the whole mouse genome (mm9). C. Venn diagram of genes bound by Bcl6 in Tfh, Th9, B cells, and macrophages. ChIP-seq data for Bcl6 binding in Th9 were derived from GenBank under accession GSE41317-GSM1234367 (Liao et al., 2014), macrophage were derived from GenBank under accession GSE16723 (Barish et al., 2010), and Bcl6 binding in B cells was from GSE43350 (Huang et al., 2013). D. Classical Bcl6 binding consensus, and Bcl6 binding motifs in Tfh cell. E. Bcl6 binding motifs in Th9 cell (original sequence reads were reanalyzed and mapped to mouse genome mm9). F. Bcl6 binding motifs in macrophages. G. Bcl6 binding motifs in B cells. H. Alignment of Bcl6 binding consensus on overall ChIP-seq signal in Tfh and non-Tfh cells.
Figure 2
Figure 2. Bcl6 recruitment to target genes in Tfh cells reduced the level of 5-hydroxymethylcytosine (5hmC)
A. At Bcl6-bound regions, 5-methylcytosine (5mC) enrichments were compared between Naïve T and Tfh cells. B. At Bcl6-bound regions, 5-hydroxymethylcytosine (5hmC) enrichments were compared between Naïve T and Tfh cells. C. Classical Bcl6 binding consensus, 5hmC-enrichment motif in Naïve T cells, and Bcl6 binding motif in Tfh cells. D. ChIP-Seq binding tracks for 5mC, 5hmC, and Bcl6 at selected chromosome 11 regions in Naïve and Tfh cells. Green frames represent the co-localization of peaks. F. ChIP-Seq binding peaks for 5hmC and Bcl6 at selected Stat5a and Stat3 gene loci in Naïve and Tfh cells. Green frames represent the co-localization of peaks.
Figure 3
Figure 3. Preferential Bcl6 binding to STAT5 motifs in T cells
MEME-ChIP (http://meme.nbcr.net/meme/tools/meme-chip) (default parameters) were applied to analyze the consensus sequences within Bcl6 binding sites in Tfh cells and STAT5 binding sites in Th17 cells (Yang et al., 2011). The binding sites of both Bcl6 and Stat5 were first defined using the SICER V1.1 program. A binding site is defined as one or several consecutive windows of 200 bp of the genome where a significant enrichment of sequencing reads against the background appears. If any part of one TF binding site overlaps with the other one, it is defined as the overlay of the two binding sites. A. Comparison of Bcl6 binding motifs in Tfh cells with STAT5 binding motifs in T cells. ChIP-Seq data for STAT5 binding in T cells was derived from GSE26553-GSM652878 (Yang et al., 2011). B. Distribution of Bcl6/STAT5 co-occupancies in proximal promoter, exon, intron, and intergenic regions C. Bcl6- and STAT5-colocalized peaks located at gene loci including Socs2, Il7r, and Tcf7
Figure 4
Figure 4. Bcl6-dependent transcriptional regulation of Tfh-relevant genes
A. Heat map of ~1100 Tfh-relevant genes regulated in CXCR5hi Bcl6-RFPhi Tfh and CXCR5lo Bcl6-RFPlo Non-Tfh cells (student T test on Tfh vs non-Tfh microarray data analysis and identified ~1100 genes with at least 2 fold difference (Heat map of ~1100 TFH-relevant genes (p<0.05, student T test; fold change >2), Microarray accession GSE40068 (Liu et al., 2012), left column), donor-derived CXCR5+ Bcl6+/+ OT-II and CXCR5+ Bcl6−/− OT-II cells (RNA-Seq, middle column), and Bcl6-RV-GFP- or control vector-transduced T cells cultured under Th0 condition for 4 days (RNA-Seq, right column). The color-coding applies to gene expression level (log2) with 0 as median. B. Scatterplot of the average signal of Tfh versus Non-Tfh cells gene expression microarray data, Day-3-donor-derived CXCR5+ Bcl6+/+ versus CXCR5+ Bcl6−/− OT-II cells gene expression RNA-Seq data, and Bcl6-RV-GFP+ versus Empty-RV-GFP+ T cell gene expression RNA-Seq data. C. Venn diagram of Tfh-relevant genes, Bcl6-regulated genes and Bcl6-bound genes. D. Bcl6- and Ascl2 (accession GSE52840 (Liu et al., 2014))-targeted Tfh-specific genes. Green represents downregulation of gene expression; red represents upregulation of gene expression.
Figure 5
Figure 5. Bcl6-mediated regulatory modules for Tfh cell development
A. Kyoto Encyclopedia Gene and Genome (KEGG) pathway analysis of Bcl6 directly regulated genes using DAVID. A heatmap of normalized gene expression levels was shown. Blue represents downregulation of gene expression and red represents upregulation of gene expression, with 1 as the median. B. Upstream regulators prediction performed using the ingenuity analysis tool (IPA) on Bcl6-target genes with the value p<0.05.
Figure 6
Figure 6. Reciprocal expression of IL-7R and Bcl6 during differentiation of activated CD4+ T cells into distinct T cell subsets
A–B Naïve Bcl6-RFP/OT-II CD4+ T cells were transferred into naïve congenic CD45.1 mice, which were subsequently immunized with OVA/CFA subcutaneously. Data are a representative of two independent experiments. A. Experimental design for measuring Bcl6-RFP and IL-7R expression in donor-derived Bcl6-RFP/OT-II cells in vivo. B. Flow cytometry analysis of CD127 and Bcl6-RFP expression in donor-derived Bcl6-RFP/OT-II cell in a time-dependent manner. C. Flow cytometry measurement of CD127 and PD1 expression on activated CD44+ CD4+ T cell in draining LNs from Bcl6+/+/CD4-Cre and Bcl6fl/fl/CD4-Cre mice immunized with KLH/CFA subcutaneously for eight days. Data are a representative of two independent experiments. D. Two populations of CD127hi PD1lo and CD127lo PD1hi were sorted from CD44+ CD4+ T cell pools in dLNs of Bcl6+/+/CD4-Cre mice immunized with KLH emulsified in CFA subcutaneously. Quantitative RT-PCR measurement of Cxcr5, Bcl6, Ascl2, Tcf7, Prdm1, Tbx21, Gata3, and Rorc mRNA expression in sorted two populations of cells. Data are a representative of two independent experiments. Bar graph displayed as mean ± SD. n = 3 per group.
Figure 7
Figure 7. Bcl6 protected Tfh cells from negative regulation of IL-7R/STAT5 axis
A. Experimental design for testing IL-7R function in vivo. B–C. Naïve OT-II cells were adoptively transferred into naïve congenic mice, followed with subcutaneous OVA/CFA immunization. At day 3 after immunization, anti-IL-7R or isotype control antibodies (200μg/mouse) were injected subcutaneously into mice, respectively. Data are a representative of two independent experiments. n = 3 per group. B. At day8 post immunization, flow cytometry analysis of donor-derived cells in dLNs with CXCR5 and Bcl6 staining. Bar graph displayed as mean ± SD. n = 4 per group. C. GC B cells (GL-7hi Fashi) in recipient mice. Bar graph displayed as mean ± SD. n = 4 per group. D. Il7r-RV-GFP- or control vector- transduced OT-II cells were adoptively transferred into naïve congenic mice, respectively, followed with subcutaneous OVA/CFA immunization for seven days. Flow cytometry analysis of donor-derived cells from dLNs with CXCR5 and PD1 staining. Data are a representative of two independent experiments. Bar graph displayed as mean ± SD. n = 4 per group. E–F. Bcl6+/+/CD4-Cre and Bcl6fl/fl/CD4-Cre mice were subcutaneously immunized with KLH/CFA. Data are a representative of two independent experiments. n = 4 per group. E. At day 8, flow cytometry analysis of Tfh and Non-Tfh cells from dLNs with staining CXCR5 and PD1. F. Three populations of cells including CD4+ CD44hi CXCR5hi PD1hi Tfh cells from Bcl6+/+/CD4-Cre mice, CD4+ CD44hi CXCR5lo PD1lo Non-Tfh cells from both Bcl6+/+/CD4-Cre and Bcl6fl/fl/CD4-Cre mice were sorted, re-stimulated with plate-coated anti-CD3 or IL-7, and subject to intracellular measurement of STAT5 phosphorylation by flow cytometry. Data are a representative of two independent experiments.

Similar articles

Cited by

References

    1. Allen CD, Okada T, Cyster JG. Germinal-center organization and cellular dynamics. Immunity. 2007;27:190–202. - PMC - PubMed
    1. Ballesteros-Tato A, Leon B, Graf BA, Moquin A, Adams PS, Lund FE, Randall TD. Interleukin-2 inhibits germinal center formation by limiting T follicular helper cell differentiation. Immunity. 2012;36:847–856. - PMC - PubMed
    1. Barish GD, Yu RT, Karunasiri M, Ocampo CB, Dixon J, Benner C, Dent AL, Tangirala RK, Evans RM. Bcl-6 and NF-kappaB cistromes mediate opposing regulation of the innate immune response. Genes Dev. 2010;24:2760–2765. - PMC - PubMed
    1. Barish GD, Yu RT, Karunasiri MS, Becerra D, Kim J, Tseng TW, Tai LJ, Leblanc M, Diehl C, Cerchietti L, et al. The Bcl6-SMRT/NCoR cistrome represses inflammation to attenuate atherosclerosis. Cell Metab. 2012;15:554–562. - PMC - PubMed
    1. Basso K, Saito M, Sumazin P, Margolin AA, Wang K, Lim WK, Kitagawa Y, Schneider C, Alvarez MJ, Califano A, Dalla-Favera R. Integrated biochemical and computational approach identifies BCL6 direct target genes controlling multiple pathways in normal germinal center B cells. Blood. 2010;115:975–984. - PMC - PubMed

Publication types

MeSH terms