. 2016 Sep 15;35(37):4914-26.
doi: 10.1038/onc.2016.23. Epub 2016 Feb 15.

Radiotherapy-induced miR-223 prevents relapse of breast cancer by targeting the EGF pathway

Affiliations

Radiotherapy-induced miR-223 prevents relapse of breast cancer by targeting the EGF pathway

L Fabris et al. Oncogene. .

Abstract

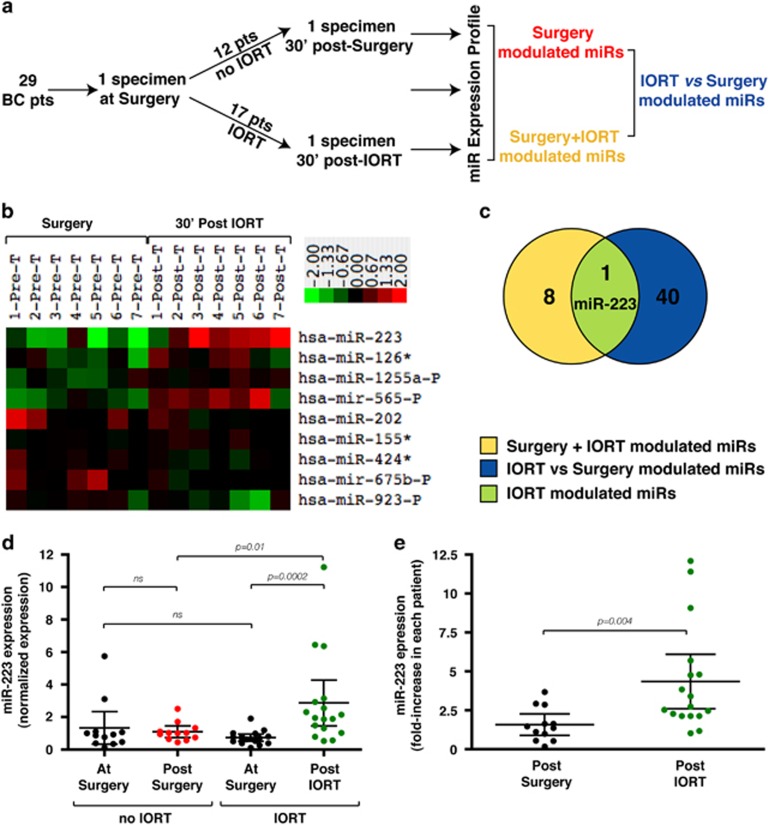
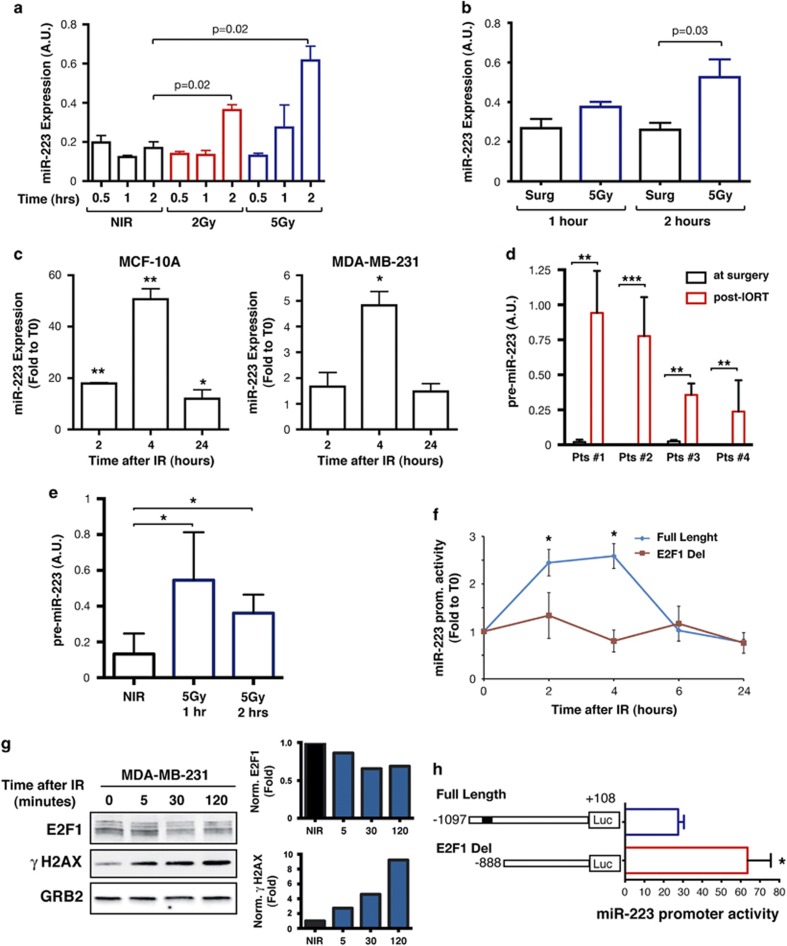
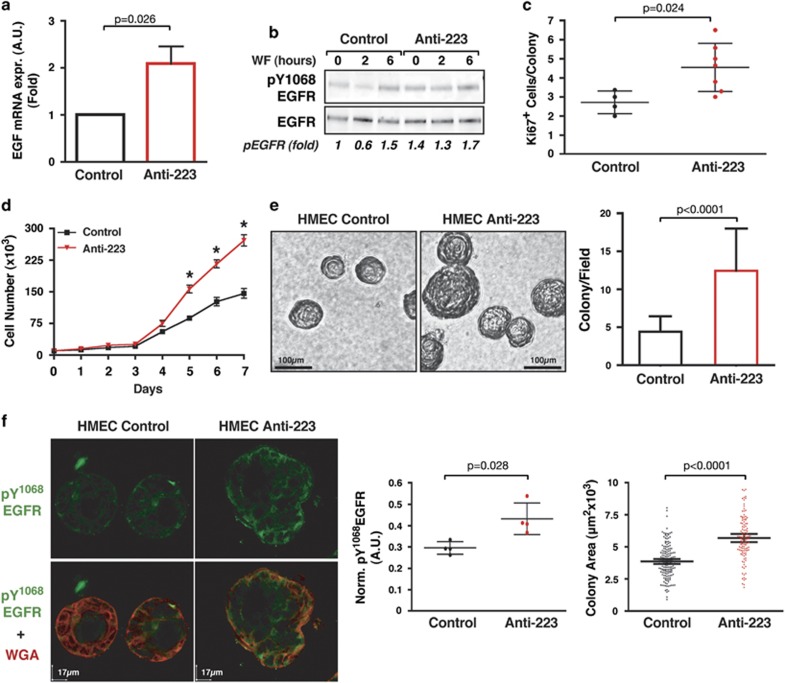
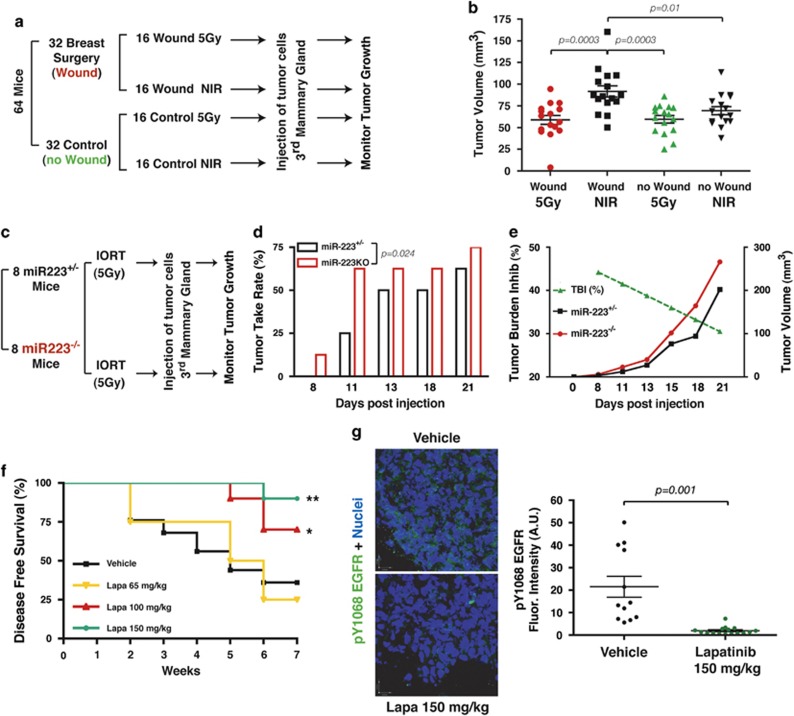
In breast cancer (BC) patients, local recurrences often arise in proximity of the surgical scar, suggesting that response to surgery may have a causative role. Radiotherapy (RT) after lumpectomy significantly reduces the risk of recurrence. We investigated the direct effects of surgery and of RT delivered intraoperatively (IORT), by collecting irradiated and non-irradiated breast tissues from BC patients, after tumor removal. These breast tissue specimens have been profiled for their microRNA (miR) expression, in search of differentially expressed miR among patients treated or not with IORT. Our results demonstrate that IORT elicits effects that go beyond the direct killing of residual tumor cells. IORT altered the wound response, inducing the expression of miR-223 in the peri-tumoral breast tissue. miR-223 downregulated the local expression of epidermal growth factor (EGF), leading to decreased activation of EGF receptor (EGFR) on target cells and, eventually, dampening a positive EGF-EGFR autocrine/paracrine stimulation loop induced by the post-surgical wound-healing response. Accordingly, both RT-induced miR-223 and peri-operative inhibition of EGFR efficiently prevented BC cell growth and reduced recurrence formation in mouse models of BC. Our study uncovers unknown effects of RT delivered on a wounded tissue and prompts to the use of anti-EGFR treatments, in a peri-operative treatment schedule, aimed to timely treat BC patients and restrain recurrence formation.


Figures

Figure 1
Figure 1
IORT treatment modifies miR expression in peri-tumoral microenvironment. (a) Schematic representation of the experimental design. Two specimens of peri-tumoral breast tissue were collected from 29 BC patients undergoing surgery. Among these patients, 12 underwent only surgery and 17 also underwent IORT. From each patient, one specimen was collected right after surgery ('at surgery') and one 30 min post surgery or 30 min post IORT. (b) Heat map of differentially expressed miRs in paired samples of the IORT-treated patients. (c) Venn diagram of miRs differentially expressed in paired samples of the IORT-treated patients (yellow) and in samples collected post surgery with respect to post-IORT (blue). miR-223 is differentially expressed in both comparisons (green). (d, e) qRT–PCR of miR-223 expression in the groups described in a, expressed as normalized for U6 levels (d) or as fold increase in paired samples from each patient. (e) Graphs report the median value (±s.d.) of samples in each group. Statistical significance is reported in each graph and was calculated using the Mann–Whitney test.
Figure 2
Figure 2
Irradiation induces miR-223 expression both in vivo and in vitro. (a) qRT–PCR of normalized miR-223 expression in samples from mice treated with IORT, at 2 Gy or 5 Gy, collected at the indicated time point after the irradiation (n=3). Controlateral non-irradiated (NIR) mammary gland of each mouse was used as a control (n=6). (b) qRT–PCR of normalized miR-223 expression in samples from mice subjected to surgery on the left and surgery plus IORT (5 Gy) on the right mammary gland, after 1 and 2 h from irradiation (n=4 for each time point). (c) qRT–PCR of miR-223 (expressed as fold increase over the NIR cells) in MCF-10A mammary epithelial cells (left graph) and in MDA-MB-231 breast cancer cells (right graph) irradiated in vitro with 2 Gy. Data were normalized using U6 expression levels. (d) qRT–PCR of pre-miR-223 expression in paired breast peri-tumoral tissues, described in Figure 1. Specimens were harvested at the moment of surgery, right after tumor removal (at surgery) or after IORT delivery (post IORT). Data were normalized using GAPDH expression levels. (e) qRT–PCR of pre-miR-223 expression in mouse breast tissues described in b. Data were normalized using GAPDH expression levels. (f) Graph reports normalized luciferase activity associated with full-length (blue line) and with E2F1-deleted (E2F1-Del) (red line) miR-223 promoter, transfected in MDA-MB-231. Data are expressed as fold increase over the T0 of irradiation. Schematic representation of the promoters is shown in h. (g) Western blot analysis of E2F1 expression in MDA-MB-231 cells, irradiated with 2 Gy and collected at the indicated time points after irradiation. Histone γH2AX and GRB2 expression were used as a marker of IR efficacy and as loading control, respectively. On the right, graphs report quantification of E2F1 (top panel) and γH2AX (bottom panel), expressed as fold increase over the NIR sample. (h) Luciferase activity of full-length and E2F1-Del miR-223 promoters, transfected in MDA-MB-231 irradiated with 2 Gy expressed as fold induction, with respect to normalized NIR cells. The Student's t-test or Mann–Whitney test have been used for statistical analysis, as appropriate. Asterisks indicate significant differences, *P⩽0.05; **P⩽0.01; ***P⩽0.001.
Figure 3
Figure 3
miR-223 controls EGF expression both in vivo and in vitro. (a) Schematic representation of the approach used to identify potential miR-223 targets in WF from control and IORT-treated BC patients. (b, c) ELISA quantification of EGF (b) and prolactin (c) in WF from patients subjected to surgery alone (n=27 for EGF, n=21 for prolactin) or surgery plus IORT (n=29 for EGF, n=21 for prolactin), as indicated. Statistical significance reported in figure was calculated using the Mann–Whitney unpaired t-test. Two-way ANOVA test confirmed the significant differences in EGF expression among groups (P=0.006). (d) Schematic representation of putative miR-223-binding sites in EGF mRNA. (e) On the left side, schematic representation of putative miR-223 seed regions of EGF cloned in their wild-type or mutated form in pGL3 control vector. Graph on the right reports the normalized luciferase activity of each construct in the presence of miR scrambled (black bar) or miR-223 (green bars), expressed as the ratio between miR-223- and miR-scrambled-transfected cells. Control indicates cells transfected with the empty pGL3 vector. Asterisks indicate significant differences respect to the control. (f) qRT–PCR analyses of basal miR-223 expression (black bars) or after transduction with miR-223 lentiviral vector (red bars) in MCF-10A and in the indicated tumor-derived cell lines. miR-223 expression was normalized using U6 levels. (g) ELISA quantification of EGF levels in conditioned media harvested from BC cell lines described in f. The Student's t-test or Mann–Whitney test have been used for statistical analysis, as appropriate. Asterisks indicate significant differences, *P⩽0.05; **P⩽0.01; ***P⩽0.001.
Figure 4
Figure 4
miR-223 controls growth of breast cancer cells, both in two- and three-dimensional (3D) context. (a) qRT–PCR of EGF expression in MDA-MB-231 cells, serum starved and then stimulated with wound fluids for the indicated times. Values were normalized using GAPDH expression and are expressed as fold increase over untreated (T0) cells. (b) Growth curve analysis of MCF-10A cell line stably transduced with control or miR-223 lentiviral vector, plated on day 0 and then counted every day for 5 days, by Trypan Blue exclusion test. (c) Soft agar assay quantification of BT-474 and MM-453 cells transduced with control or miR-223 lentiviral vector in the presence of 5% WF, allowed to grow for 15 days. (d) Colony number quantification of the indicated cell lines, included in 3D matrigel in presence of 5% WF and allowed to grow for 15 days. (e, f) Representative 3D reconstruction of confocal images of MCF-10A (e) or MCF-7 cells (f) transduced with control or miR-223 lentiviral vectors, included in 3D matrix as in d. (e) MCF-10A cells were stained with propidium iodide (PI) to visualize the nuclei (blue). EGFP expression (green) was used to identify the control or miR-223 transduced cells. (f) MCF-7 cells were stained for E-Cadherin (red) and nuclei (PI, blue). Data of all graphs represent the mean (±s.d.) of two/three independent experiments performed in duplicates. The Student's t-test or Mann–Whitney tests have been used for statistical analysis, as appropriate. *P⩽0.01.
Figure 5
Figure 5
Down modulation of miR-223 expression in HMEC increases EGF signaling and promotes deregulated 3D growth. (a) qRT–PCR of EGF in HMEC control-transfected (black bar) or stably overexpressing anti-miR-223 (red bar). Values were normalized using GAPDH expression and are expressed as fold increase over the expression level of control cells. (b) Western blot analysis of pY1068 EGFR and total EGFR expression in lysates from HMEC control or stably overexpressing anti-miR-223, serum starved and then stimulated with WF for the indicated times. Numbers below represent the quantification of pY1068 EGFR, expressed as fold increase over the control at T0. (c) Graph reports quantification of Ki67-positive cells/colony/field in control and anti-miR-223 transduced HMEC included in 3D matrix and allowed to grow for 7 days. Four and seven fields were scored for control and anti-miR-223 transduced HMEC, respectively. Representative images of 3D confocal reconstruction of HMEC cells are reported in Supplementary Figure 7c. (d) Growth curves of HMEC, control-transfected or stably overexpressing anti-miR-223, plated on day 0 and then counted every day for 7 days by Trypan Blue exclusion test. Data of all graphs represent the mean (±s.d.) of two independent experiments, performed in duplicates. (e) Growth in 3D matrigel of HMEC control-transfected or stably overexpressing anti-miR-223. On the left, representative contrast phase images of the colonies after 7 days of culture are shown. On the right, graph reports the quantification of the colony number in control-transfected and anti-miR-223 overexpressing cells. (f) Immunofluorescence analysis of pY1068 EGFR (green) in HMEC control or stably overexpressing anti-miR-223 as in e. WGA (red) was used to label cellular membrane. Graph in the middle shows the quantification of the pY1068 EGFR fluorescence intensity, normalized for WGA expression and reported as arbitrary units (A.U.). Graph on the right reports the quantification of the colony area in control and anti-miR-223 overexpressing cells. Each dot represents one colony. The Student's t-test or Mann–Whitney test have been used for statistical analysis, as appropriate. Asterisks indicate significant differences, *P⩽0.05; **P⩽0.01; ***P⩽0.001.
Figure 6
Figure 6
EGFR inhibitors impair wound-induced breast cancer cell growth. (a) Quantification of colony number/field of MDA-MB-231 cells, control-transfected or stably expressing miR-223, included in 3D matrigel in the presence of 5% WF with (blue bars) or without (black bars) 1 μm Gefitinib. Data represent the mean (±s.d.) of two experiments performed in duplicates. (b) MDA-MB-231 cells were included in 3D matrigel in the presence of 5% WF (black bar) plus 1 μm Gefitinib (blue bar), or 2.5 μm Lapatinib (red bar), as indicated. Data are expressed as percent of colonies grown in each condition, with respect to the control (only WF) and represent the mean (±s.d.) of two experiments performed in duplicates. (c) Western blot analysis of MDA-MB-231 cells stimulated with WF for the indicated times, with or without Lapatinib, as indicated. The expression of phosphorylated and total forms of EGFR, STAT3, p70S6K, the ribosomal protein S6, ERK and AKT is shown. Vinculin expression was used as loading control. (d) Quantification of pY1068 EGFR, pY705 STAT3, pS240/244 S6 and pT202/Y204 ERK levels in the indicated BC cell lines, stimulated with WF and treated or not treated with Lapatinib. Data represent the mean of three independent experiments and are expressed as fold increase of the indicated phospho-proteins, with respect to the T0 untreated condition. (e) Graph reports apoptotic rate of control (black bars) and miR-223 overexpressing (red bars) SK-BR-3 and MDA-MB-231 cells treated for 24 h with the indicated doses (μm) of Lapatinib, evaluated as activity of caspase 3/7. Data represent the mean of three independent experiments. (f) Evaluation of the IC50 of in the indicated control-transfected or miR-223 overexpressing BC cell lines, in the presence or absence of EGF (5 ng/ml). IC50 values were calculated by nonlinear regression using the GraphPad Prism software (La Jolla, CA, USA). In all graphs, *P⩽0.05; **P⩽0.01; ***P⩽0.001; ns, not significant; indicates a P⩾0.05.
Figure 7
Figure 7
Peri-surgical inhibition of EGFR prevents local recurrence of breast cancer. (a) Schematic representation of the experiment reported in b. Before being all injected with MDA-MB-231 cells, mice were randomized in four cohorts; one subjected to breast surgery and no radiotherapy (wound NIR), one subjected to breast surgery followed by radiotherapy (wound 5 Gy), one subjected only to radiotherapy (control 5 Gy) and one subjected neither to surgery nor to radiotherapy (control NIR). Tumor appearance and growth was then monitored over time. (b) Graph reports the volume of orthotopic xenografts, 13 days post injection of MDA-MB-231 cells, in the different cohorts described in a. Data represent the results from three independent experiments (n=5+5+6 in each cohort). The Mann–Whitney test has been used to calculate the significance. (c) Schematic representation of the experiment reported in d and e. miR-223+/− and miR-223−/− mice received IORT (5 Gy) with the Intrabeam device. Then all mice were injected with EO771E2 cells. Tumor appearance and growth was then monitored for 3 weeks. (d, e) Tumor take rate (d) and growth (e) in miR-223+/− and miR-223−/− mice, treated as described in c. (e) The tumor burden inhibition due to miR-223 expression (% TBI, green dashed line) is reported. Paired t-test has been used to calculate the significance. (f) Disease-free survival analysis of mice subjected to surgery to remove primary tumors (200–300 mm3) and then left untreated (n=8, black line) or treated peri-operatively (3 doses) with Lapatinib at 65 mg/kg (n=6 yellow line) 100 mg/kg (n=10 red line) and 150 mg/kg (n=10 green line). Data are reported as percentage of mice that did not developed recurrent disease during 7 weeks of post-surgery follow-up. Kaplan–Meier test has been used to calculate the significance. *P=0.04; **P=0.005. (g) Representative confocal images of pY1068 EGFR (green) and nuclei (blue) staining in tumors from mice treated with vehicle or Lapatinib (150 mg/kg) for 3 consecutive days, as evaluated by immunofluorescence analysis. On the right, graph reports the quantification of the mean pY1068 EGFR fluorescence intensity in control (n=3) and Lapatinib-treated (n=4) mice. For each tumor, at least three different fields were analyzed. Mean±s.d. and significance are shown.

References

    1. Dvorak HF. Tumors: wounds that do not heal. Similarities between tumor stroma generation and wound healing. N Engl J Med 1986; 315: 1650–1659. - PubMed
    1. Arwert EN, Hoste E, Watt FM. Epithelial stem cells, wound healing and cancer. Nat Rev Cancer 2012; 12: 170–180. - PubMed
    1. Baum M, Demicheli R, Hrushesky W, Retsky M. Does surgery unfavourably perturb the ‘natural history' of early breast cancer by accelerating the appearance of distant metastases? Eur J Cancer 2005; 41: 508–515. - PubMed
    1. Belletti B, Vaidya JS, D'Andrea S, Entschladen F, Roncadin M, Lovat F et al. Targeted intraoperative radiotherapy impairs the stimulation of breast cancer cell proliferation and invasion caused by surgical wounding. Clin Cancer Res 2008; 14: 1325–1332. - PubMed
    1. Demicheli R, Valagussa P, Bonadonna G. Does surgery modify growth kinetics of breast cancer micrometastases? Br J Cancer 2001; 85: 490–492. - PMC - PubMed

MeSH terms