. 2016 Sep 8;35(36):4741-51.
doi: 10.1038/onc.2016.5. Epub 2016 Feb 15.

Prolyl-isomerase Pin1 controls Notch3 protein expression and regulates T-ALL progression

Affiliations

Prolyl-isomerase Pin1 controls Notch3 protein expression and regulates T-ALL progression

G Franciosa et al. Oncogene. .

Abstract

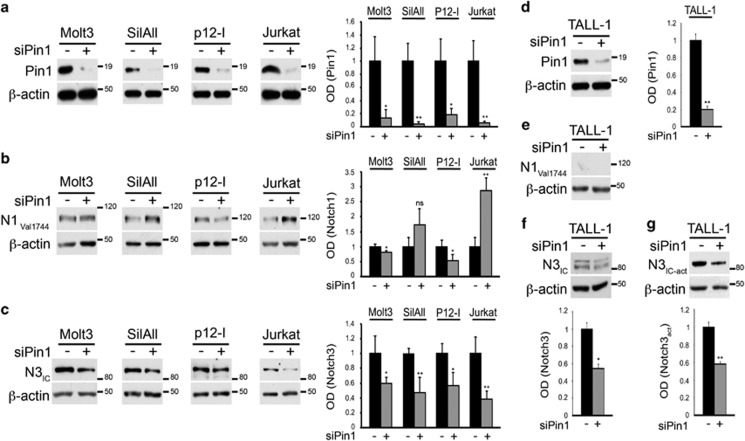
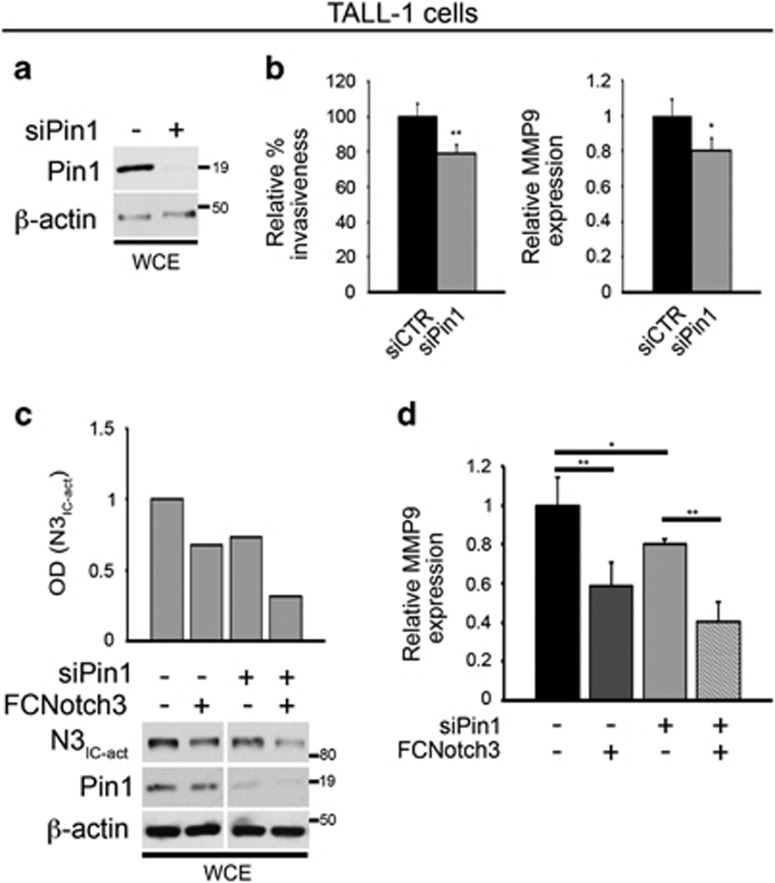
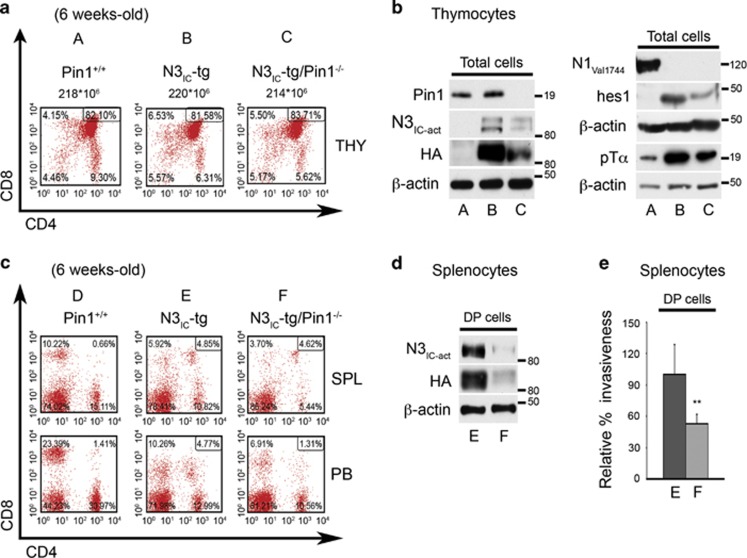
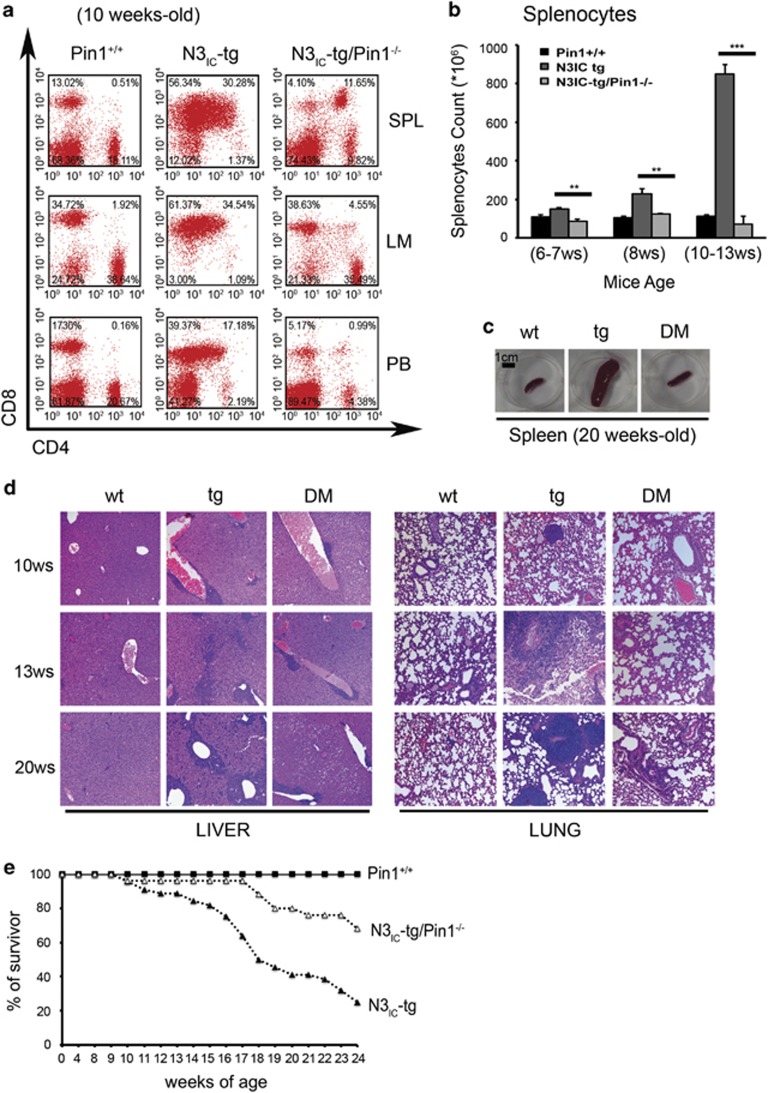
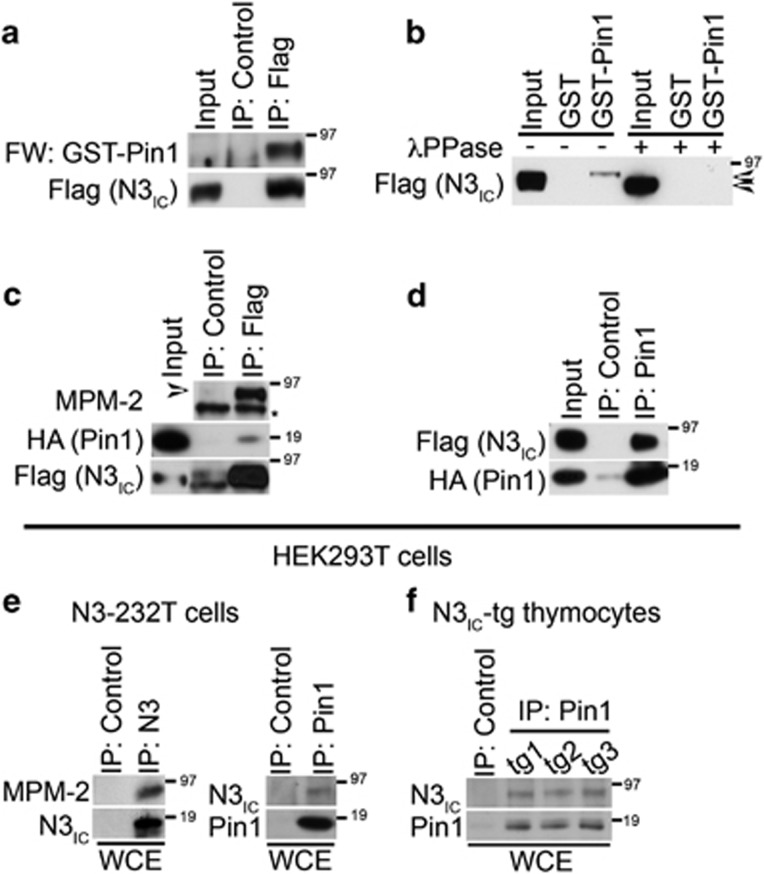
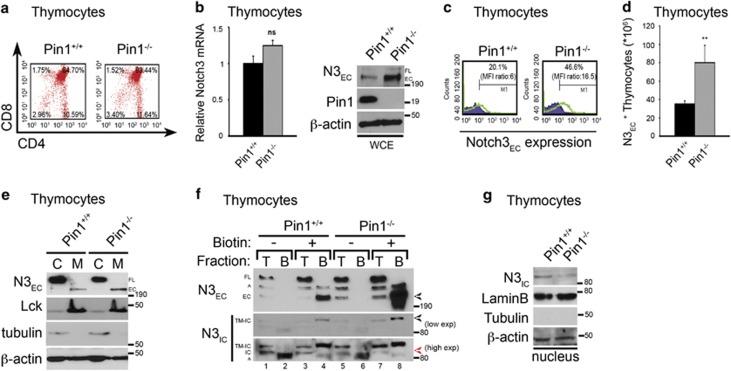
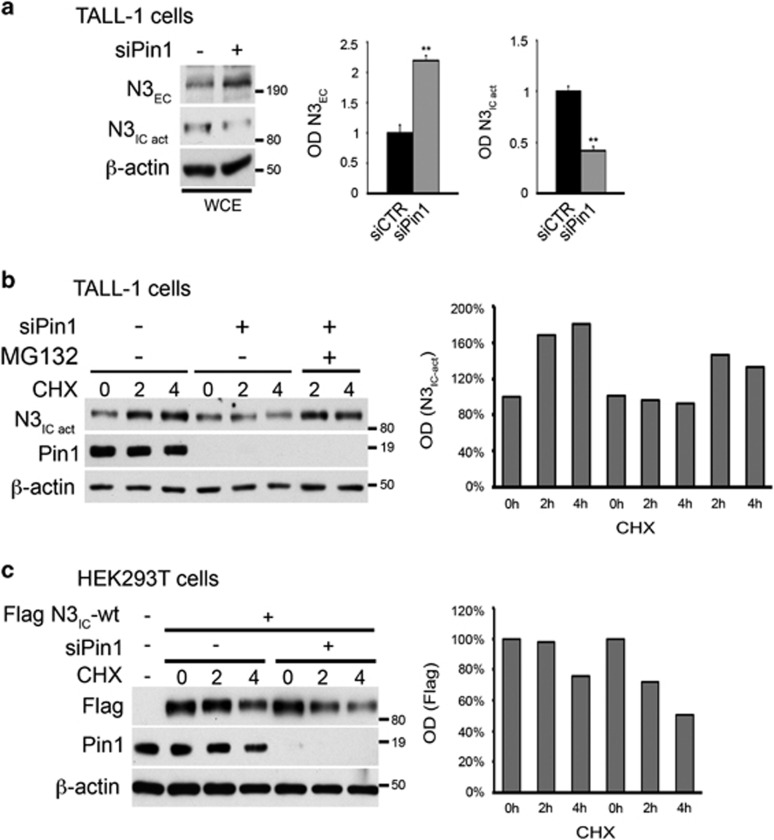
Deregulated Notch signaling is associated with T-cell Acute Lymphoblastic Leukemia (T-ALL) development and progression. Increasing evidence reveals that Notch pathway has an important role in the invasion ability of tumor cells, including leukemia, although the underlying molecular mechanisms remain mostly unclear. Here, we show that Notch3 is a novel target protein of the prolyl-isomerase Pin1, which is able to regulate Notch3 protein processing and to stabilize the cleaved product, leading to the increased expression of the intracellular domain (N3IC), finally enhancing Notch3-dependent invasiveness properties. We demonstrate that the combined inhibition of Notch3 and Pin1 in the Notch3-overexpressing human leukemic TALL-1 cells reduces their high invasive potential, by decreasing the expression of the matrix metalloprotease MMP9. Consistently, Pin1 depletion in a mouse model of Notch3-induced T-ALL, by reducing N3IC expression and signaling, impairs the expansion/invasiveness of CD4(+)CD8(+) DP cells in peripheral lymphoid and non-lymphoid organs. Notably, in in silico gene expression analysis of human T-ALL samples we observed a significant correlation between Pin1 and Notch3 expression levels, which may further suggest a key role of the newly identified Notch3-Pin1 axis in T-ALL aggressiveness and progression. Thus, combined suppression of Pin1 and Notch3 proteins may be exploited as an additional target therapy for T-ALL.


Figures

Figure 1
Figure 1
Pin1 silencing modulates the Notch3 protein expression in human T-ALL cell lines. Activated Notch1 (Notch1Val1744) and Notch3 (N3IC) expression in response to Pin1 silencing in (b, c) Notch1-activated (Molt3, SilAll, P12-Ichikawa and Jurkat) and (eg) Notch1-non activated/Notch3 activated (N3IC-act) overexpressing (TALL-1) human T-ALL cell lines. (a, d) Western blots against Pin1 show the efficiency of Pin1 silencing (siPin1) (left panels). Western blot against the anti-β-actin was used as a loading control. All the western blots in the figure are representative of at least three independent experiments, each in triplicate. In all right (ad) and lower (f, g) panels are shown the optical densitometry (OD) of Pin1 (a, d), Notch1 (b) and Notch3 (c, f, g) protein expression levels analyzed in all the experiments performed, thus including the P-values, calculated using Student's T-test (i.e., ns, not significant P>0.05; *P⩽0.05; **P⩽0.01).
Figure 2
Figure 2
Pin1 silencing influences the TALL-1 cells invasiveness by regulating N3IC protein expression. (a) Western blots against Pin1 show the efficiency of Pin1 silencing in TALL-1 cell line (siPin1). (b) TALL-1 cell line silenced or not for Pin1 was used in invasion Matrigel assay: relative percentage of invasiveness is shown with respect to the negative control, siCTR (left panel). RT–PCRs show downmodulation of MMP9 mRNA expression in Pin1-silenced cells (siPin1) with respect to the control cells (siCTR) (right panel). (c) Western blots against activated-N3IC protein (N3IC-act) and Pin1 show the efficiency of the Notch3 receptor block and Pin1 silencing, respectively (lower panels). Optical densitometry (OD) of the activated-N3IC protein expression (upper panel). (d) RT–PCRs show downmodulation of MMP9 mRNA expression in Notch3-blocked Pin1-silenced cells (siPin1+FCNotch3) with respect to both Notch3-blocked or Pin1-silenced controls alone. In both panels (a) and (c), western blot against the anti-β-actin was used as a loading control. All the results shown in the figure are expressed as the means average deviations of three separate experiments, each in triplicate, and P-values were calculated using Student's T-test (i.e., ns, not significant P>0.05; *P⩽0.05; **P⩽0.01). WCEs, whole-cell extracts.
Figure 3
Figure 3
Pin1 ablation impairs Notch3 signaling in thymocytes of young N3IC transgenic mice resulting in the decrease of expansion/invasiveness of CD4+CD8+ DP splenic cells. CD4+ and/or CD8+ subset distribution of thymocytes from representative 6-week-old Pin1+/+ (A), N3IC-tg (B) and N3IC-tg/Pin1−/− (C) mice. (b) Whole-cell extracts from thymocytes illustrated in (a) were revealed with anti-Pin1, anti-activated N3IC (N3IC-act), anti-HA (left panels) and anti-activated Notch1 (Notch1Val1744), anti-Hes1 and anti-pTα (right panels) antibodies. Western blot against the anti-β-actin was used as a loading control. (c) CD4+ and/or CD8+ subset distribution of lymphocytes derived from SPL and blood of representative 6-week-old Pin1+/+ (D), N3IC-tg (E) and N3IC-tg/Pin1−/− (F) mice. (d) Sorted CD4+CD8+ (DP) splenocytes illustrated in (c) (circle around the number) were used for western blot analysis against anti-activated N3IC (N3IC-act), anti-HA and anti-β-actin antibodies and (e) in invasion Matrigel assay: relative percentage of DP cells invasiveness from N3IC-tg/Pin1−/− mice is shown with respect to N3IC-tg cells. Results are shown as the means average deviations of five independent experiments (n=3–5 mice per group) and P-values were calculated using Student's T-test (i.e., **P⩽0.01). In all panels described in (a, c), numbers inside each cytogram indicate the percentages of the corresponding subsets and the results are representative of five independent experiments (n=3–5 mice per group: Pin1+/+ (n=15), N3IC-tg (n=25) and N3IC-tg/Pin1−/− mice (n=15)). THY, thymus. SPL, Spleen; PB, Peripheral Blood.
Figure 4
Figure 4
Pin1-induced N3IC downregulation prevents T-ALL development and progression in N3IC transgenic mice. (a) CD4+ and/or CD8+ subset distribution of lymphocytes derived from SPL, PB and mesenteric lymph nodes (LM) of representative 10-week-old Pin1+/+, N3IC-tg and N3IC-tg/Pin1−/− mice. In all panels, numbers inside each cytogram indicate the percentages of the corresponding subsets and the results are representative of three independent experiments (n=3–5 mice/group: Pin1+/+ (n=9), N3IC-tg (n=15) and N3IC-tg/Pin1−/− mice (n=12)). (b) Splenocytes count from Pin1+/+, N3IC-tg and N3IC-tg/Pin1−/− mice at the age indicated. Values represent the means average deviations of 3–5 mice for each genetic background and P-values were calculated using Student's T-test (i.e., **P⩽0.01; ***P⩽0.001). (c) Macroscopic aspect of SPL isolated from 20-week-old Pin1+/+ (wt), N3IC-tg (tg) and double mutant N3IC-tg/Pin1−/− (DM) mice. (d) Histological analysis of non-lymphoid organs (liver, upper and lung, down) from representative Pin1+/+ (wt), N3IC-tg (tg) and N3IC-tg/Pin1−/− (DM) mice at the age indicated. Hematoxylin and Eosin staining, original magnification × 10. (e) Mortality curve of Pin1+/+, N3IC-tg and N3IC-tg/Pin1−/− mice. The numbers of spontaneously dead mice were plotted against their age. Results are indicated as the percentage of surviving mice at each age. The follow-up of mice was stopped at 24 weeks, being 75% of the N3IC-tg mice dead at this age and 70% of N3IC-tg/Pin1−/− mice survivor (n=50 for Pin1+/+; n=60 for N3IC-tg n=30 for N3IC-tg/Pin1−/− mice).
Figure 5
Figure 5
Pin1 directly interacts with Notch3. (a) Control or anti-Flag antibody immunoprecipitates from HEK293T cells transfected with Flag N3IC-wt were subjected to far western blotting using purified GST–Pin1 as a probe, followed by anti-Pin1 immunoblotting. Anti-Flag western blot analysis of the upper panel after stripping is shown. (b) Lysates used in (a), previous treated with lamba phosphatase (+), were subjected to GST or GST–Pin1 pulldown followed by anti-Flag western blotting. The arrows indicate the phosphorylated (upper band) and the non-phosphorylated (lower band) forms. (c) Control or anti-Flag antibody immunoprecipitates from HEK293T cells co-transfected with Flag N3IC-wt and HA-Pin1 plasmids were subjected to western blot and probes with anti-MPM-2, to detect the Notch3 phosphorylation levels at Ser/Thr-Pro sites, followed by stripping and anti-Flag western analysis to show N3IC immunoprecipitated protein levels. The blot with anti-HA antibody was used to reveal the Notch3-Pin1 binding (middle panel). The * indicates a non-specific band. (d) Control or anti-Pin1 antibody immunoprecipitates from the same cells used in (c) were probes with anti-Flag, to detect the Notch3-Pin1 binding, and with the anti-HA antibody to show Pin1 immunoprecipitated protein levels. (e) Anti-Notch3 (left panel) and anti-Pin1 (right panel) immunoprecipitates from N3–232 T cells were subjected to western blot and probes with anti-MPM2 antibody, to detect the Notch3 phosphorylation levels at Ser/Thr-Pro sites, and anti-N3IC antibody to detect endogenous Notch3–Pin1 interaction, respectively. In both panels (e), the blots with anti-N3IC and anti-Pin1 antibodies were used to show Notch3 and Pin1 immunoprecipitated protein levels, respectively. (f) Anti-Pin1 immunoprecipitates from N3IC-tg thymocytes were subjected to western blot and probes with anti-N3IC and anti-Pin1 antibodies, to detect endogenous Notch3–Pin1 interaction and Pin1 immunoprecipitated protein levels, respectively. The input lane indicated in all the western blot of (ad) shows 5% of total lysate. All data are representative of at least three independent experiments, each in triplicate. WCEs, whole-cell extracts.
Figure 6
Figure 6
Pin1 affects Notch3 processing. (a) CD4+ and/or CD8+ subset distribution of thymocytes from Pin1+/+ and Pin1−/− mice. In both panels, numbers inside each cytogram indicate the percentages of the corresponding subsets. (b) RT–PCR shows the unchanged relative Notch3 mRNA levels in Pin1−/− vs Pin1+/+ thymocytes (left panel). (Right panel) Western blot analysis of whole-cell extracts (WCEs) from the same thymocytes probed with anti-Notch3EC (N3EC) and anti-Pin1 antibodies. The β-actin expression was used as a loading control. (c) Notch3 extracellular expression (N3EC) from thymocytes of Pin1+/+ and Pin1−/− mice indicated as percentages inside each cytogram. The violet curve represents the isotypic control. The mean fluorescence intensity (MFI) ratio between Notch3 and isotypic control staining is also indicated. The results showed in both panels are representative of five independent experiments (n=5 mice for group). (d) Bar graphs represent the absolute cell number from thymocytes expressing N3EC of the same mice indicated in (c). (e) Cytosolic (C) and membrane (M) fractions from Pin1+/+ and Pin1−/− thymocytes were analyzed in immunoblot assays to detect the N3EC expression. Anti-Lck and anti-α-tubulin were used as fraction markers; anti-β-actin was used as a loading control. (f) Thymocytes from Pin1+/+ and Pin1−/− mice were incubated with EZ-Link Sulfo-NHS-SS-Biotin (+) or were mock (−) treated, as described in Materials and methods. Cells were lysed and extracts were loaded on a 6% SDS–PAGE gel either directly (T fraction, 15% of the extract) or after incubation on streptavidin-agarose beads (B fraction, 85% of the extract). Extracts were then immunoblotted with the anti-N3EC and anti-N3IC antibodies. Positions of the 210-kDa Notch3 extracellular (EC) and 97-kDa Notch3 transmembrane-intracellular (TM-IC) domains are indicated by black arrows. In the high exposition is indicated the position of the Notch3 intracellular domain (IC) (red arrow). ^ indicates non-specific bands. (g) Nuclear fractions from Pin1+/+ and Pin1−/− thymocytes were analyzed in immunoblot assays to detect the N3IC expression. Anti-LaminB and anti-α-tubulin were used as fraction markers; anti-β-actin was used as a loading control. In all panels (b) and (d), results are shown as the means average deviations of five separate experiments and P-values were calculated using Student's T-test (i.e., ns, not significant P>0.05; **P⩽0.01). In all the western blots represented in the figure, FL indicates Notch3 full-length receptor and EC indicates extracellular region.
Figure 7
Figure 7
Pin1 influences Notch3 processing and stability in endogenous and exogenous system. (a) Western blot analysis of Notch3 extracellular (N3EC) and activated intracellular (N3IC-act) protein expression of whole-cell extract (WCE) derived from Pin1-silenced TALL-1 (+) vs control cells (−) (left panel). The western blots in the figure are representative of at least three independent experiments, each in triplicate. The optical densitometry (OD) (right panels) was analyzed in all the experiments performed, thus including the P-values, calculated using Student's T-test (i.e., **P⩽0.01). (b) WCEs from Pin1-silenced TALL-1 cells (+) vs control cells (−) in a time course assay with 10 μg/ml of cycloheximide (CHX), in the presence or absence of the proteasome inhibitor MG132 for the same times before lysis, were revealed by immunoblotting with anti-activated N3IC (N3IC-act), anti-Pin1 and anti-β-actin antibodies (left panel). The right panel shows the relative quantification of activated-N3IC as determined by OD. (c) Left panel, Western blot analysis of whole-cell extracts from HEK293T cells transfected with Flag N3IC-wt plasmid and silenced for Pin1 (+) or control (−) in a time course assay with 10 μg/ml of cycloheximide (CHX). Extracts were immunoblotted with anti-Flag, anti-Pin1 and anti-β-actin antibodies. The right panel shows the relative quantification of Flag N3IC as determined by OD. All data are representative of at least three independent experiments, each in triplicate.

Similar articles

Cited by

References

    1. Artavanis-Tsakonas S, Rand MD, Lake RJ. Notch signaling: cell fate control and signal integration in development. Science 1999; 284: 770–776. - PubMed
    1. Louvi A, Artavanis-Tsakonas S. Notch and disease: a growing field. Semin Cell Dev Biol 2012; 23: 473–480. - PMC - PubMed
    1. Screpanti I, Bellavia D, Campese AF, Frati L, Gulino A. Notch a unifying target in T-cell acute lymphoblastic leukemia? Trends Mol Med 2003; 9: 30–35. - PubMed
    1. Grabher C, von Boehmer H, Look AT. Notch 1 activation in the molecular pathogenesis of T-cell acute lymphoblastic leukaemia. Nat Rev Cancer 2006; 6: 347–359. - PubMed
    1. Pear WS, Aster JC, Scott ML, Hasserjian RP, Soffer B, Sklar J et al. Exclusive development of T cell neoplasms in mice transplanted with bone marrow expressing activated Notch alleles. J Exp Med 1996; 183: 2283–2291. - PMC - PubMed

Publication types

MeSH terms

Substances