. 2016 Feb 15:7:10711.
doi: 10.1038/ncomms10711.

The histone variant H2A.X is a regulator of the epithelial-mesenchymal transition

Affiliations

The histone variant H2A.X is a regulator of the epithelial-mesenchymal transition

Urbain Weyemi et al. Nat Commun. .

Abstract

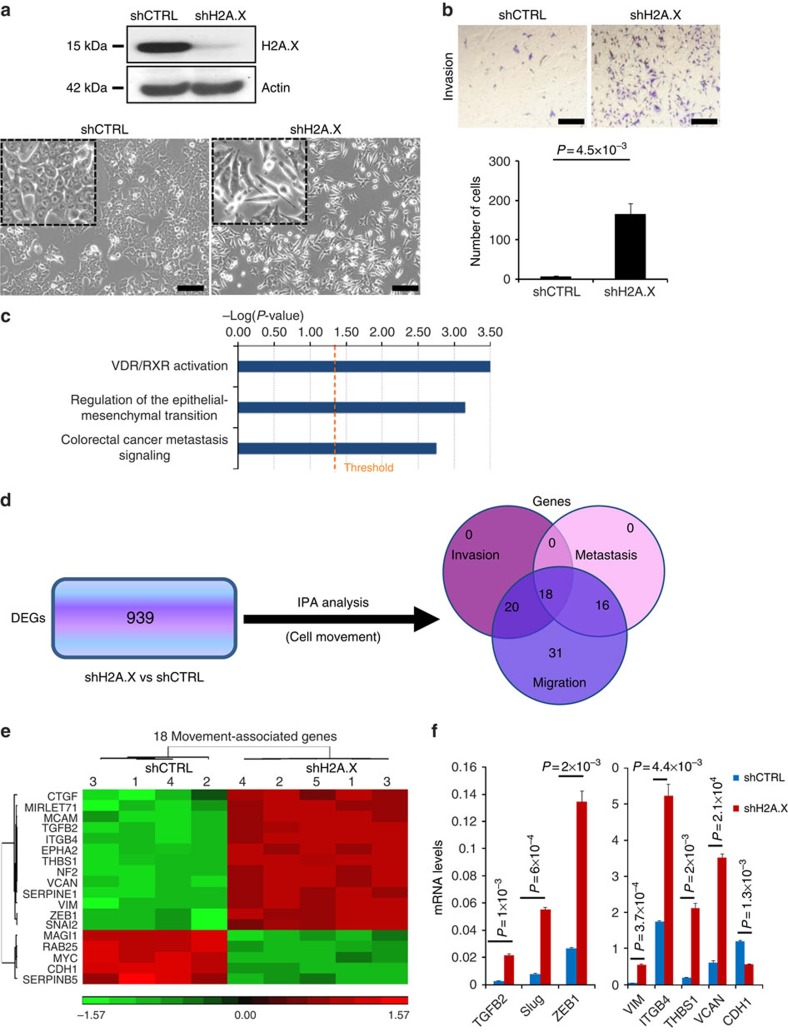
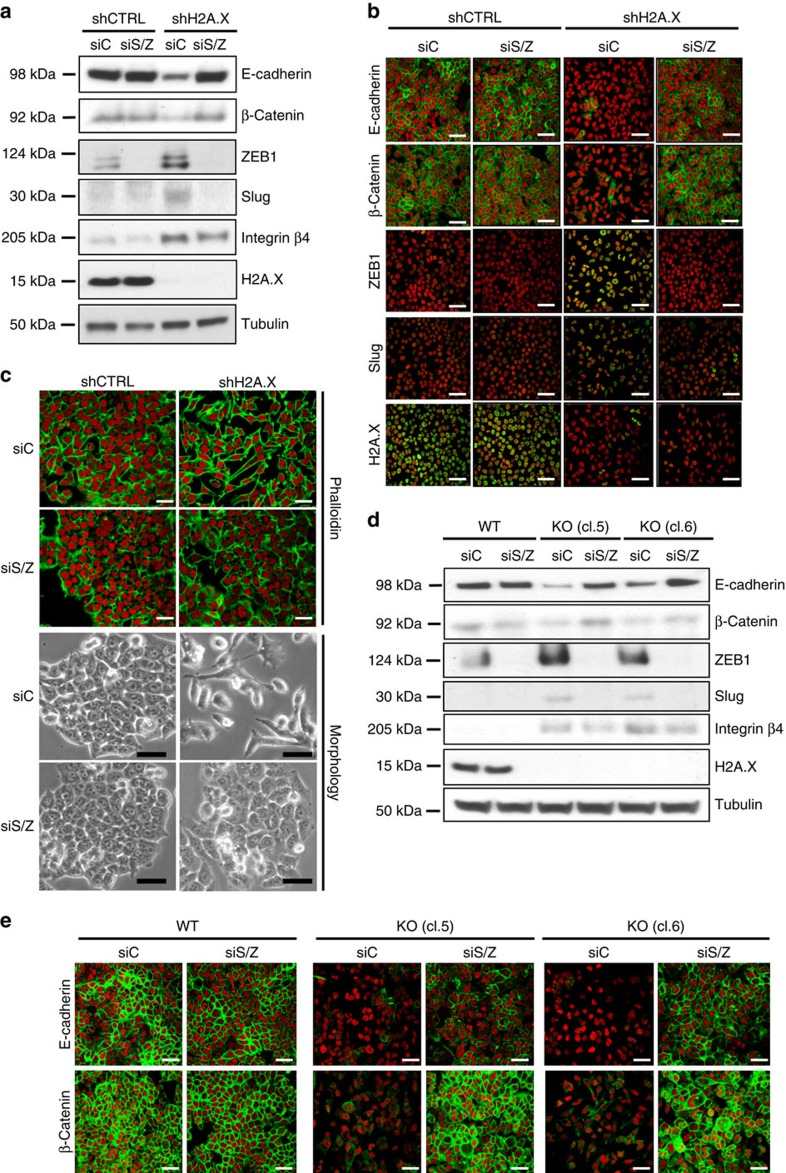
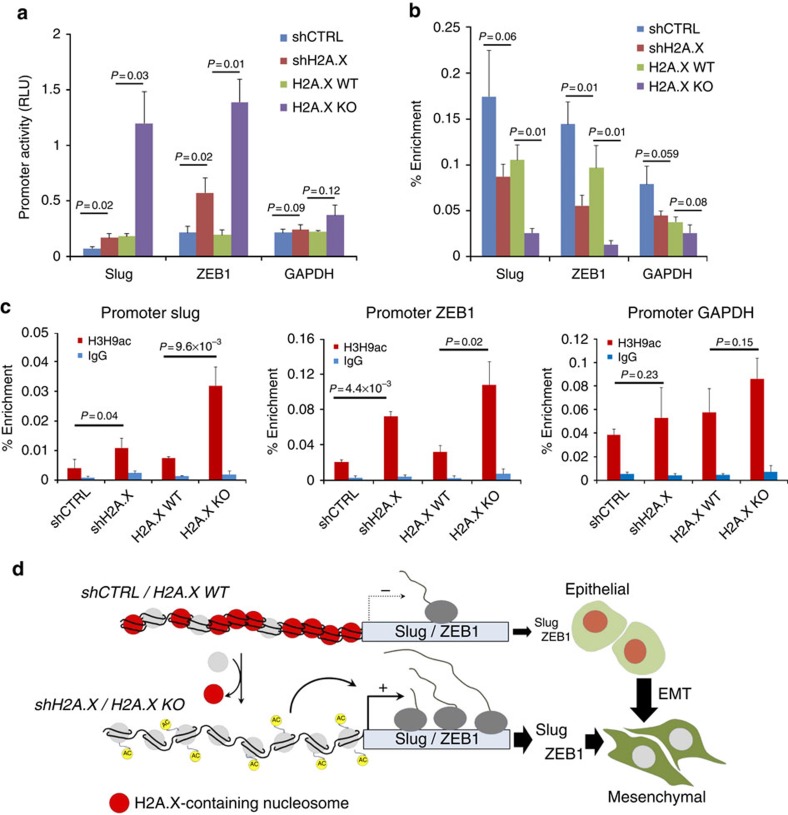
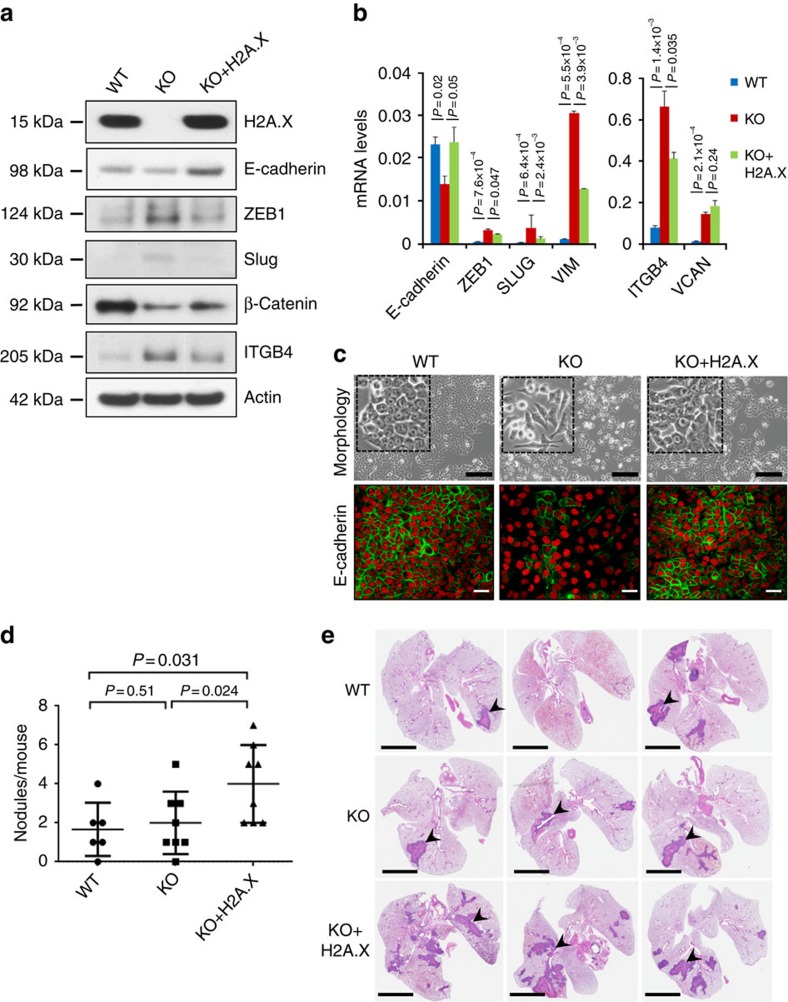
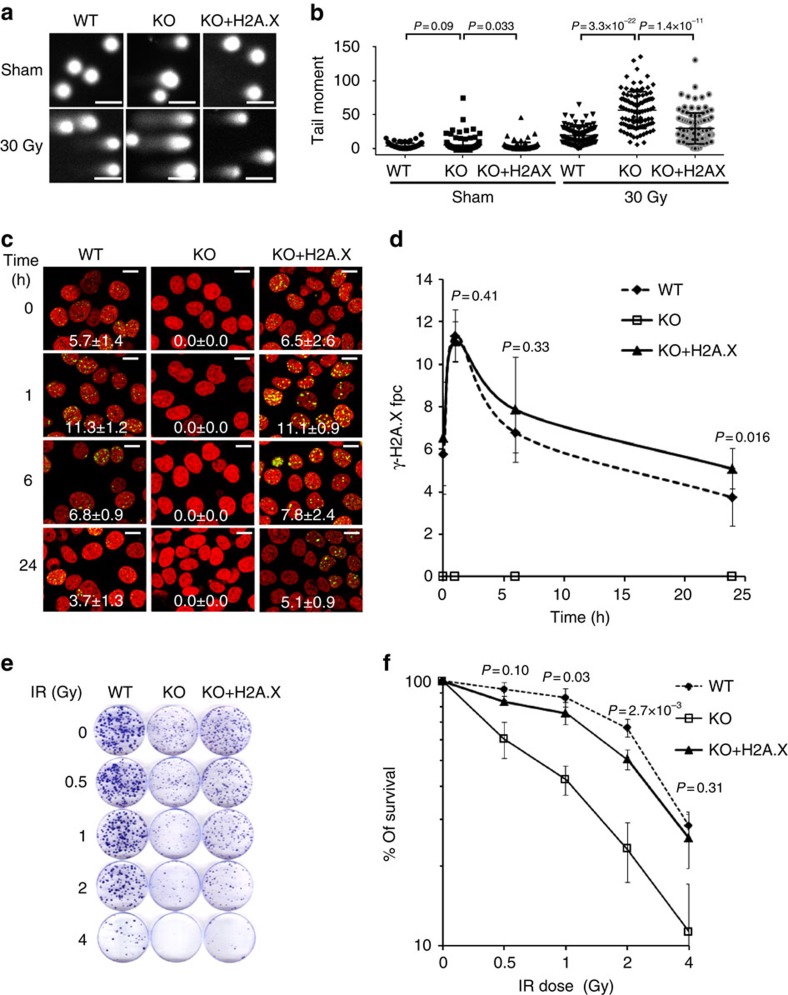
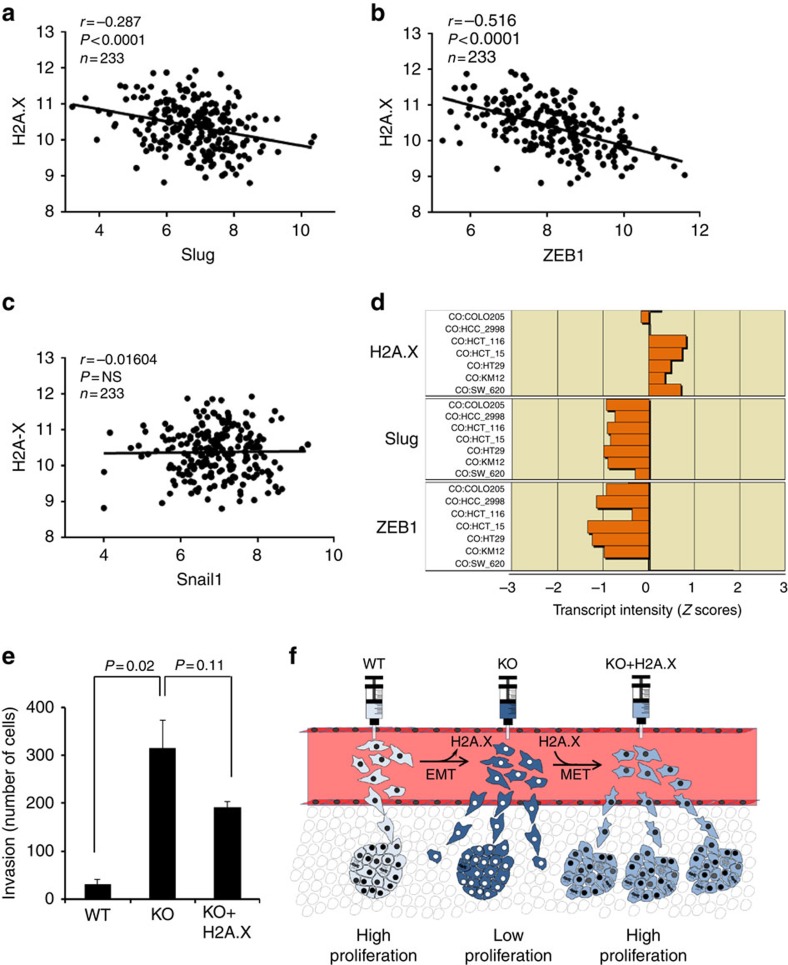
The epithelial-mesenchymal transition (EMT), considered essential for metastatic cancer, has been a focus of much research, but important questions remain. Here, we show that silencing or removing H2A.X, a histone H2A variant involved in cellular DNA repair and robust growth, induces mesenchymal-like characteristics including activation of EMT transcription factors, Slug and ZEB1, in HCT116 human colon cancer cells. Ectopic H2A.X re-expression partially reverses these changes, as does silencing Slug and ZEB1. In an experimental metastasis model, the HCT116 parental and H2A.X-null cells exhibit a similar metastatic behaviour, but the cells with re-expressed H2A.X are substantially more metastatic. We surmise that H2A.X re-expression leads to partial EMT reversal and increases robustness in the HCT116 cells, permitting them to both form tumours and to metastasize. In a human adenocarcinoma panel, H2A.X levels correlate inversely with Slug and ZEB1 levels. Together, these results point to H2A.X as a regulator of EMT.


Figures

Figure 1
Figure 1. H2A.X is a key player in the regulation of EMT and in colon cancer metastasis signalling.
HCT116 cells were infected with shRNAs against H2A.X (shH2A.X) or scrambled sequences (shCTRL). (a,b) Compared with controls, shH2A.X-infected HCT116 cells exhibited decreased H2A.X protein levels (a, top, immunoblot), mesenchymal-like morphology (a, bottom, photomicrographs, scale bar, 100 μm) and increased invasion in transwell invasion assays (b, top, photomicrograph, scale bar, 100 μm; bottom, quantification). Error bars represent the means±s.d. of three independent experiments. Statistical significance was determined by a two-tailed, unpaired Student's t-test. (c) Ingenuity Pathway Analysis (IPA) revealed differentially expressed genes (DEGs) in three canonical pathways. Blue bars represent the top three canonical pathways overrepresented in the DEGs. The height of the bar represents the P value. The yellow line indicates the −log (P value) threshold of significance (1.3), which corresponds to P value of 0.05. Statistical significance was determined by Fisher's test. (d) Venn diagram of DEGs assigned to the invasion, migration and metastasis pathways using IPA. DEGs were generated using Partek Genomics Suite software, version 6.6. (e) Heat map of the 18 DEGs common to the invasion, migration and metastasis pathways. The numbering refers to independent replicates for either shCTRL sample or shH2A.X sample. (f) Verification of differential expression of genes by real-time PCR). Expression values are relative fold change for gene transcripts normalized to 18S RNA (gene/18S ratio). Error bars represent s.d. (n=3). Statistical significance was determined by a two-tailed, unpaired Student's t-test.
Figure 2
Figure 2. Downregulation of the transcription factors Slug and ZEB1 reverses the EMT programme induced by H2A.X deficiency.
(a) Control cells (shCTRL) and cells silenced for H2A.X (shH2A.X) were transfected for 3 days with control siRNA (siC) or with a pool of siSLUG and siZEB1 (siS/Z). Immunoblot analysis of EMT markers was performed using tubulin as loading control. (b) Staining of E-cadherin and β-catenin by immunofluorescence in HCT116 control cells (shCTRL) and H2A.X-deficient cells (shH2A.X) transfected for 3 days with control siRNA (siC) or a pool of siRNAs against SLUG and ZEB1 (siS/Z). Nuclei were counterstained with propidium iodide (red); scale bars, 20 μm. (c) Top panel, analysis of cell phenotypic changes through the staining of F-actin (phalloidin) by immunofluorescence using conditions described in b; scale bars, 20 μm. Bottom panel, photomicrographs of cells; scale bar, 100 μm.(d) Immunoblot analysis of EMT markers in HCT116 parental cells (WT) and H2A.X knockout cells (KO) transfected for 3 days with siRNA control (siC) or with a pool of siSLUG and siZEB1 (siS/Z) with tubulin-loading controls. H2A.X knockout cells were generated using CRISPR/Cas9 system for precise deletion of the H2A.X gene. cl.5, clone #5; and cl.6, clone #6. (e) Immunofluorescence assays showing E-cadherin and β-catenin staining. Cells were treated as in d. Nuclei were counterstained in red with propidium iodide; scale bars, 20 μm.
Figure 3
Figure 3. H2A.X removal from HCT116 cells leads to enhanced transcriptional activity of Slug and ZEB1.
(a) H2A.X depletion enhanced the promoter activity of Slug and ZEB1, but not GAPDH. Slug, ZEB1 and GAPDH promoter activities were accessed by luciferase reporter assay in control cells (shCTRL), in cells silenced for H2A.X (shH2A.X), in parental cells (H2A.X WT) and in H2A.X knockout cells (H2A.X KO). Error bars represent the s.e.m. (n=3). Statistical significance was determined by a two-tailed, unpaired Student's t-test. (b) H2A.X binding to Slug and ZEB1 promoter using chromatin immunoprecipitation (ChIP) assay. Chromatin from control cells (shCTRL) and cells silenced for H2A.X (shH2A.X) or parental cells (H2A.X WT) and H2A.X knockout cells (H2A.X KO) was immunoprecipitated with anti-H2A.X antibody. The purified DNA was analysed by real-time PCR using primers amplifying across Slug, ZEB1 and GAPDH promoters. Results are presented as percentage of total input DNA precipitated. GAPDH promoter serves as an internal control. Error bars represent the s.e.m. (n=3). Statistical significance was determined by a two-tailed, unpaired Student's t-test (c) H2A.X deletion enhances the enrichment of H3K9ac to Slug and ZEB1 promoters. Cells used in b were processed for ChIP using anti-H3K9ac antibody. GAPDH promoter serves as an internal control. Error bars represent the s.e.m. (n=3). Statistical significance was determined by a two-tailed, unpaired Student's t-test. (d) Hypothetical model for the role of H2A.X in the transcriptional regulation of Slug and ZEB1 during EMT in colon cancer cells. H2A.X removal from the nucleosome leads to enhanced enrichment of active chromatin marks (H3K9ac) within the promoters of Slug and ZEB1. This chromatin configuration enables the transcriptional activation of Slug and ZEB1. Elevated levels of Slug and ZEB1 are key in mediating the expression of several EMT-related genes.
Figure 4
Figure 4. H2A.X re-expression inhibits EMT and promotes metastatic colonization in the lung.
(a) Immunoblot analysis of EMT markers in HCT116 parental cells (WT), H2A.X knockout cells (KO) and H2A.X knockout cells in which H2A.X expression was restored (KO+H2A.X), utilizing actin as a loading control. (b) HCT116 parental cells (WT), H2A.X knockout cells (KO) and revertant cells (KO+H2A.X) were analysed for transcripts levels of EMT markers by real-time PCR. Expression values for E-cadherin (CDH1), ZEB1, Slug, Vimentin (VIM), integrin beta 4 (ITGB4) and versican (VCAN) were normalized to 18S RNA (gene/18S ratio). Error bars represent the s.e. (n=3). Statistical significance was determined by a two-tailed, unpaired Student's t-test. The experiments were repeated three times. (c). Immunostaining of the epithelial marker E-cadherin. Nuclei were counterstained in red with propidium iodide; scale bars, 20 μm. Photomicrographs of cells are shown (top panel); scale bar, 100 μm. (d) Tail vein injections of HCT116 parental cells (WT) and H2A.X knockout cells (KO) showed similar numbers of lung metastatic foci 4 weeks post injection. Ectopic expression of H2A.X (KO+H2A.X) resulted in a 2.5-fold increase in lung macroscopic metastases. (e) Representative haematoxylin- and eosin-stained lung sections from mice injected with HCT116 parental cells (WT), H2A.X knockout cells (KO) and H2A.X knockout cells in which H2A.X expression was restored (KO+H2A.X). Black arrows indicate some macroscopic lung nodules. Scale bars, 1 mm. Statistical significance was determined by a two-tailed, unpaired Student's t-test.
Figure 5
Figure 5. Ectopic expression of H2A.X enables efficient DNA repair and protects cells from genotoxic stress.
(a,b) Alkaline comet assay of HCT116 parental cells (WT), H2A.X knockout cells (KO) and revertant cells (KO+H2A.X) 3 h after exposure to 30 Gy of ionizing radiation. (a) Representative images, scale bars, 100 μm; (b) Quantification of comet tail moments. Brackets indicate significance of differences. Error bars represent the s.e.m. (n=50). Statistical significance was determined by a two-tailed, unpaired Student's t-test.(c,d) HCT116 cell cultures (WT, KO and KO+H2A.X) were exposed to 1 Gy of ionizing radiation. DNA damage levels were analysed by counting γ-H2A.X foci (green) in nuclei counterstained for DNA (red). Scale bars, 20 μm. Statistical significance was determined by a two-tailed, unpaired Student's t-test. The experiments were repeated three times. (c) Representative images, × 40 magnification (d) Quantification of γ-H2A.X foci per cell. Data are means±s.d.; n=3. Fpc is foci per cell. Statistical significance was determined by a two-tailed, unpaired Student's t-test. (e,f) HCT116 cell cultures (WT, KO and KO+H2A.X) were exposed to increasing doses of ionizing radiation, and incubated at 37 °C for 15 days. Colonies stained with Coomassie blue were counted for survival estimation. (e) Representative images. (f) Colony survival. Data are means±s.d.; n=3. Statistical significance was determined by a two-tailed, unpaired Student's t-test.
Figure 6
Figure 6. H2A.X expression is correlated with that of the EMT-inducing transcription factors Slug and ZEB1 in human adenocarcinoma.
(ac) Statistically significant correlation between transcript levels for H2A.X and Slug (a) or ZEB1 (b) in 233 adenocarcinoma samples in the TCGA COAD data set. No significant correlation was found between the level of H2A.X and SNAI1 (c) in the same data set. The P values were calculated using the non-parametric Mann–Whitney t-test. The Log 2 expression level is shown for the indicated genes. (d) Inverse correlation between the transcript levels of H2A.X (top) and Slug (middle) or ZEB1 (bottom) in the colon cancer subpanel of the NCI60. The Z score represents the transcript expression in standard deviation units relative to the gene-specific mean expression level. (e) Invasion rate in parental cells (WT), H2A.X knockout cells (KO) and revertant cells (KO+H2A.X). Data are means±s.d.; n=3. Statistical significance was determined by a two-tailed, unpaired Student's t-test. (f) Hypothetical model for the role of H2A.X in EMT and metastatic colonization.

References

    1. Tam W. L. & Weinberg R. A. The epigenetics of epithelial-mesenchymal plasticity in cancer. Nat. Med. 19, 1438–1449 (2013). - PMC - PubMed
    1. Tsai J. H. & Yang J. Epithelial-mesenchymal plasticity in carcinoma metastasis. Genes Dev. 27, 2192–2206 (2013). - PMC - PubMed
    1. Lamouille S., Xu J. & Derynck R. Molecular mechanisms of epithelial-mesenchymal transition. Nat. Rev. Mol. Cell Biol. 15, 178–196 (2014). - PMC - PubMed
    1. Thiery J. P., Acloque H., Huang R. Y. & Nieto M. A. Epithelial-mesenchymal transitions in development and disease. Cell 139, 871–890 (2009). - PubMed
    1. Yao D., Dai C. & Peng S. Mechanism of the mesenchymal-epithelial transition and its relationship with metastatic tumor formation. Mol. Cancer Res. 9, 1608–1620 (2011). - PubMed

Publication types

MeSH terms