. 2016 Feb 15:6:20970.
doi: 10.1038/srep20970.

Critical assessment and ramifications of a purported marine trophic cascade

Affiliations

Critical assessment and ramifications of a purported marine trophic cascade

R Dean Grubbs et al. Sci Rep. .

Abstract

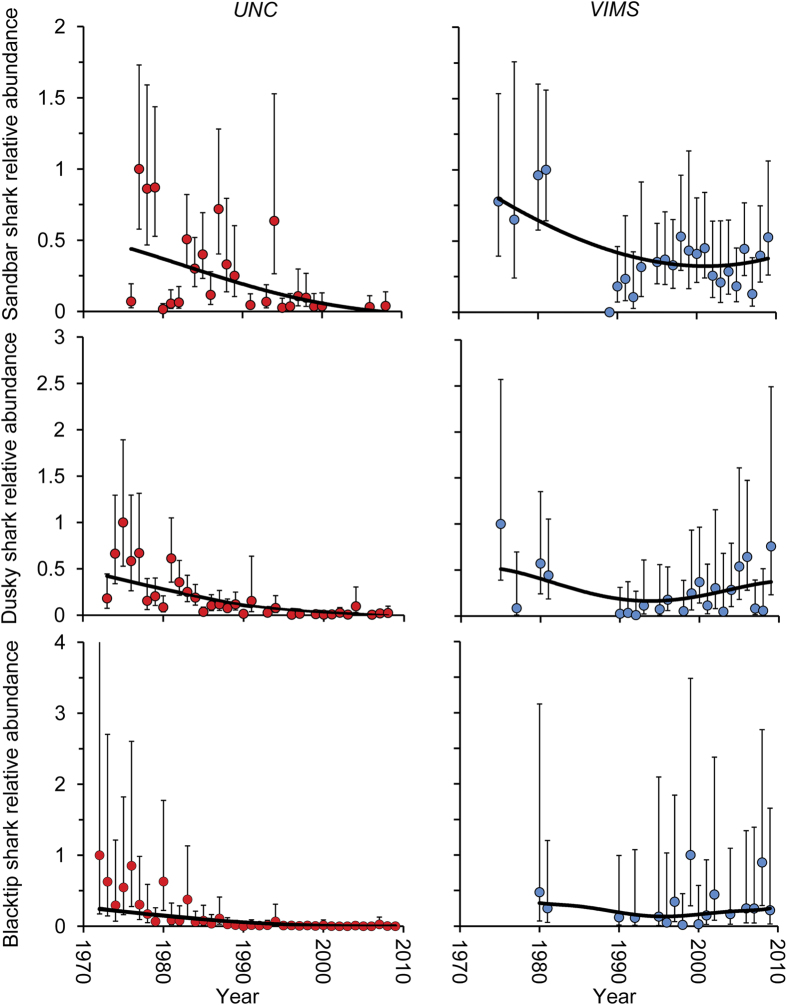
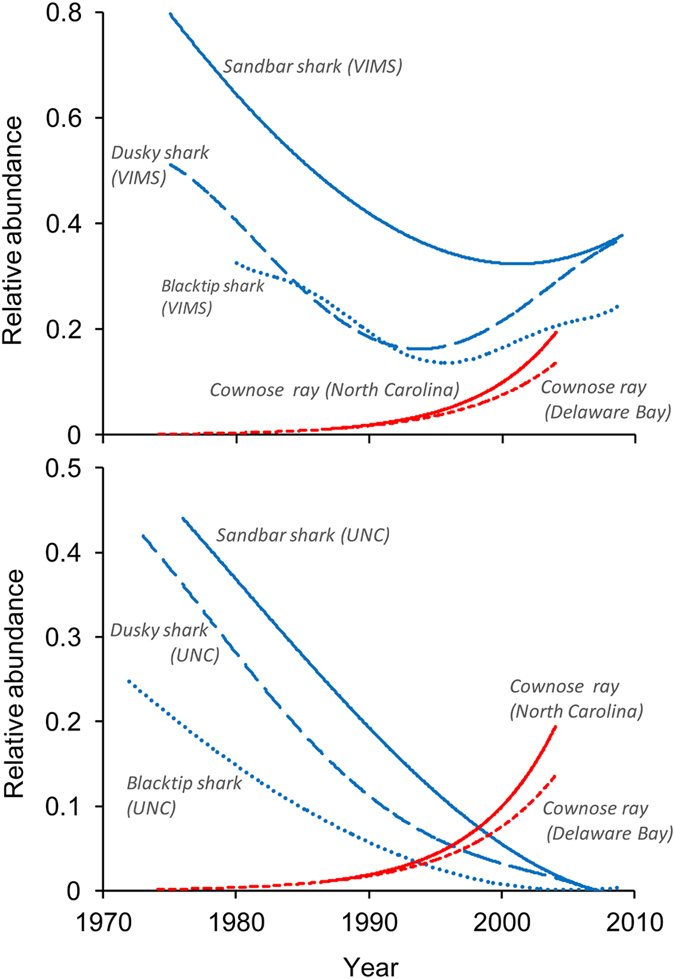
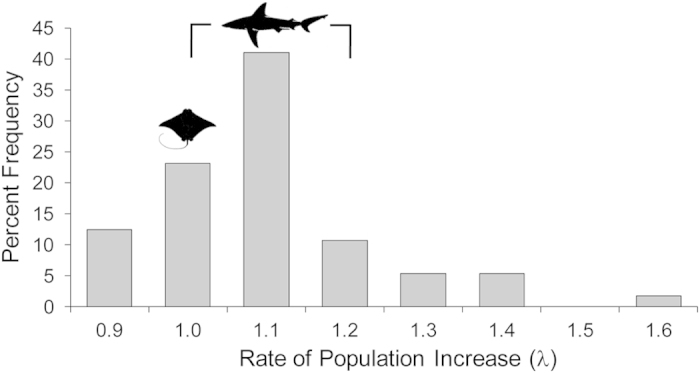
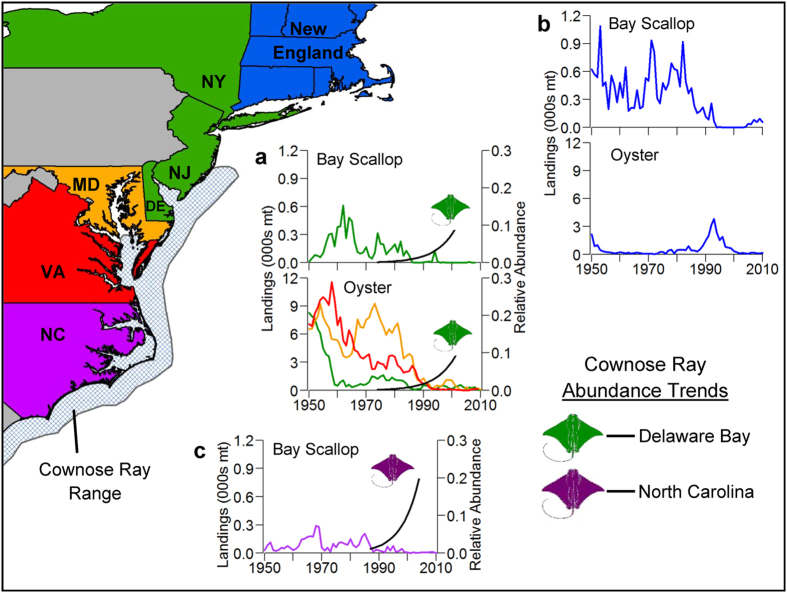
When identifying potential trophic cascades, it is important to clearly establish the trophic linkages between predators and prey with respect to temporal abundance, demographics, distribution, and diet. In the northwest Atlantic Ocean, the depletion of large coastal sharks was thought to trigger a trophic cascade whereby predation release resulted in increased cownose ray abundance, which then caused increased predation on and subsequent collapse of commercial bivalve stocks. These claims were used to justify the development of a predator-control fishery for cownose rays, the "Save the Bay, Eat a Ray" fishery, to reduce predation on commercial bivalves. A reexamination of data suggests declines in large coastal sharks did not coincide with purported rapid increases in cownose ray abundance. Likewise, the increase in cownose ray abundance did not coincide with declines in commercial bivalves. The lack of temporal correlations coupled with published diet data suggest the purported trophic cascade is lacking the empirical linkages required of a trophic cascade. Furthermore, the life history parameters of cownose rays suggest they have low reproductive potential and their populations are incapable of rapid increases. Hypothesized trophic cascades should be closely scrutinized as spurious conclusions may negatively influence conservation and management decisions.


Figures

Figure 1
Figure 1. Estimated relative abundance for sandbar sharks, dusky sharks, and blacktip sharks from the University of North Carolina (UNC) and Virginia Institute of Marine Science (VIMS) shark longline surveys with 95% confidence intervals.
Relative abundance is expressed as the year’s estimated mean index divided by the maximum estimated yearly mean index in each time series. Trend lines are estimated based on the delta-lognormal model fitted responses and plotted using loess smoothing.
Figure 2
Figure 2. Trends in estimated relative abundance for sandbar sharks, dusky sharks, and blacktip sharks from the Virginia Institute of Marine Science (VIMS) and the University of North Carolina (UNC) longline surveys compared to trends in cownose ray relative abundance in the Delaware Bay, Delaware and Pamlico Sound, North Carolina trawl surveys.
Data on cownose ray abundance are from Heithaus et al.. Relative abundance is expressed as the year’s estimated mean index divided by the maximum estimated yearly mean index in each time series.
Figure 3
Figure 3. The percent frequency of the population growth rates (λ) for 38 species of sharks and 5 species of skates as a comparison to that of the cownose ray and the “great sharks” as considered by Myers et al..
The finite rate of population increase (λ) was calculated assuming r is analogous to the intrinsic rate of population increase (er = λ). The images of the cownose ray and shark are available at http://www.nefsc.noaa.gov/lineart.
Figure 4
Figure 4. Thermal tolerances indicate a lack of spatiotemporal overlap between large coastal sharks and some of their purported “mesopredator” prey.
Boxes represent normal temperature ranges and horizontal lines represent maximum and minimum tolerances (where such data were available). Data were sourced from the literature and the VIMS longline database.
Figure 5
Figure 5. ArcGIS map of the U.S. Atlantic coast and plots of relative abundances of cownose rays (black lines) in the Delaware Bay, DE and Pamlico Sound, NC trawl surveys compared to landings data (colored lines) for bay scallop and eastern oyster from the Mid-Atlantic and northeast U.S. Atlantic coast for all available years (National Marine Fisheries Service landings).
Line colors match the colors of the corresponding state/region on the map. The cross-hatched area delineates the core range of cownose rays in the region. Data on cownose ray abundance are from Heithaus et al..

References

    1. Paine R. T. Food webs: Linkage, interaction strength and community infrastructure. J. Anim. Ecol. 49, 667–685 (1980).
    1. Polis G. A., Sears A. L. W., Huxel G. R., Strong D. R. & Maron J. When is a trophic cascade a trophic cascade? Trends Ecol. Evol. 15, 473–475 (2000). - PubMed
    1. Menge B. A. Indirect effects in marine rocky intertidal interaction webs: patterns and importance. Ecological Monographs 65, 21–74 (1995).
    1. Pinnegar J. K. et al. Trophic cascades in benthic marine ecosystems: lessons for fisheries and protected-area management. Environmental Conservation 27, 179–200 (2000).
    1. Terborgh J. A. & Estes J. A. Eds. Trophic Cascades: Predators, Prey, and the Changing Dynamics of Nature (Island Press, Washington DC, 2010).

LinkOut - more resources