. 2016 Jun;30(6):1365-74.
doi: 10.1038/leu.2016.26. Epub 2016 Feb 15.

The TCA cycle transferase DLST is important for MYC-mediated leukemogenesis

Affiliations

The TCA cycle transferase DLST is important for MYC-mediated leukemogenesis

N M Anderson et al. Leukemia. 2016 Jun.

Abstract

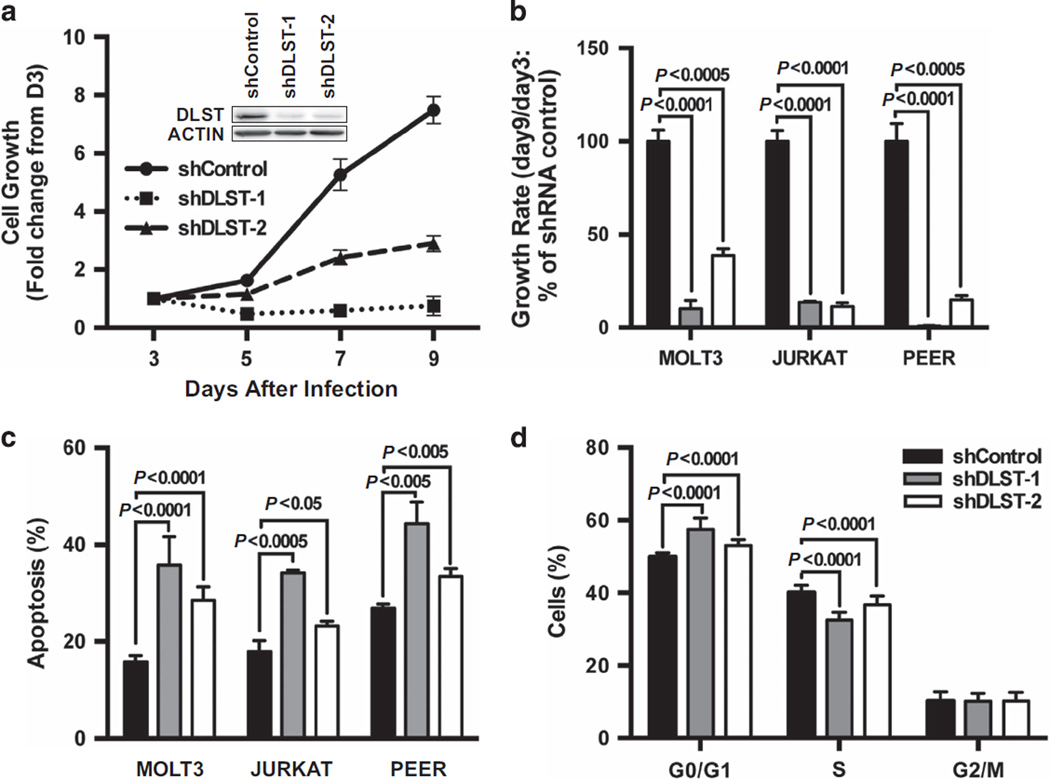
Despite the pivotal role of MYC in the pathogenesis of T-cell acute lymphoblastic leukemia (T-ALL) and many other cancers, the mechanisms underlying MYC-mediated tumorigenesis remain inadequately understood. Here we utilized a well-characterized zebrafish model of Myc-induced T-ALL for genetic studies to identify novel genes contributing to disease onset. We found that heterozygous inactivation of a tricarboxylic acid (TCA) cycle enzyme, dihydrolipoamide S-succinyltransferase (Dlst), significantly delayed tumor onset in zebrafish without detectable effects on fish development. DLST is the E2 transferase of the α-ketoglutarate (α-KG) dehydrogenase complex (KGDHC), which converts α-KG to succinyl-CoA in the TCA cycle. RNAi knockdown of DLST led to decreased cell viability and induction of apoptosis in human T-ALL cell lines. Polar metabolomics profiling revealed that the TCA cycle was disrupted by DLST knockdown in human T-ALL cells, as demonstrated by an accumulation of α-KG and a decrease of succinyl-CoA. Addition of succinate, the downstream TCA cycle intermediate, to human T-ALL cells was sufficient to rescue defects in cell viability caused by DLST inactivation. Together, our studies uncovered an important role for DLST in MYC-mediated leukemogenesis and demonstrated the metabolic dependence of T-lymphoblasts on the TCA cycle, thus providing implications for targeted therapy.


Conflict of interest statement

CONFLICT OF INTEREST

The authors declare no conflict of interest.

Figures

Figure 1
Figure 1
Heterozygous loss of dlst partially suppresses Myc-induced T-ALL. (a) Schematic of the rag2:EGFP-mMyc and rag2:GFP constructs that drove the development of EGFP+ T-ALL in the zebrafish model of Myc-induced T-ALL. (b) Tumor induction rates indicate that Myc-induced T-ALL is delayed with heterozygous loss of the dlst allele (n = 19 for Myc; dlst+/− and n = 26 for Myc; dlst+/+; P = 0.0003). (c) EGFP-labeled T-cells in a control rag2:EGFP fish (71 days old) define the normal thymus boundary. (d) Leukemia in a 63-dpf-old Myc;dlst+/+ fish. (e, f) Myc;dlst+/− fish (97 and 100 days old) with no tumor development (e) or early-stage lymphoma (f) based on thymic EGFP expression. (g, h) Western blotting analysis confirmed ~ 50% reduction of Dlst protein levels in T-lymphoblasts from Myc;dlst+/− compared with their Myc;dlst+/+ siblings (mean ± s.d. Dlst-to-Actin ratio; 0.82 ± 0.24 vs 2.42 ± 0.49; P = 0.0069; n = 4 per group). Scale bar for panels (b–d) = 1 mm.
Figure 2
Figure 2
Heterozygous loss of dlst results in decreased cell size and a delay in cell cycle progression of tumor cells with Myc overexpression. FACS-sorted EGFP+ cells stained with May-Grunwald–Giemsa: (a) EGFP;dlst+/+; (b) EGFP;dlst+/−; (c) Myc;dlst+/+; and (d) Myc;dlst+/− cells (n = 4 per group). Forward scatter plots of EGFP+ population of EGFP;dlst+/+ vs EGFP;dlst+/− (e) and Myc;dlst+/− vs Myc;dlst+/+ (f). Statistical comparison by Fisher’s exact test demonstrated that Myc;dlst+/− tumor cells were significantly smaller than Myc;dlst+/+ T-ALL cells: P = 0.0022; n = 3 per group. Cell cycle distribution of EGFP;dlst+/+ vs EGFP;dlst+/− thymocytes (g; n = 4 per group) and Myc;dlst+/− vs Myc;dlst+/+ tumor cells (h; n = 3 per group). Percentages of cells in G1/G0, S or G2/M stages of the cell cycle are shown. (i and j) The overlay of anti-PH3 and GFP images of premalignant thymocytes from Myc;dlst+/+ (i) vs Myc;dlst+/− (j) fish. (k) Quantification of PH3+ premalignant thymocytes (GFP+) from Myc;dlst+/+ vs Myc;dlst+/− fish (mean ± s.d. PH3+ cells per area: 6 ± 0.97 vs 0.33 ± 0.21; P = 0.02; n = 3 per group). Fish at ~ 3 months of age were used for analyses in panels (a–h) and fish at ~ 1 month of age were used for analyses in panels (i and j). Myc-overexpressing T-ALL cells in panels (c, d, f and h) were dissected outside the thymic regions of the fish. Scale bar for panels (a–d) = 10 µm and for panels (i and j) = 50 µm.
Figure 3
Figure 3
dlst heterozygous loss does not affect zebrafish development or normal hematopoiesis. Histological sections of adult (4-month-old) zebrafish: comparison of wild-type (dlst+/+) (a–e) and dlst+/− (f–j) revealed no gross morphological changes in the thymus, kidney, intestine, ovary or muscle (n = 4 per group). Normal hematopoiesis is unaltered in adult zebrafish with dlst heterozygous loss (k–m). When analyzed by flow cytometry, the frequency distribution of blood cell populations (erythrocytes, lymphocytes, monocyte/granulocytes and progenitors) was unaltered by heterozygous dlst loss (k; erythroid: P = 0.4547; lymphoid: P = 0.728; precursor: P = 0.8077; granulocyte/monocyte: P = 0.3914; n = 6 per group) nor was the morphology of these blood cells: dlst+/+ (l) vs dlst+/− (m) from 5-month-old fish stained with May-Grunwald–Giemsa (n = 6 per group). Scale bar for panels (a–f) = 0.2 mm and for panels (l–m) = 10 µm.
Figure 4
Figure 4
Dlst protein levels are elevated in zebrafish T-ALL cells posttranscriptionally. (a) Western blotting showing protein levels of EGFP-MYC, Dlst and Actin in zebrafish T-ALL samples (Myc;dlst+/+ and Myc;dlst+/−), compared with the control thymus samples (EGFP;dlst+/+) of zebrafish. (b) Dlst vs Actin protein ratios demonstrating that Dlst levels are significantly higher in T-ALL cells from both Myc;dlst+/+ and Myc;dlst+/− fish, compared with control thymocytes (mean ± s.d. of Dlst-to-Actin ratio: 6.47 ± 1.9 vs 0.26 ± 0.09; P = 0.017 for EGFP;dlst+/+ vs Myc;dlst+/+; and 1.88 ± 0.5 vs 0.26 ± 0.09; P = 0.019 for EGFP;dlst+/+ vs Myc;dlst+/−; n = 4 per group). (c, d) Q-RT-PCR analysis revealing significantly elevated transcript levels of shmt2 (d; P = 0.0084; n = 3 per group) but not dlst (c; P = 0.225; n = 4 per group) in tumor cells (Myc;dlst+/+), compared with those in normal thymus (EGFP;dlst+/+). (e) Pulse-chase analysis of Dlst half-life showing that Dlst is more stable in tumor cells (Myc;dlst+/+), compared with that in normal thymus (dlst+/+) (>10 vs ≤ 8 h; n = 4 per group). CHX: Cycloheximide. Dlst protein amounts (relative to Actin) are shown in the bottom of panel (e). Because of the degradation of Actin and other proteins, the relative amounts of Dlst in Myc;dlst+/+ T-ALL cells increase over time.
Figure 5
Figure 5
DLST protein expression in primary patient T-ALL cells and human T-ALL cell lines. (a) Western blotting showing protein levels of DLST and ACTIN in primary pediatric T-ALL patient samples, compared with normal thymus samples. (b) DLST vs ACTIN protein ratios demonstrating that DLST levels are significantly higher in T-ALL patient samples compared with control thymocytes (P = 0.05; mean ± s.d. of DLST to ACTIN ratio: 0.7 ± 0.2 vs 0.08 ± 0.039; n = 3 for thymus and n = 4 for T-ALL patient samples). (c) Western blotting analysis of protein levels of ICN1 (the intracellular domain of NOTCH1), MYC, PTEN, DLST and ACTIN in primary pediatric T-ALL patient samples. (d) Western blotting analysis of protein levels of ICN1 (the intracellular domain of NOTCH1), MYC, PTEN, DLST and ACTIN in three human T-ALL cell lines (JURKAT, MOLT3 and PEER). (e) Western blotting analysis of MYC, DLST, SHMT2 and ACTIN protein levels in BCL-2-overexpressing JURKAT cells that are transduced with either control shLuciferase or shMYC. Normalized protein amounts for DLST and SHMT2 are shown as numbers below the western blotting panels.
Figure 6
Figure 6
DLST knockdown by RNAi in human T-ALL cells leads to slowed cell growth and apoptosis. (a, b) The growth kinetics of human T-ALL cells were analyzed after transduction with either a control shRNA or two shRNA hairpins targeting DLST. (a) Relative growth kinetics of the MOLT3 cell line. The insert in panel (a) revealed that two independent shDLST hairpins efficiently target human DLST. (b) Relative growth rate of human MOLT3, JURKAT and PEER T-ALL cells. (c) Apoptosis was induced by shRNA knockdown of DLST in MOLT3, JURKAT and PEER T-ALL cells. Annexin-V staining was performed on cells isolated 8 days after viral infection. (d) Genetic knockdown of DLST induces statistically significant cell cycle changes in MOLT3 cells. At 4 days postinfection, cells were fixed and then stained with PI and analyzed by flow cytometry. Representative data from over four independent experiment repeats are shown.
Figure 7
Figure 7
DLST knockdown by RNAi results in disruption of the TCA cycle that can be rescued by addition of succinate. (a) Schematic of the TCA cycle. (b) DLST inhibition leads to a disruption of the TCA cycle in MOLT3 cells, resulting in an accumulation of α-KG and loss of succinyl-CoA. (c) Succinate rescues MOLT3 cells from slowed cellular growth induced by DLST knockdown. At 36 h postinfection, MOLT3 cells transduced with shCONTROL or shDLST hairpin were supplemented with 2 mm of Me-succinate in their culture media.

References

    1. Goldberg JM, Silverman LB, Levy DE, Dalton VK, Gelber RD, Lehmann L, et al. Childhood T-cell acute lymphoblastic leukemia: the Dana-Farber Cancer Institute acute lymphoblastic leukemia consortium experience. J Clin Oncol. 2003;21:3616–3622. - PubMed
    1. Ko RH, Ji L, Barnette P, Bostrom B, Hutchinson R, Raetz E, et al. Outcome of patients treated for relapsed or refractory acute lymphoblastic leukemia: a Therapeutic Advances in Childhood Leukemia Consortium study. J Clin Oncol. 2010;28:648–654. - PMC - PubMed
    1. Marks DI, Paietta EM, Moorman AV, Richards SM, Buck G, DeWald G, et al. T-cell acute lymphoblastic leukemia in adults: clinical features, immunophenotype, cytogenetics, and outcome from the large randomized prospective trial (UKALL XII/ECOG 2993) Blood. 2009;114:5136–5145. - PMC - PubMed
    1. Nesbit CE, Tersak JM, Prochownik EV. MYC oncogenes and human neoplastic disease. Oncogene. 1999;18:3004–3016. - PubMed
    1. Koch U, Radtke F. Notch in T-ALL: new players in a complex disease. Trends Immunol. 2011;32:434–442. - PubMed

MeSH terms