. 2016 Feb 15:6:21664.
doi: 10.1038/srep21664.

Cyclin-dependent kinase 2 protects podocytes from apoptosis

Affiliations

Cyclin-dependent kinase 2 protects podocytes from apoptosis

Pauliina Saurus et al. Sci Rep. .

Abstract

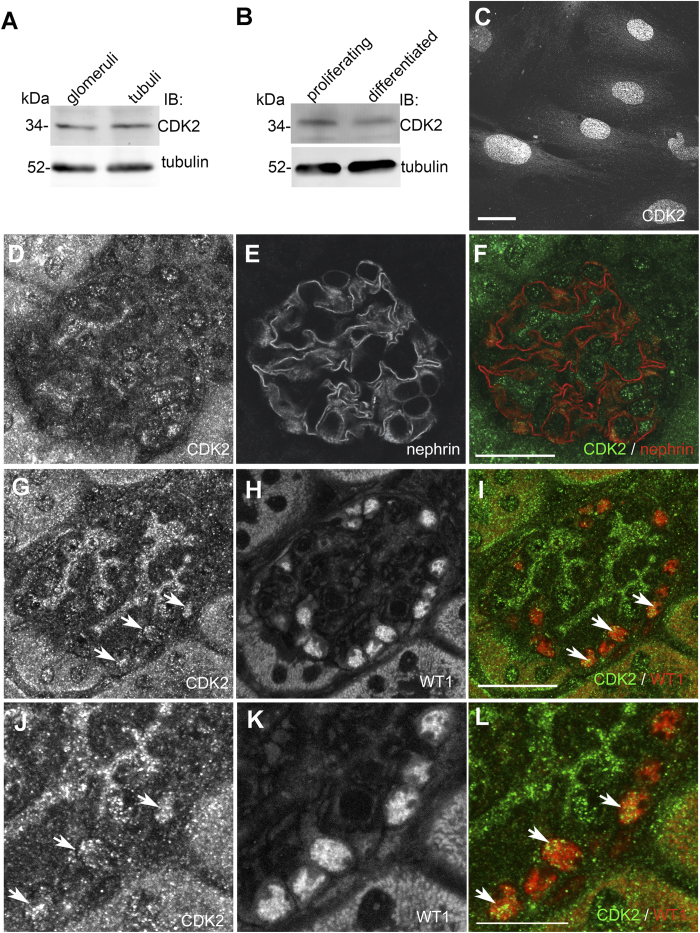
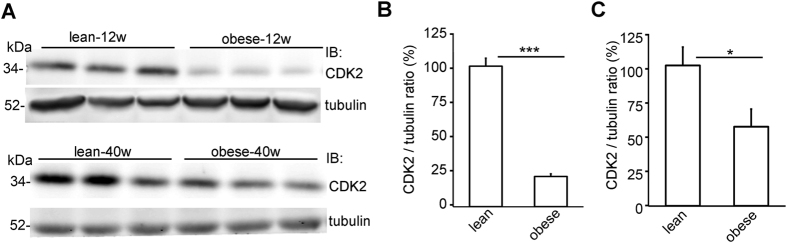
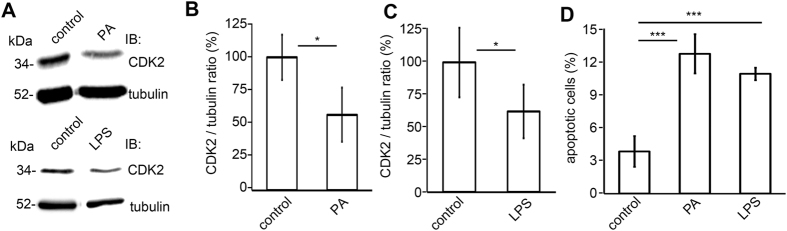
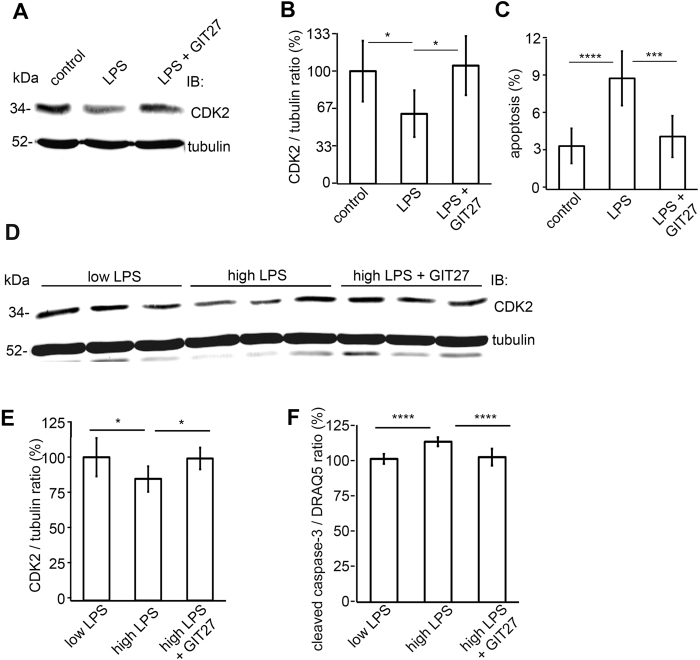
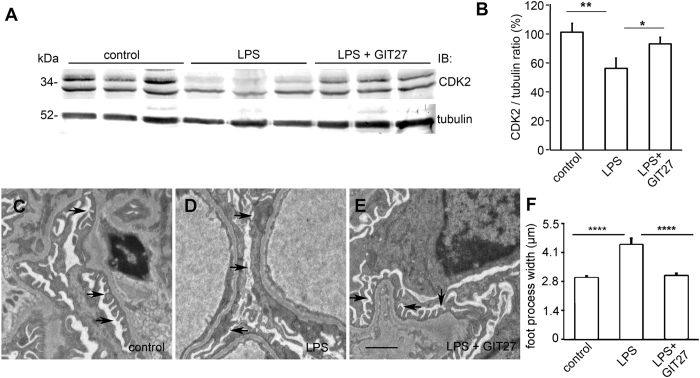
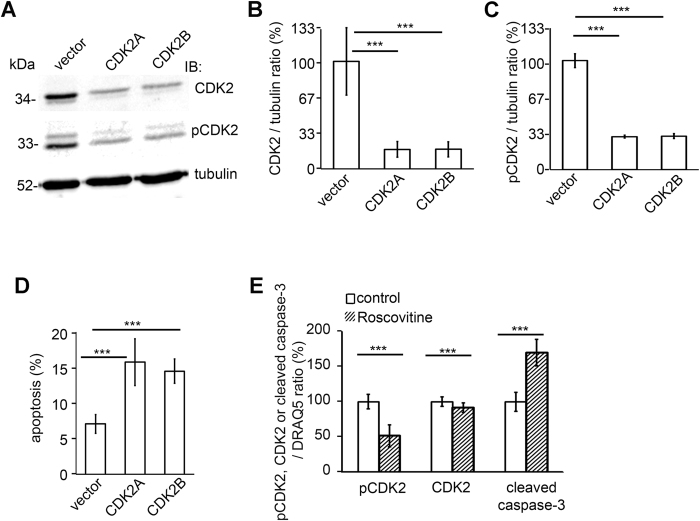
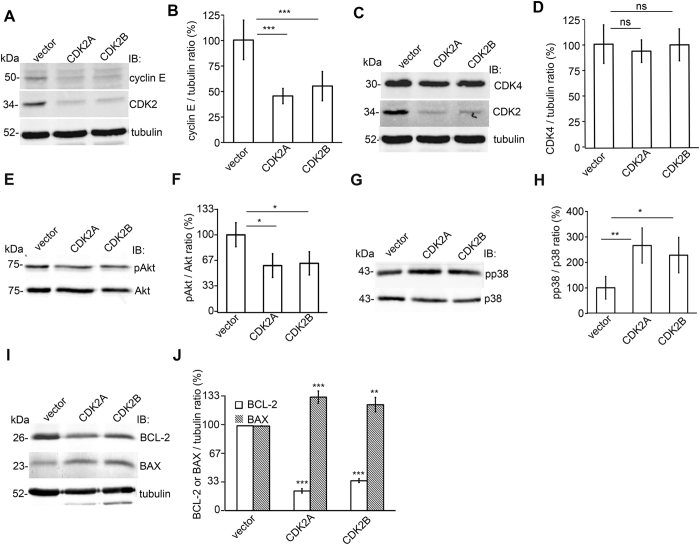
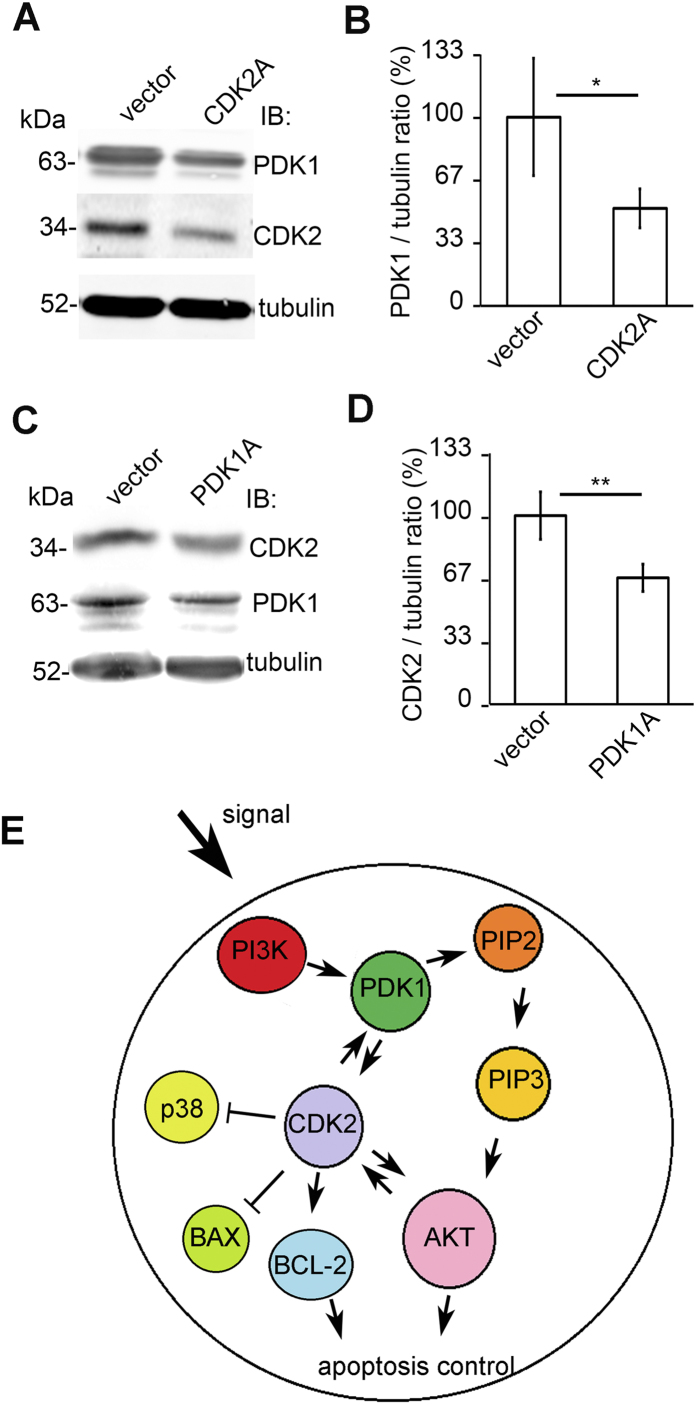
Loss of podocytes is an early feature of diabetic nephropathy (DN) and predicts its progression. We found that treatment of podocytes with sera from normoalbuminuric type 1 diabetes patients with high lipopolysaccharide (LPS) activity, known to predict progression of DN, downregulated CDK2 (cyclin-dependent kinase 2). LPS-treatment of mice also reduced CDK2 expression. LPS-induced downregulation of CDK2 was prevented in vitro and in vivo by inhibiting the Toll-like receptor (TLR) pathway using immunomodulatory agent GIT27. We also observed that CDK2 is downregulated in the glomeruli of obese Zucker rats before the onset of proteinuria. Knockdown of CDK2, or inhibiting its activity with roscovitine in podocytes increased apoptosis. CDK2 knockdown also reduced expression of PDK1, an activator of the cell survival kinase Akt, and reduced Akt phosphorylation. This suggests that CDK2 regulates the activity of the cell survival pathway via PDK1. Furthermore, PDK1 knockdown reduced the expression of CDK2 suggesting a regulatory loop between CDK2 and PDK1. Collectively, our data show that CDK2 protects podocytes from apoptosis and that reduced expression of CDK2 associates with the development of DN. Preventing downregulation of CDK2 by blocking the TLR pathway with GIT27 may provide a means to prevent podocyte apoptosis and progression of DN.


Conflict of interest statement

P-H.G. has received lecture honoraria from Abbot, Boehringer Ingelheim, Cebix, Eli Lilly, Genzyme, Novartis, Novo Nordisk and MSD, and research grants from Eli Lilly and Roche. P-H.G. is an advisory board member for Boehringer Ingelheim, Novartis and Medscape. The authors have no additional financial interests.

Figures

Figure 1
Figure 1. CDK2 is expressed in podocytes.
(A) Immunoblot of rat glomerular and tubular fractions shows that CDK2 is expressed in glomeruli and tubuli. Tubulin is included as a loading control. (B) Immunoblot of cultured human podocytes shows that CDK2 is expressed in both proliferating and differentiated podocytes. Tubulin is included as a loading control. (C) Immunofluorescence microscopy indicates that CDK2 localizes mainly in the nuclei in differentiated human podocytes. (D–F) Perfused mouse kidney sections stained with CDK2 (D) and nephrin (E) antibodies shows that CDK2 is expressed in mouse glomerulus. (G–L) Perfused mouse kidney sections stained with CDK2 (G,J) and WT1 (H,K) antibodies shows that CDK2 concentrates in nuclei (arrows) in podocytes as visualized in merged image (I,L). Scale bars: (C) 12 μm, (D–I) 25 μm, (J–L) 12 μm.
Figure 2
Figure 2. CDK2 is downregulated in the glomeruli of obese Zucker rats.
(A) The expression of CDK2 is decreased in the glomeruli of 12 and 40 weeks old obese Zucker rats compared to lean controls. Tubulin is included as a loading control. (B) Quantification of CDK2 in the glomeruli of 6 individual lean and 6 individual obese 12 weeks old Zucker rats shows lower expression of CDK2 in the glomeruli of obese Zucker rats. (C) Quantification of CDK2 in the glomeruli of 6 individual lean and 6 individual obese 40 weeks old Zucker rats shows that the expression of CDK2 is lower in the glomeruli of obese Zucker rats. In (A), glomeruli were isolated, lysed and immunoblotted with anti-CDK2 IgGs. Data are presented as mean ± SEM (n = 6 per group). *p < 0.05, ***p < 0.001 vs. lean group.
Figure 3
Figure 3. CDK2 is downregulated in podocyte injury models in vitro.
(A) Representative immunoblot for CDK2 after PA- and LPS-treatments. Tubulin is included as a loading control. (B) Quantification of CDK2 after PA-treatment shows a decrease in CDK2 expression level in cultured human podocytes. (C) Quantification of CDK2 after LPS-treatment shows a decrease in CDK2 expression level in cultured human podocytes. (D) Flow cytometry of cultured human podocytes stained with annexin V and 7-AAD double labeling, where annexin V is used as an apoptosis and 7-AAD as a necrosis marker, confirms that PA- and LPS-treatments increase podocyte apoptosis. The experiments were performed three times with three replicates in each experiment. Data are presented as mean ± SD. *p < 0.05, ***p < 0.001 vs. control group.
Figure 4
Figure 4. Inhibition of the TLR pathway prevents downregulation of CKD2 and induction of apoptosis in cultured human podocytes treated with LPS or with human sera with high LPS activity.
(A) Representative immunoblot for CDK2 of LPS-treated podocytes with or without GIT27 treatment. Tubulin is included as a loading control. (B) Quantification of CDK2 shows that co-treatment of podocytes with LPS and GIT27 prevents downregulation of CDK2. The experiment was performed three times with three replicates in each experiment. Data are presented as mean ± SD. *p < 0.05 vs. LPS group. (C) Flow cytometry of podocytes stained for Annexin V confirms that co-treatment of podocytes with GIT27 and LPS prevents induction of apoptosis. The experiment was performed three times with three replicates in each experiment. Data are presented as mean ± SD. ***p < 0.001, ****p < 0.0001 vs. LPS group. (D) Representative immunoblot for CDK2 in cultured human podocytes treated with sera with low or high LPS activity, and with or without GIT27 co-treatment. Tubulin is included as a loading control. (E) Quantification of CDK2 from podocytes treated with sera with high or low LPS activity (n = 6 each), or treated with sera with high LPS activity in the presence of GIT27 (n = 6). The expression of CDK2 was lower after treatment with sera with high LPS activity than with low LPS activity. GIT27-treatment prevented downregulation of CDK2 induced by high LPS activity. The experiment was performed three times. Data are presented as mean ± SD. *p < 0.05, vs. high LPS group. (F) Quantification of In-Cell Western of cleaved caspase-3 in podocytes treated with sera with high or low LPS activity with or without GIT27 treatment shows that the expression of cleaved caspase-3 was higher after treatment with high-LPS sera compared to treatment with low-LPS sera. GIT27-treatment prevented the induction of apoptosis. DRAQ5TM was used for normalization. Treatments were performed with sera from individual patients (n = 6 per group). The experiment was performed three times with 32 replicates in each group. Data are presented as mean ± SD, ****p < 0.0001 vs. high LPS group.
Figure 5
Figure 5. Inhibition of the TLR pathway prevents LPS-induced downregulation of CDK2 and podocyte foot process widening in BALB-C mouse kidneys.
(A) Representative immunoblot for CDK2 in control, LPS-treated and LPS- and GIT27-treated mouse kidney cortical lysates. Tubulin is included as a loading control. (B) Quantification of CDK2 in mouse kidney cortical lysates shows that co-treatment of mice with LPS and GIT27 prevents LPS-induced downregulation of CDK2 (n = 6/treatment group). Data are presented as mean ± SEM. *p < 0.05, **p < 0.01 vs. LPS group. (C) Electron microscopy of control mouse kidney shows podocyte foot processes (arrows) regularly lining the glomerular basement membrane around capillary loops. (D) LPS-treatment induces podocyte foot process widening (arrows). (E) GIT27 co-treatment prevents LPS-induced podocyte foot process widening (arrows). Scale bar (C–E): 2 μm. (F) Quantification of podocyte foot process width confirms that LPS causes foot process widening which is prevented by GIT27 co-treatment. Foot process width was calculated from 4 animals per group, 3 glomeruli per animal and 3 capillary loops per glomeruli. Data are presented as mean ± SEM. ****p < 0.0001 vs. LPS group. In (A), mouse kidney cortices were lysed and immunoblotted with anti-CDK2 IgG.
Figure 6
Figure 6. Knockdown of CDK2 by shRNAs increases apoptosis in cultured human podocytes.
(A) Representative immunoblot for CDK2 and phospho-CDK2 (pCDK2, Thr160) in CDK2 knockdown cells. Podocytes were infected using two different shRNA constructs targeting CDK2 (CDK2A, CDK2B). Empty vector (vector) shRNA served as a control. Tubulin is included as a loading control. (B) CDK2 protein level is significantly decreased by both shRNAs compared to empty vector shRNA. (C) Quantification of phospho-CDK2 shows that the phosphorylation level of CDK2 is downregulated after knockdown of CDK2. The experiments (A,B) were performed three times with three replicates in each experiment. (D) Flow cytometry of podocytes stained with annexin V confirms that CDK2 knockdown increases podocyte apoptosis. The experiment was performed three times with three replicates in each experiment. Data are presented as mean ± SD. ***p < 0.001 vs. vector group. (E) Quantification of In-Cell Western of phospho-CDK2, CDK2 and cleaved caspase-3 in podocytes treated or not with 25 μM roscovitine shows that the expression of phosphorylated CDK2 and CDK2 are decreased and the expression of cleaved caspase-3 is higher after treatment with roscovitine compared to control. DRAQ5TM was used for normalization. The experiment was performed three times, with 24 replicates per group. Data are presented as mean ± SD, ***p < 0.001 vs. control group.
Figure 7
Figure 7. CDK2 knockdown inhibits cyclin E and the antiapoptotic pathways and stimulates the pro-apoptotic pathways in cultured human podocytes.
(A) Immunoblot of cyclin E and CDK2 after knockdown of CDK2 with two different shRNA constructs (CDK2A and CDK2B) in cultured podocytes. Empty vector (vector) served as a control. Tubulin is included as a loading control. (B) Quantification of cyclin E shows that the expression level of cyclin E is downregulated after knockdown of CDK2. (C) Immunoblot of CDK4 after CDK2 knockdown in cultured podocytes. Tubulin is included as a loading control. (D) Quantification of CDK4 shows that the expression level of CDK4 does not change after CDK2 knockdown confirming the specificity of the knockdown. (E) Immunoblot assay of phosphorylated Akt (pAkt) in podocytes after CDK2 knockdown. Total Akt is included as a loading control. (F) Quantification of phosphorylated Akt shows that CDK2 knockdown decreases Akt activity in cultured podocytes. (G) Immunoblot of phosphorylated p38 (pp38) in podocytes after CDK2 knockdown. Total p38 is included as a loading control. (H) Quantification of phosphorylated p38 shows that CDK2 knockdown increases p38 activity in cultured podocytes. (I) Immunoblot of BCL-2 and BAX after knockdown of CDK2 in cultured podocytes. Tubulin is included as a loading control. (J) Quantification of BCL-2 and BAX shows that the expression level of BCL-2 is downregulated and BAX upregulated after knockdown of CDK2. Each experiment was performed three times with three replicates in each experiment. Data are presented as mean ± SD. ns: non significant, *p < 0.05, **p < 0.01, ***p < 0.001 vs. vector group.
Figure 8
Figure 8. CDK2 knockdown reduces PDK1 expression and PDK1 knockdown reduces CDK2 expression in cultured human podocytes.
(A) Representative immunoblot for PDK1 showing decreased PDK1 expression after CDK2 knockdown. Tubulin is included as a loading control. (B) Quantification of PDK1 shows that CDK2 knockdown decreases PDK1 expression in cultured podocytes. (C) Representative immunoblot for CDK2 after PDK1 knockdown in podocytes showing decreased CDK2 expression. Tubulin is included as a loading control. (D) Quantification of CDK2 shows that PDK1 knockdown decreases CDK2 expression in cultured podocytes. Each experiment was performed three times with three replicates in each experiment. Data are presented as mean ± SD. *p < 0.05, **p < 0.01 vs. vector group. (E) Schematic illustration linking CDK2 to the PI3K-dependent Akt signalling in podocyte apoptosis. PI3K stimulates PDK1, which activates Akt by phosphorylation of PIP2 to PIP3. PDK1 also induces CDK2 expression and CDK2 induces PDK1 expression. CDK2 reduces p38 phosphorylation and BAX expression and induces BCL-2 expression and Akt phosphorylation. In addition, Akt is known to activate CDK2. Induced BCL-2 expression and Akt phosphorylation protect podocytes from apoptosis. PIP2: phosphoinositol(4,5)biphosphate; PIP3: phosphoinositol(3,4,5)trisphosphate.

References

    1. Borch-Johnsen K. et al. The natural history of insulin-dependent diabetes mellitus in Denmark: 1. Long-term survival with and without late diabetic complications. Diabet. Med. 4, 201–210 (1987). - PubMed
    1. Reddy G. R., Kotlyarevska K., Ransom R. F. & Menon R. K. The podocyte and diabetes mellitus: is the podocyte the key to the origins of diabetic nephropathy? Curr. Opin. Nephrol. Hypertens. 17, 32–36 (2008). - PubMed
    1. Steffes M. W., Schmidt D., McCrery R. & Basgen J. M. & International Diabetic Nephropathy Study Group. Glomerular cell number in normal subjects and in type 1 diabetic patients. Kidney Int. 59, 2104–2113 (2001). - PubMed
    1. Verzola D. et al. Apoptosis in the kidneys of patients with type II diabetic nephropathy. Kidney Int. 72, 1262–1272 (2007). - PubMed
    1. Meyer T. W., Bennett P. H. & Nelson R. G. Podocyte number predicts long-term urinary albumin excretion in Pima Indians with Type II diabetes and microalbuminuria. Diabetologia 42, 1341–1344 (1999). - PubMed

Publication types

Substances

LinkOut - more resources