. 2016 Feb 15:7:10754.
doi: 10.1038/ncomms10754.

The presence of extra chromosomes leads to genomic instability

Affiliations

The presence of extra chromosomes leads to genomic instability

Verena Passerini et al. Nat Commun. .

Abstract

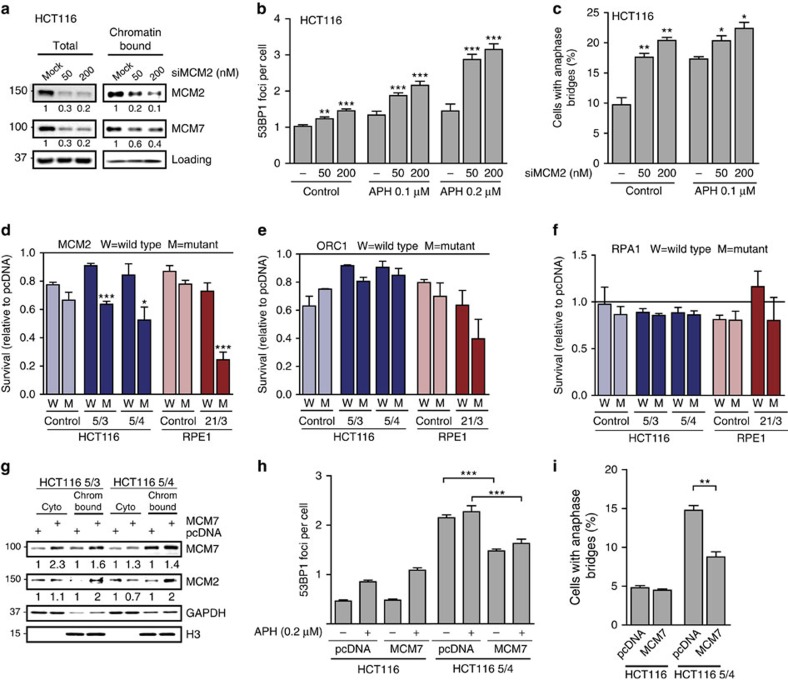
Aneuploidy is a hallmark of cancer and underlies genetic disorders characterized by severe developmental defects, yet the molecular mechanisms explaining its effects on cellular physiology remain elusive. Here we show, using a series of human cells with defined aneuploid karyotypes, that gain of a single chromosome increases genomic instability. Next-generation sequencing and SNP-array analysis reveal accumulation of chromosomal rearrangements in aneuploids, with break point junction patterns suggestive of replication defects. Trisomic and tetrasomic cells also show increased DNA damage and sensitivity to replication stress. Strikingly, we find that aneuploidy-induced genomic instability can be explained by the reduced expression of the replicative helicase MCM2-7. Accordingly, restoring near-wild-type levels of chromatin-bound MCM helicase partly rescues the genomic instability phenotypes. Thus, gain of chromosomes triggers replication stress, thereby promoting genomic instability and possibly contributing to tumorigenesis.


Figures

Figure 1
Figure 1. Trisomy and tetrasomy elevates the frequency of pre-mitotic errors.
(a) Chromosome copy number changes in the parental HCT116, RPE1 and the respective trisomic and tetrasomic cell lines. Chromosome gains are marked in red and chromosome losses in grey. Note that both HCT116 and RPE1 contain several previously documented structural copy number variations that remained largely unchanged in the trisomic and tetrasomic derivatives. The identity of the extra chromosome and the number of copies were used for identification of each cell line, for example, HCT116 3/3 contain three copies of chromosome 3. Two cell lines with identical trisomies, but originating from different single cells, were selected for HCT116 3/3: clone 11 and clone 13 (c11 and c13) and for RPE 5/3 12/3 (c3 and c7) to determine the effect of clonal differences. (b) Representative images of a HCT116 5/3 anaphase cell with anaphase bridges. (c,d) Quantification of anaphase bridges in controls HCT116 and RPE1, and the respective trisomic and tetrasomic derivatives. (e) Representative images of an HCT116 5/3 anaphase cell stained with DAPI, anti-centromere antibody CREST and anti-α-tubulin. Arrowhead marks an acentric chromosome fragment. (f) Quantification of acentric chromosomal fragments and anaphase bridges. Bridges extend fully between DNA masses; acentric fragments were distinguished from whole-lagging chromosomes by absence of the CREST signal. (g) Examples of HCT116 5/3 anaphase cells stained with DAPI and antibodies against BLM (yellow arrowheads), which bind to UFBs. White arrowhead marks an anaphase bridge. (h) Quantification of UFBs. Plots (c,d,f and h) show mean±s.e.m. of three independent experiments. At least 100 anaphases were scored in each experiment in c,d,f and h; in RPE1 21/3, only 68 (d), 51 (f) and 54 (h) anaphase cells were scored in each experiment. Nonparametric t-test; *P<0.05, **P<0.01 and ***P<0.001.
Figure 2
Figure 2. Trisomy and tetrasomy elevates DNA damage.
(a) Example of control and aneuploid cells stained with DAPI and antibody against 53BP1 and cyclin A2 to distinguish G1 cells (cyclin A2 negative). (b) Average number of 53BP1 foci per G1-phase cell counted in untreated HCT116 (control), upon treatment with 0.25 μM aphidicolin (APH) and in the untreated aneuploid derivatives. (c) Average number of 53BP1 foci per G1-phase cell counted in untreated RPE1 (control), upon exposure to 0.25 μM aphidicolin (APH) and in the untreated aneuploid derivatives. All plots show mean±s.e.m. of three independent experiments, at least 500 cyclin A-negative cells were scored in each experiment. Nonparametric t-test; ***P<0.0001. (d) Structural aberrations, such as gaps and constrictions, on metaphase chromosomes from RPE1 21/3 cells grown under replication stress conditions (0.1 μM aphidicolin and 0.73 mM caffeine). Representative metaphase spread; aberrations are indicated by red arrowheads. (e) Quantification of chromosomal aberrations detected in metaphase spreads of HCT116 cells exposed to 0.3 μM aphidicolin for 24 h. Fisher's exact test, *P<0.05, n=94 (HCT116), 93 (5/3) and 95 (5/4) metaphases analysed in two independent experiments. (f) Distribution of metaphases according to the number of gaps and constrictions in RPE1, and its trisomic derivative under treatment with 0.1 μM aphidicolin and 0.73 mM caffeine for 24 h. Fisher's exact test, **P<0.01, n=94 (RPE1) and 119 (21/3) metaphases analysed in two independent experiments.
Figure 3
Figure 3. Altered replication dynamics in trisomic and tetrasomic cells.
(a) Cell cycle profiles of HCT116, HCT116 5/3 and HCT116 5/4, and (b) control RPE1 and trisomic RPE1 21/3 under normal conditions, and also upon treatment with the replication inhibitor aphidicolin. (c) Levels of total and phosphorylated RPA2 in the parental cell lines and the trisomic and tetrasomic cell lines.
Figure 4
Figure 4. Trisomic and tetrasomic cells acquire de novo chromosomal rearrangements.
(a) Circos plot displaying de novo chromosomal rearrangements in HCT116 5/3 (blue) and HCT116 5/4 (red) cells. The outer ring shows all chromosomes. Both grey rings highlight the copy number profile based on mate-pair sequencing data of HCT116 5/3 (blue) and HCT116 5/4 (red) relative to the parental control. De novo CNA break point junctions derived from mate-pair sequencing are indicated with red and blue lines in the middle of the Circos plot. CNA No. 6 was found also in the parental cell line. (b) Example of a de novo 699 kb tandem duplication identified in HCT116 5/4 cells (CNA no. 1). (c) Break point junction sequences obtained by Sanger sequencing of de novo chromosomal rearrangement break points from a. The two chromosomal loci joined together are indicated in red and blue. Microhomology at the junction sequences is highlighted in green. For full results, see Supplementary Fig. 4b. (d) Bar plot depicting the number of clonal lines with and without de novo CNAs identified by SNP-array profiling. Twenty-four clonal lines were derived from HCT116 5/3 and parental control, respectively. For full results, see Supplementary Figure 5. (e) Circos plot depicting the CNAs identified in the clonal trisomic lines. Only affected chromosomes are visualized. Copy number losses are marked in red, gains in green, and known fragile sites in blue.
Figure 5
Figure 5. The abundance of replication factors is decreased in response to extra chromosomes.
(a) Unsupervised hierarchical clustering of the protein abundance fold changes (calculated log2 aneuploid-to-diploid ratio) of factors assigned to KEGG (Kyoto Encyclopedia of Genes and Genomes)-defined term replication; manually curated. HCT116 5/4 and HCT116 3/3 marked in the figure in bold are cell lines previously constructed by Minoru Koi; these cell lines were used only for the global proteome analysis. See Methods for more details. (b) Immunoblotting of subunits of the replicative helicase MCM2-7 in whole-cell extracts from trisomic cell lines and their respective controls. (c,d) Levels of chromatin-bound replication proteins in the parental cell lines and the trisomic and tetrasomic cell lines. Note that MCM2, 3 and 7 are downregulated in all cell lines with extra chromosomes except for RPE1 5/3 12/3 c3. Ponceau staining was used as loading control. (e,f) Levels of chromatin-bound subunits of the MCM2-7 helicase in asynchronous and synchronized cells in HCT116 5/3 and RPE1 21/3, and respective controls.
Figure 6
Figure 6. The accumulation of DNA damage is sensitive to abundance changes of MCM2-7 subunits.
(a) Levels of total and chromatin-bound MCM2 and MCM7 in parental HCT116 upon siRNA-mediated depletion of MCM2. (b) Accumulation of 53BP1 and (c) anaphase bridges in HCT116 upon depletion of MCM2 with and without replication stress. All plots show mean±s.e.m. of three independent experiments, at least 500 cyclin A-negative cells or 50 anaphases were scored in each experiment. (d) Survival rates of HCT116, RPE1 and their trisomic and tetrasomic derivatives upon overexpression of wild-type and mutant alleles of MCM2 (MCM-457A). (e) Survival rates of HCT116, RPE1 and the trisomic and tetrasomic derivatives upon overexpression of wild-type and mutant alleles of ORC1 (ORC1ΔBAH). (f) Survival rates of HCT116, RPE1 and the trisomic and tetrasomic derivatives upon overexpression of wild-type and mutant alleles of RPA1 (RPA1 L221P). Survival rates were normalized to the control (pcDNA transfected sample). All plots show mean+s.e.m. of three independent experiments; nonparametric t-test; *P<0.05, **P<0.01, ***P<0.001. (g) Levels of total and chromatin-bound MCM2 and MCM7 in HCT116 5/3 upon transient overexpression of MCM7. (h) Formation of 53BP1 foci and (i) accumulation of anaphase bridges in HCT116 and HCT116 5/4 upon transient overexpression of MCM7. One representative plot of three independent experiments is shown. Nonparametric t-test; *P<0.05, **P<0.01, ***P<0.001.

References

    1. Williams B. R. et al. Aneuploidy affects proliferation and spontaneous immortalization in mammalian cells. Science 322, 703–709 (2008). - PMC - PubMed
    1. Thompson S. L. & Compton D. A. Proliferation of aneuploid human cells is limited by a p53-dependent mechanism. J. Cell Biol. 188, 369–381 (2010). - PMC - PubMed
    1. Tang Y. C., Williams B. R., Siegel J. J. & Amon A. Identification of aneuploidy-selective antiproliferation compounds. Cell 144, 499–512 (2011). - PMC - PubMed
    1. Stingele S. et al. Global analysis of genome, transcriptome and proteome reveals the response to aneuploidy in human cells. Mol. Syst. Biol. 8, 608 (2012). - PMC - PubMed
    1. Mitelman Database of Chromosome Aberrations and Gene Fusions in Cancer (2016). (eds Mitelman, F., Johansson, B., Mertens, F.), http://cgap.nci.nih.gov/Chromosomes/Mitelman .

Publication types

MeSH terms