. 2015 Mar 2;127(10):3003-3008.
doi: 10.1002/ange.201410810. Epub 2015 Jan 30.

Selective and Potent Proteomimetic Inhibitors of Intracellular Protein-Protein Interactions

Affiliations

Selective and Potent Proteomimetic Inhibitors of Intracellular Protein-Protein Interactions

Anna Barnard et al. Angew Chem Weinheim Bergstr Ger. .

Abstract

Inhibition of protein-protein interactions (PPIs) represents a major challenge in chemical biology and drug discovery. α-Helix mediated PPIs may be amenable to modulation using generic chemotypes, termed "proteomimetics", which can be assembled in a modular manner to reproduce the vectoral presentation of key side chains found on a helical motif from one partner within the PPI. In this work, it is demonstrated that by using a library of N-alkylated aromatic oligoamide helix mimetics, potent helix mimetics which reproduce their biophysical binding selectivity in a cellular context can be identified.

Wählerische Mimetika: Die Inhibierung von Protein‐Protein‐Wechselwirkungen ist eine zentrale Aufgabe in der chemischen Biologie sowie in der Entdeckung und Entwicklung neuer Wirkstoffe. Anhand einer Bibliothek von N‐alkylierten aromatischen Oligoamiden wird gezeigt, dass Helixmimetika identifiziert werden können, die ihre biophysikalische Bindungsselektivität in einem zellulären Umfeld reproduzieren.WILEY-VCH.

Keywords: Apoptose; Foldamere; Helikale Strukturen; Peptidomimetika; Protein‐Protein‐Wechselwirkungen.


Figures

Figure 1
Figure 1
N‐alkylated helix mimetics. a) The p53 helix illustrating key side chains. b) Structures of principle compounds discussed in this work.
Figure 2
Figure 2
HCS summary for mimetic library. a) Example images of cells treated with five compounds (20 μm) and controls of 0.2 % DMSO and Nutlin‐3a (5 μm) scale=50 μm. DAPI staining is shown in the blue channel, caspase 3 is shown in red, LC3B antibody in yellow, F‐actin stained with AlexaFluor488 conjugated phalloidin shown in green. b) Heat map illustrating results of HCS. c) Summary of cellular toxicity of the mimetics added to U2OS (black) and SJSA‐1 (grey) cells at a concentration of 50 μm. d) Cells were treated with FITC‐labelled trimers and imaged using high‐content imaging and co‐stained with Toto‐3 iodide as a cytoplasmic stain. Scale=50 μm.
Figure 3
Figure 3
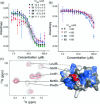
Biophysical analyses of helix mimetics. Dose‐response curves for the inhibition of the p53/hDM2 interaction measured by fluorescence anisotropy for a) 8, 31, 48, 64, and 67 and b) 9, 17, 32, and 62. c) 1H‐15N HSQC spectra of 15N‐labelled hDM2. Spectra was recorded in the absence (in black) and the presence (in red) of 64 (crosspeaks that move or change in volume are mapped onto the surface of hDM2 and shown in blue).
Figure 4
Figure 4
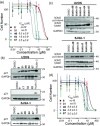
Cellular response to mimetics. a) Dose‐response curves based on analysis of cell number by nuclear staining from U2OS cells treated with different concentrations of mimetics. b) U2OS and SJSA‐1 cell lines were incubated with mimetics (50 μm) or Nutlin‐3 (10 μm) for 4 h and lysates analyzed by western blotting for p21 and GAPDH. c) U2OS and SJSA‐1 cells were treated with biotinylated mimetics (10 μm) for 4 h and cell lysates were subjected to Streptavidin pull‐down followed by analysis by western blotting for hDM2. d) Same as for (a) except for the use of Saos‐2 cells.
Figure 5
Figure 5
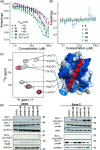
Bcl‐2 family binding properties of mimetics. Dose‐response curves of the inhibition of the a) Mcl‐1/NOXA‐B and b) Bcl‐xL/BAK interactions measured with fluorescence anisotropy. c) 1H‐15N HSQC spectra of 15N‐labelled Mcl‐1. Spectra recorded in the absence (in black) and presence (in red) of 64. Crosspeaks that move or change in volume are mapped onto the surface of Mcl‐1 and shown in blue. d) U2OS and Saos‐2 cells were treated with of biotinylated mimetics (10 μm) for 4 h and cell lysates were subjected to Streptavidin pull‐down followed by analysis by western blotting for Mcl‐1 or Bcl‐xL (GAPDH or actin used as loading controls).

References

    1. Milroy L.‐G., Grossmann T. N., Hennig S., Brunsveld L., Ottmann C., Chem. Rev. 2014, 114, 4695. - PubMed
    1. Stumpf M. P. H., Thorne T., de Silva E., Stewart R., An H. J., Lappe M., Wiuf C., Proc. Natl. Acad. Sci. USA 2008, 105, 6959. - PMC - PubMed
    1. Berg T., Angew. Chem. Int. Ed. 2003, 42, 2462; - PubMed
    2. Angew. Chem. 2003, 115, 2566.
    1. Yin H., Hamilton A. D., Angew. Chem. Int. Ed. 2005, 44, 4130; - PubMed
    2. Angew. Chem. 2005, 117, 4200.
    1. Wells J. A., McLendon C. L., Nature 2007, 450, 1001. - PubMed

LinkOut - more resources