

Minimizing tacrolimus decreases the risk of new-onset diabetes mellitus after liver transplantation
- PMID: 26877618
- PMCID: PMC4726686
- DOI: 10.3748/wjg.v22.i6.2133
Minimizing tacrolimus decreases the risk of new-onset diabetes mellitus after liver transplantation
Abstract
Aim: To investigate the impact of minimum tacrolimus (TAC) on new-onset diabetes mellitus (NODM) after liver transplantation (LT).
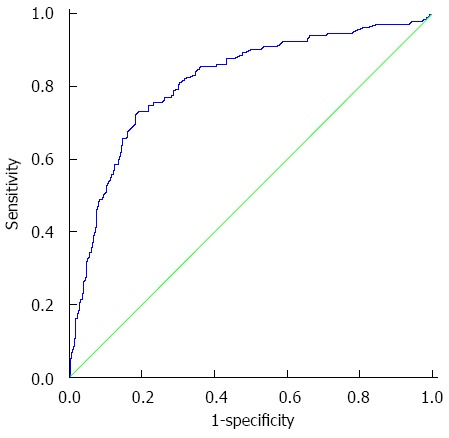
Methods: We retrospectively analyzed the data of 973 liver transplant recipients between March 1999 and September 2014 in West China Hospital Liver Transplantation Center. Following the exclusion of ineligible recipients, 528 recipients with a TAC-dominant regimen were included in our study. We calculated and determined the mean trough concentration of TAC (cTAC) in the year of diabetes diagnosis in NODM recipients or in the last year of the follow-up in non-NODM recipients. A cutoff of mean cTAC value for predicting NODM 6 mo after LT was identified using a receptor operating characteristic curve. TAC-related complications after LT was evaluated by χ(2) test, and the overall and allograft survival was evaluated using the Kaplan-Meier method. Risk factors for NODM after LT were examined by univariate and multivariate Cox regression.
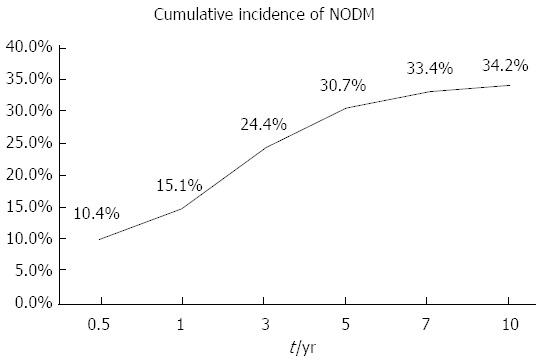
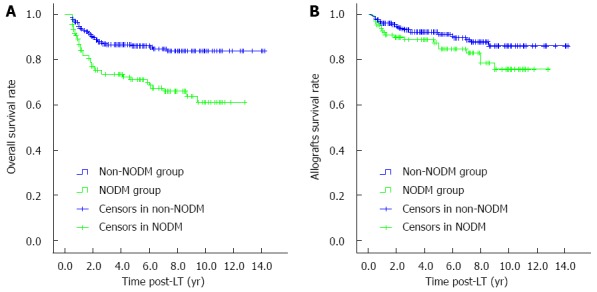
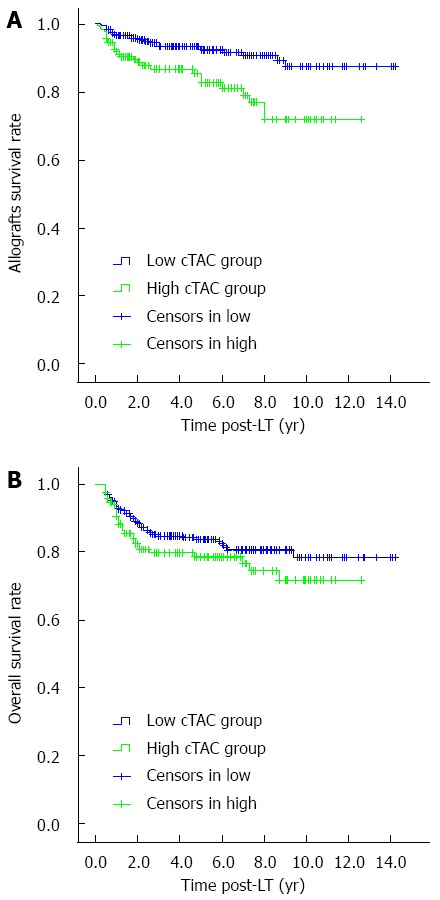
Results: Of the 528 transplant recipients, 131 (24.8%) developed NODM after 6 mo after LT, and the cumulative incidence of NODM progressively increased. The mean cTAC of NODM group recipients was significantly higher than that of recipients in the non-NODM group (7.66 ± 3.41 ng/mL vs 4.47 ± 2.22 ng/mL, P < 0.05). Furthermore, NODM group recipients had lower 1-, 5-, 10-year overall survival rates (86.7%, 71.3%, and 61.1% vs 94.7%, 86.1%, and 83.7%, P < 0.05) and allograft survival rates (92.8%, 84.6%, and 75.7% vs 96.1%, 91%, and 86.1%, P < 0.05) than the others. The best cutoff of mean cTAC for predicting NODM was 5.89 ng/mL after 6 mo after LT. Multivariate analysis showed that old age at the time of LT (> 50 years), hypertension pre-LT, and high mean cTAC (≥ 5.89 ng/mL) after 6 mo after LT were independent risk factors for developing NODM. Concurrently, recipients with a low cTAC (< 5.89 ng/mL) were less likely to become obese (21.3% vs 30.2%, P < 0.05) or to develop dyslipidemia (27.5% vs 44.8%, P <0.05), chronic kidney dysfunction (14.6% vs 22.7%, P < 0.05), and moderate to severe infection (24.7% vs 33.1%, P < 0.05) after LT than recipients in the high mean cTAC group. However, the two groups showed no significant difference in the incidence of acute and chronic rejection, hypertension, cardiovascular events and new-onset malignancy.
Conclusion: A minimal TAC regimen can decrease the risk of long-term NODM after LT. Maintaining a cTAC value below 5.89 ng/mL after LT is safe and beneficial.
Keywords: Allografts failure; Immunosuppressants; Liver transplantation; Minimum tacrolimus; New-onset diabetes mellitus.
Figures
References
-
- Adam R, McMaster P, O’Grady JG, Castaing D, Klempnauer JL, Jamieson N, Neuhaus P, Lerut J, Salizzoni M, Pollard S, et al. Evolution of liver transplantation in Europe: report of the European Liver Transplant Registry. Liver Transpl. 2003;9:1231–1243. - PubMed
-
- Bianchi G, Marchesini G, Marzocchi R, Pinna AD, Zoli M. Metabolic syndrome in liver transplantation: relation to etiology and immunosuppression. Liver Transpl. 2008;14:1648–1654. - PubMed
-
- Hanouneh IA, Feldstein AE, McCullough AJ, Miller C, Aucejo F, Yerian L, Lopez R, Zein NN. The significance of metabolic syndrome in the setting of recurrent hepatitis C after liver transplantation. Liver Transpl. 2008;14:1287–1293. - PubMed
-
- Laryea M, Watt KD, Molinari M, Walsh MJ, McAlister VC, Marotta PJ, Nashan B, Peltekian KM. Metabolic syndrome in liver transplant recipients: prevalence and association with major vascular events. Liver Transpl. 2007;13:1109–1114. - PubMed
-
- John PR, Thuluvath PJ. Outcome of patients with new-onset diabetes mellitus after liver transplantation compared with those without diabetes mellitus. Liver Transpl. 2002;8:708–713. - PubMed
Publication types
MeSH terms
Substances
LinkOut - more resources
Full Text Sources
Other Literature Sources
Medical
