Review
. 2016 Jan;7(1):23-41.
doi: 10.1002/wcc.380. Epub 2015 Dec 16.

Attribution of extreme weather and climate-related events

Affiliations
Review

Attribution of extreme weather and climate-related events

Peter A Stott et al. Wiley Interdiscip Rev Clim Change. 2016 Jan.

Abstract

Extreme weather and climate-related events occur in a particular place, by definition, infrequently. It is therefore challenging to detect systematic changes in their occurrence given the relative shortness of observational records. However, there is a clear interest from outside the climate science community in the extent to which recent damaging extreme events can be linked to human-induced climate change or natural climate variability. Event attribution studies seek to determine to what extent anthropogenic climate change has altered the probability or magnitude of particular events. They have shown clear evidence for human influence having increased the probability of many extremely warm seasonal temperatures and reduced the probability of extremely cold seasonal temperatures in many parts of the world. The evidence for human influence on the probability of extreme precipitation events, droughts, and storms is more mixed. Although the science of event attribution has developed rapidly in recent years, geographical coverage of events remains patchy and based on the interests and capabilities of individual research groups. The development of operational event attribution would allow a more timely and methodical production of attribution assessments than currently obtained on an ad hoc basis. For event attribution assessments to be most useful, remaining scientific uncertainties need to be robustly assessed and the results clearly communicated. This requires the continuing development of methodologies to assess the reliability of event attribution results and further work to understand the potential utility of event attribution for stakeholder groups and decision makers. WIREs Clim Change 2016, 7:23-41. doi: 10.1002/wcc.380 For further resources related to this article, please visit the WIREs website.


Figures

Figure 1
Figure 1
An illustration of the Probability Density Functions (PDFs) of a climatic variable with (solid red line) and without (green line) the effect of human influence on the climate. The corresponding probabilities of exceeding a prespecified threshold (P1 and P0) are represented by the hatched areas of the same color. The red‐dashed line illustrates how the PDF of the actual world may change in a changing climate.
Figure 2
Figure 2
Estimates of the fraction attributable risk (FAR) in the UK region (10°W–5°E, 48–60°N) over a range of temperature thresholds in units of standard deviation above the climatological (1961–1990) annual mean temperature. The colored area marks the 5–95% uncertainty range of the estimated FAR. The black vertical line corresponds to the UK record temperature.
Figure 3
Figure 3
Return time (years) for the maximum 4‐day precipitation average during May to June in the HadRM3P model for the upper Elbe catchment. The red dots indicate May to June possible 4‐day maximum precipitation events in a large ensemble of HadRM3P simulations of the year 2013, while the light blue dots indicate possible May to June 4‐day maximum precipitation events in 25 different large ensembles of simulations of the year 2013 as it might have been without climate change where each of the 25 ensembles has a different sea surface temperature (SST) pattern to represent the anthropogenic change in SSTs. The dark blue dots represent the 25 natural ensembles aggregated together. The error bars correspond to the 5–95% confidence interval estimated with a nonparametric bootstrap. (Reprinted with permission from Ref 35. Copyright 2014 American Meteorological Society)
Figure 4
Figure 4
Example of an analogue‐based approach. (a) Temperature mean anomalies of minimum daily temperature (Paris, Toulouse, and Besançon) between September 2006 and February 2007 (black line). Maxima of analogue temperatures (red line). (b) variations of the fraction of observed temperatures above all analogue temperatures between September and February. The red circle indicates the record of 2006/2007. The horizontal‐dashed lines indicate the quantile values of a binomial distribution that is fitted to an unperturbed period (1900–1960) and perturbed period (1970–2011).
Figure 5
Figure 5
Generalized extreme value (GEV) distribution fit to the coldest temperature of the year at Chicago Midway station 1928–2013 compared to the value observed in 2014. The distribution of the temperature is assumed to shift with the smoothed global mean temperature. The red lines indicate the fit for the climate of 2014, the blue lines indicate the fit for an earlier climate. The observations have been drawn twice, once shifted up with the fitted trend to the current climate, once down to the climate of 1951.
Figure 6
Figure 6
Evaluation assessments of HadGEM3‐A to determine whether the model is suitable for attribution studies of extreme winter rainfall events in the UK. (a) Reliability diagram for wet events in the UK, defined relative to terciles of the 1960–2010 climatology. (b) Normalized distributions of the winter rainfall in the UK during 1960–2010 produced with data from the National Center for Environmental Prediction/National Center for Atmospheric Research (NCEP/NCAR) reanalysis (red) and five HadGEM3‐A experiments (blue). (c) Power spectra corresponding to winter rainfall time series based on data from reanalysis (red) and five model simulations (blue). (d) Return time of winter rainfall events in the UK estimated with order statistics, or, for extreme thresholds, with the generalized Pareto distribution. Results plotted in red correspond to the NCEP/NCAR reanalysis and results plotted in blue to the five model simulations.
Figure 7
Figure 7
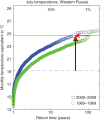
Return periods of temperature‐geopotential height conditions in the model for the 1960s (green) and the 2000s (blue) and in ERA‐Interim for 1979–2010 (black). The vertical black arrow shows the anomaly of the Russian heat wave 2010 (black horizontal line) compared to the July mean temperatures of the 1960s (dashed line). The vertical red arrow gives the increase in the magnitude of the heat wave due to the shift of the distribution whereas the horizontal red arrow shows the change in the return period.
Figure 8
Figure 8
Events considered in the three reports explaining extreme events of 2011, 2012, 2013 (Ref 17, 18, 19) indicating whether they are heat, cold, high precipitation, low precipitation or drought, storms, or sea‐ice events.
Figure 9
Figure 9
Time evolution of the frequency of summer temperature anomalies above 1.1°C, relative to the 1955–1984 mean, in the reconstructed observations (1955–2013) and in the observationally constrained projections (2014–2072) under RCP4.5 (plus) and RCP8.5 (cross) emission scenarios (left‐hand scale). The solid smooth curves are LOESS (local regression) fitting. The dashed curves represent projected ensemble mean temperature changes under the relevant emission scenarios (right‐hand scale) and are shown here for reference. Results for RCP4.5 and RCP8.5 are represented by red and green, respectively. (Reprinted with permission from 51. Copyright 2014 Nature Publishing Group)
Figure 10
Figure 10
Representation of a grounded theory of attribution in terms of causal chain and the potential interest in attribution by stakeholders.

References

    1. IPCC . Climate change 2013: The Physical Science basis. In: Stocker TF, Qin D, Plattner G‐K, Tignor M, Allen SK, Boschung J, Nauels A, Xia Y, Bex V, Midgley PM, eds. Contribution of Working Group I to the Fifth Assessment Report of the Intergovernmental Panel on Climate Change. Cambridge, United Kingdom and New York, NY: Cambridge University Press; 2013, 1535 pp.
    1. Hegerl GC, Hoegh‐Guldberg O, Casassa G, Hoerling M, Kovats S, Parmesan C, Pierce D, Stott P. Good practice guidance paper on detection and attribution related to anthropogenic climate change In: Stocker TF, Field C, Dahe Q, Barros V, Plattner G‐K, Tignor M, Pauline Midgley P, Ebi K, eds. Meeting Report of the Intergovernmental Panel on Climate Change Expert Meeting on Detection and Attribution of Anthropogenic Climate Change. IPCC Working Group I Technical Support Unit Bern: University of Bern; 2010, 8 pp.
    1. Stott PA, Allen M, Christidis N, Dole R, Hoerling M, Huntingford C, Pall P, Perlwitz J, Stone D. Attribution of weather and climate‐related extreme events In: Monograph: ‘Climate Science for Serving Society: Research, Modelling and Prediction Priorities.’ Position Paper for WCRP OSC. Accepted as part of monograph of position papers. Dordrecht, Netherlands: Springer; 2013, 307–337.
    1. Cubasch U, Wuebbles D, Chen D, Facchini MC, Frame D, Mahowald N, Winthur J‐G. Introduction In: Stocker TF, Qin D, Plattner G‐K, Tignor M, Alen SK, Boschung J, Nauels A, Xia Y, Bex V, Midgley PM, eds. Climate Change 2013: The Physical Science Basis. Contribution of Working Group I to the Fifth Assessment Report of the Intergovernmental Panel on Climate Change Cambridge and New York: Cambridge University Press; 2013, 119–158.
    1. Seneviratne SI, Luthi D, Litschi M, Schar C. Land–atmosphere coupling and climate change in Europe. Nature 2006, 443:205–209. - PubMed

LinkOut - more resources