. 2016 Jan 1;6(2):272-86.
doi: 10.7150/thno.13350. eCollection 2016.

In vivo MR and Fluorescence Dual-modality Imaging of Atherosclerosis Characteristics in Mice Using Profilin-1 Targeted Magnetic Nanoparticles

Affiliations

In vivo MR and Fluorescence Dual-modality Imaging of Atherosclerosis Characteristics in Mice Using Profilin-1 Targeted Magnetic Nanoparticles

Yabin Wang et al. Theranostics. .

Abstract

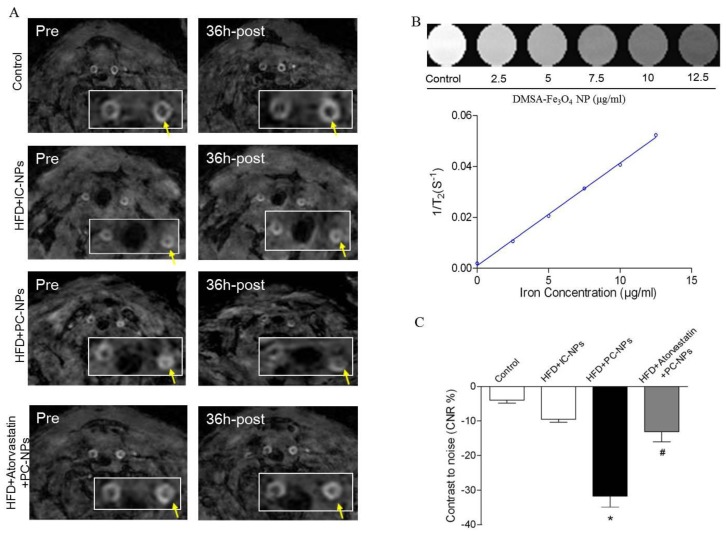
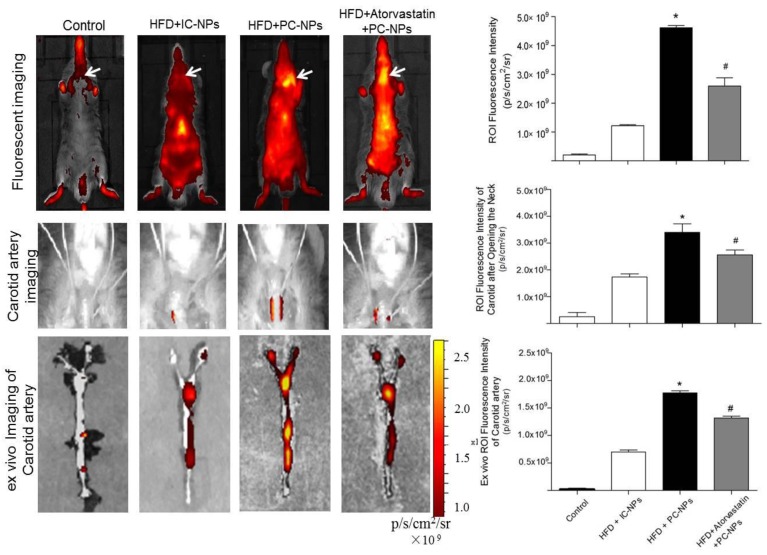
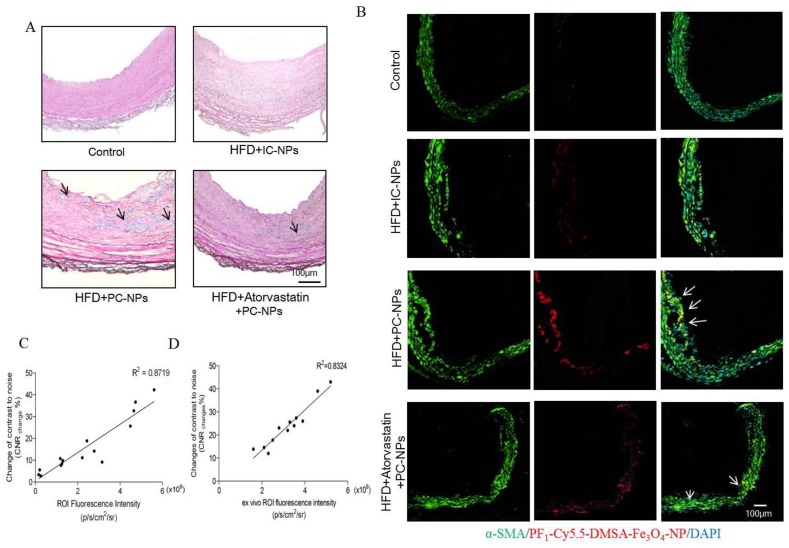
Aims: This study aims to explore non-invasive imaging of atherosclerotic plaque through magnetic resonance imaging (MRI) and near-infrared fluorescence (NIRF) by using profilin-1 targeted magnetic iron oxide nanoparticles (PF1-Cy5.5-DMSA-Fe3O4-NPs, denoted as PC-NPs) as multimodality molecular imaging probe in murine model of atherosclerosis.

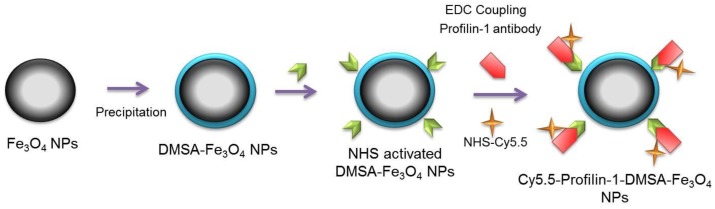
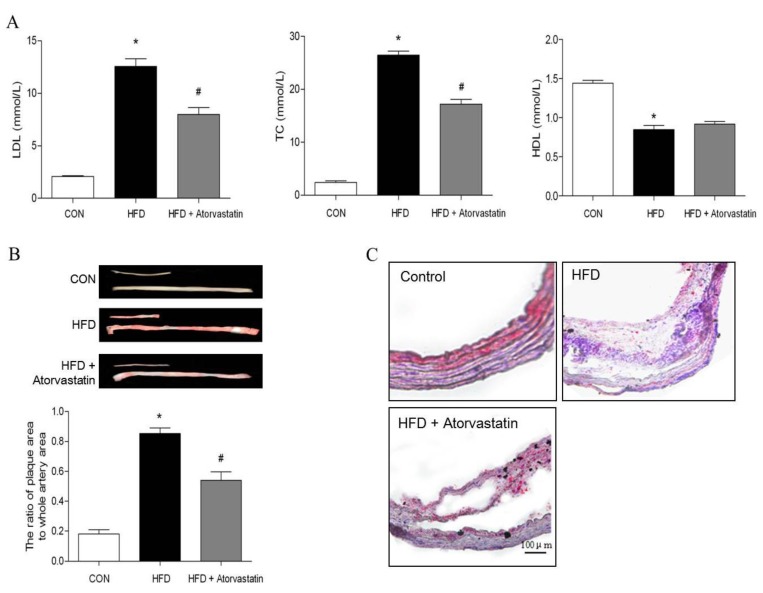
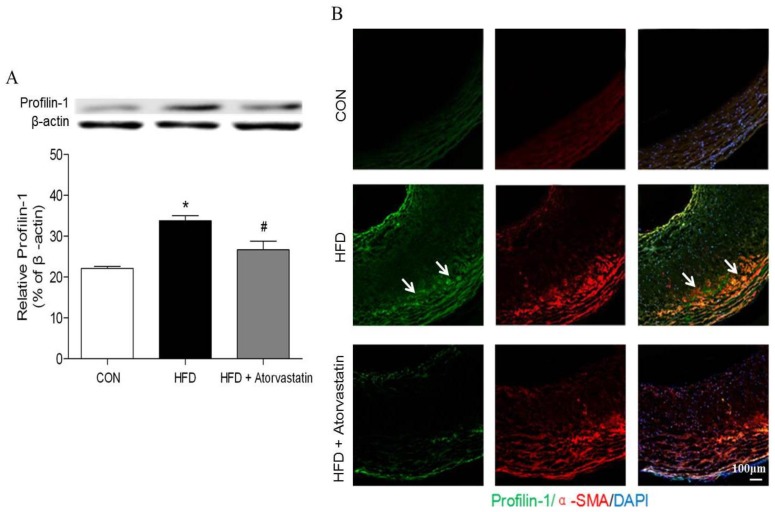
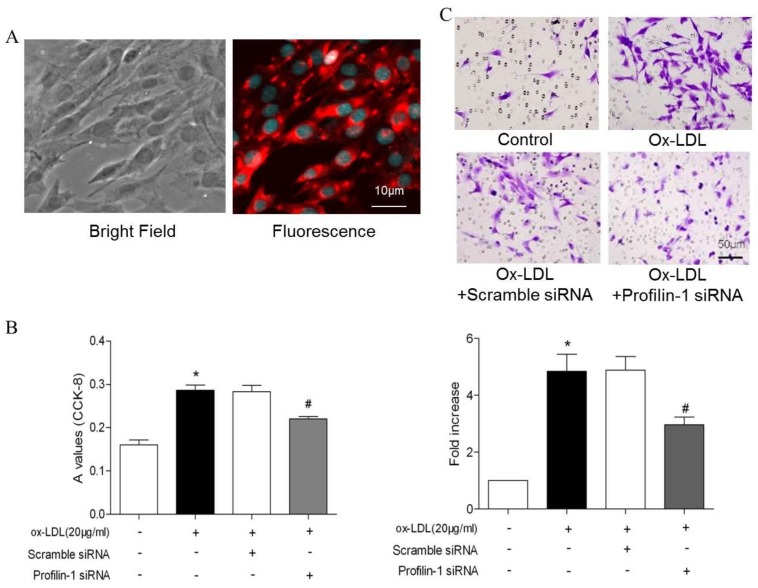
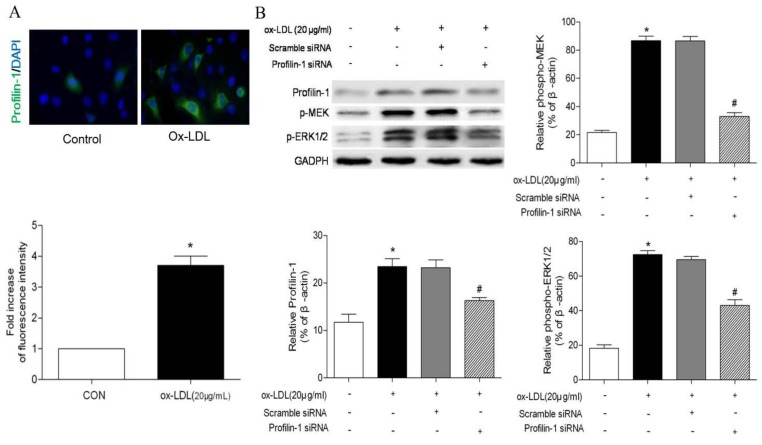
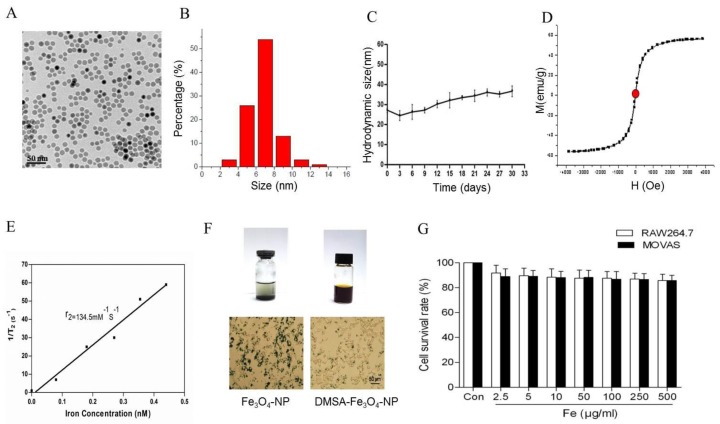
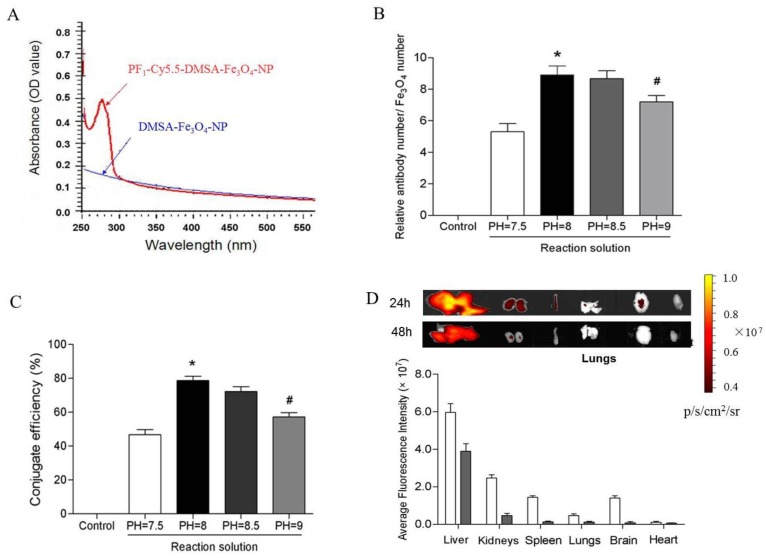
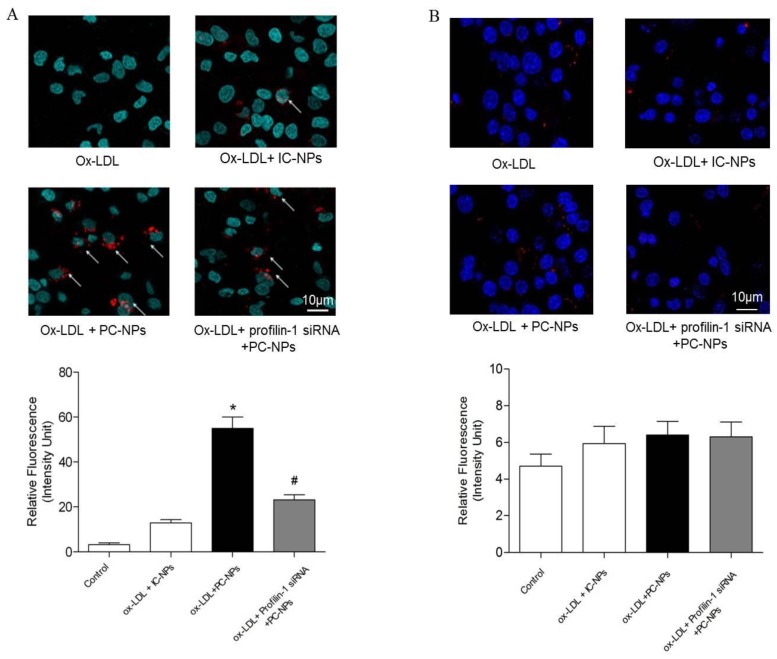
Methods and results: PC-NPs were constructed by conjugating polyclonal profilin-1 antibody and NHS-Cy5.5 fluorescent dye to the surface of DMSA-Fe3O4-nanoparticles via condensation reaction. Murine atherosclerosis model was induced in apoE(-/-) mice by high fat and cholesterol diet (HFD) for 16 weeks. The plaque areas in aortic artery were detected with Oil Red O staining. Immunofluorescent staining and Western blot analysis were applied respectively to investigate profilin-1 expression. CCK-8 assay and transwell migration experiment were performed to detect vascular smooth muscle cells (VSMCs) proliferation. In vivo MRI and NIRF imaging of atherosclerotic plaque were carried out before and 36 h after intravenous injection of PC-NPs. Oil Red O staining showed that the plaque area was significantly increased in HFD group (p<0.05). Immunofluorescence staining revealed that profilin-1 protein was highly abundant within plaque in HFD group and co-localized with α-smooth muscle actin. Profilin-1 siRNA intervention could inhibit VSMCs proliferation and migration elicited by ox-LDL (p<0.05). In vivo MRI and NIRF imaging revealed that PC-NPs accumulated in atherosclerotic plaque of carotid artery. There was a good correlation between the signals of MRI and ex vivo fluorescence intensities of NIRF imaging in animals with PC-NPs injection.

Conclusion: PC-NPs is a promising dual modality imaging probe, which may improve molecular diagnosis of plaque characteristics and evaluation of pharmaceutical interventions for atherosclerosis.

Keywords: Atherosclerosis; DMSA-Fe3O4-nanoparticles; Molecular imaging; Profilin-1.


Conflict of interest statement

Competing Interests: The authors have declared that no competing interest exists.

Figures

Scheme 1
Scheme 1
Schematic diagram of profiling-1-Cy5.5-DMSA- Fe3O4 nanoparticles
Figure 1
Figure 1
Atorvastatin decreased serum lipid level and atherosclerotic lesion formation induced by high-fat diet in apolipoprotein E-deficient (apoE-/-) mice. Serum LDL, total cholesterol and HDL were measured in apoE-/- mice fed on a high-fat diet for 16 weeks. (B) Oil Red O staining of the total length of carotid artery from different mice after 16-week HFD feeding, and subsequently quantitation of mean Oil Red O stained plaque area (n= 5 per group; *p<0.05 vs. control group, #p<0.05 vs. HFD group). (C) Tissue sections made of the atherosclerotic lesion-prone aortic root were stained for Oil Red O.
Figure 2
Figure 2
Atorvastatin attenuated profilin-1 expression in atherosclerotic plaque of apoE-/- mice. Western blot analysis was performed to assess profilin-1 expression in plaque (n= 5 per group; *p<0.05 vs. control group, #p<0.05 vs. HFD group). (B) Confocal microscopy of plaque from aortic vessel wall of apoE-/- mice with profilin-1(green), alpha-smooth muscle actin (alpha-SMA)(red). The nuclei were stained with 4,6-diamino-2-phenylindole (DAPI) (blue). The co-localization of green and red signals appeared as orange colors. Scar bar: 100 μm.
Figure 3
Figure 3
Effect of profilin-1 siRNA on VSMCs proliferation and migration induced by ox-LDL. (A) Morphology and immunofluorescence staining of VSMCs. (B) After 24 hours, VSMCs proliferation was detected by CCK-8 assay (n= 5 per group; *p<0.05 vs. control group, #p<0.05 vs. ox-LDL group). (C) After 24 hours, VSMCs migration was measured by transwell experiment. Ox-LDL (20μg/ml) was included in the lower chamber as chemo-attractant (n= 5 per group; *p<0.05 vs. control group, #p<0.05 vs. ox-LDL group).
Figure 4
Figure 4
Effect of profilin-1 siRNA on phosphorylation of MEK and ERK1/2 in VSMCs induced by ox-LDL. Profilin-1 expression (green fluorescence) in VSMCs was determined by confocal microscopy. (B) Phosphorylation of MEK and ERK1/2 in VSMCs induced by ox-LDL was evaluated by Western blot assay (n= 5 per group; *p<0.05 vs. control group, #p<0.05 vs. ox-LDL group).
Figure 5
Figure 5
Characterization of DMSA-Fe3O4 nanoparticles. TEM demonstrated roughly spherical, monodisperse nanoparticles with a mean diameter of 7 nm. (B) The size distribution of DMSA-Fe3O4 nanoparticles was detected by Zetasizer Nano ZS. (C) The magnetic properties of the samples were performed by a vibrating sample magnetometer. (D) The relaxivity (r2) of DMSA-MNPs. (E) Stability and biocompatibility of DMSA-Fe3O4 nanoparticles. (F) MOVAS and RAW264.7 cells survival were assessed by MTT assay.
Figure 6
Figure 6
Conjugation efficiency and in vivo tissue distribution of profilin-1-Cy5.5-DMSA-Fe3O4 nanoparticles. UV (ultraviolet)-Vis absorption spectroscopy analysis of profilin-1-Cy5.5-DMSA-Fe3O4 nanoprobe. (B) Relative ratio of profilin-1 antibody to Cy5.5-DMSA-Fe3O4 nanoparticles at different reaction solution. (n=3 per group;*p<0.05 vs. PH=7.5 reaction solution, #p<0.05 vs. PH=8 reaction solution). (C) Conjugate efficiency of profilin-1-Cy5.5-DMSA-Fe3O4 nanoparticles at different reaction solution. (D) Fluorescence imaging of in vivo tissue distribution of profilin-1-Cy5.5-DMSA-Fe3O4 nanoparticles at 24 and 48 h after probe injection.
Figure 7
Figure 7
Fluorescence imaging of profilin-1-Cy5.5-DMSA-Fe3O4 nanoparticles's binding ability to VSMCs and macrophages in vitro. Binding ability of profilin-1-Cy5.5-DMSA-Fe3O4 nanoparticles to VSMCs induced by ox-LDL in vitro. (n=5 per group; *p<0.05 vs. ox-LDL+Cy5.5-DMSA-Fe3O4 nanoparticles, #p<0.05 vs. ox-LDL + profilin-1 siRNA profilin-1-Cy5.5-DMSA-Fe3O4 nanoparticles). (B) Binding ability of profilin-1-Cy5.5-DMSA-Fe3O4 nanoparticles to macrophages induced by ox-LDL in vitro. (n=5 per group; p=NS).
Figure 8
Figure 8
Magnetic Resonance Imaging of ApoE-/- Mice with Profilin-1-Cy5.5-DMSA-Fe3O4 nanoparticles in vivo. Representative in vivo MR images obtained before and 36 h after administration of profilin-1-Cy5.5-DMSA-Fe3O4 nanoparticles in apoE-/- mice. (B) Standard curve generated by quantifying MRI 1/T2 value of known concentration of profilin-1-Cy5.5-DMSA-Fe3O4 nanoparticles. (C) Quantification analysis of MRI signal changes in carotid artery of apoE-/- mice before and 36 h after administration of profilin-1-Cy5.5-DMSA-Fe3O4 nanoparticles. (n=5 per group; *p<0.05 vs. HFD + Cy5.5-DMSA-Fe3O4 nanoparticles, #p<0.05 vs. HFD + atorvastatin treatment + profilin-1-Cy5.5-DMSA-Fe3O4 nanoparticles)
Figure 9
Figure 9
In vivo and ex vivo near-infrared fluorescent imaging of carotid atheromata of apoE-/- mice after the intravenous injection of probes. (A) In vivo fluorescence imaging of apoE-/- mice after intravenous injection of profilin-1-Cy5.5-DMSA-Fe3O4 nanoparticles. (n=5 per group; *p<0.05 vs. HFD + IgG-Cy5.5-DMSA-Fe3O4 nanoparticles, #p<0.05 vs. HFD + atorvastatin treatment + profilin-1-Cy5.5-DMSA-Fe3O4 nanoparticles). (B) In vivo fluorescence imaging of apoE-/- mice after opening the neck. (n=5 per group; *p<0.05 vs. HFD + IgG-Cy5.5-DMSA-Fe3O4 nanoparticles, #p<0.05 vs. HFD + atorvastatin treatment + profilin-1-Cy5.5-DMSA-Fe3O4 nanoparticles). (C) Ex vivo fluorescent imaging confirmed that profilin-1-Cy5.5-DMSA-Fe3O4 nanoparticles deposited in carotid artery. (n=5 per group; *p<0.05 vs. HFD + IgG-Cy5.5-DMSA-Fe3O4 nanoparticles, #p<0.05 vs. HFD + atorvastatin treatment + profilin-1-Cy5.5-DMSA-Fe3O4 nanoparticles).
Figure 10
Figure 10
Histology analysis confirmed that profilin-1-Cy5.5-DMSA-Fe3O4 nanoparticles deposited in atherosclerotic lesions. (A) Perl's staining confirmed that profilin-1-Cy5.5-DMSA-Fe3O4 nanoparticles deposited in atherosclerotic lesions. (B) Confocal immunofluorescence microscophy showed profilin-1-Cy5.5-DMSA-Fe3O4 nanoparticles colocalized with VSMCs marker α-SMA. (C) Correlations of MR images with in vivo Fluorescence images obtained 36 h after profilin-1-Cy5.5-DMSA-Fe3O4 nanoparticles injection. (D) Correlations of MR images with ex vivo Fluorescence images.

References

    1. Erbel R, Budoff M. Improvement of cardiovascular risk prediction using coronary imaging: subclinical atherosclerosis: the memory of lifetime risk factor exposure. European heart journal. 2012;33:1201–13. - PubMed
    1. Wang H, Eitzman DT. Acute myocardial infarction leads to acceleration of atherosclerosis. Atherosclerosis. 2013;229:18–22. - PMC - PubMed
    1. Foin N, Evans P, Krams R. Atherosclerosis: cell biology and lipoproteins - new developments in imaging of inflammation of the vulnerable plaque. Current opinion in lipidology. 2008;19:98–100. - PubMed
    1. Chan JM, Monaco C, Wylezinska-Arridge M, Tremoleda JL, Gibbs RG. Imaging of the vulnerable carotid plaque: biological targeting of inflammation in atherosclerosis using iron oxide particles and MRI. European journal of vascular and endovascular surgery: the official journal of the European Society for Vascular Surgery. 2014;47:462–9. - PubMed
    1. Wildgruber M, Swirski FK, Zernecke A. Molecular imaging of inflammation in atherosclerosis. Theranostics. 2013;3:865–84. - PMC - PubMed

Publication types

MeSH terms