. 2016 Mar 1;126(3):1012-22.
doi: 10.1172/JCI82012. Epub 2016 Feb 15.

Measles virus nucleocapsid protein increases osteoblast differentiation in Paget's disease

Measles virus nucleocapsid protein increases osteoblast differentiation in Paget's disease

Jumpei Teramachi et al. J Clin Invest. .

Abstract

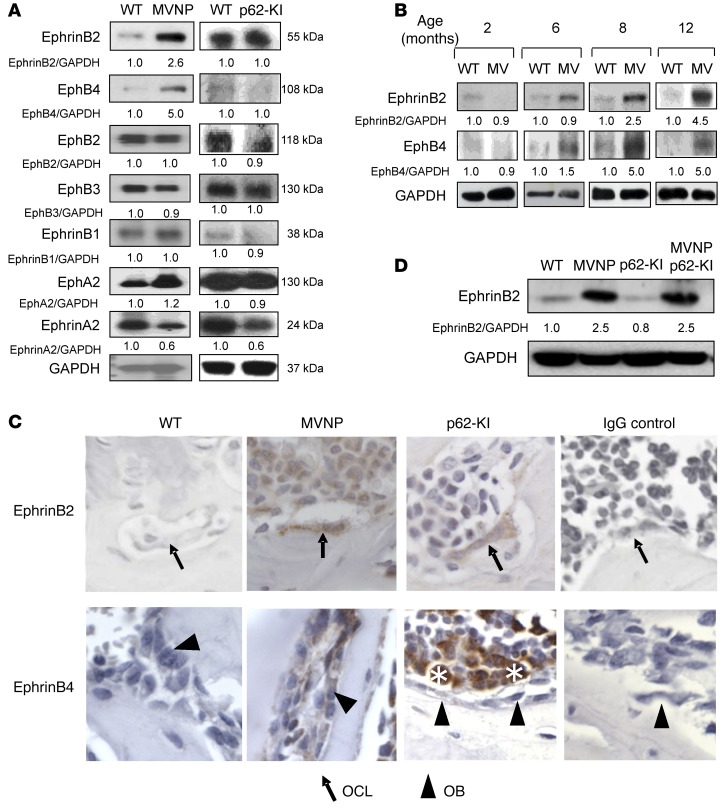
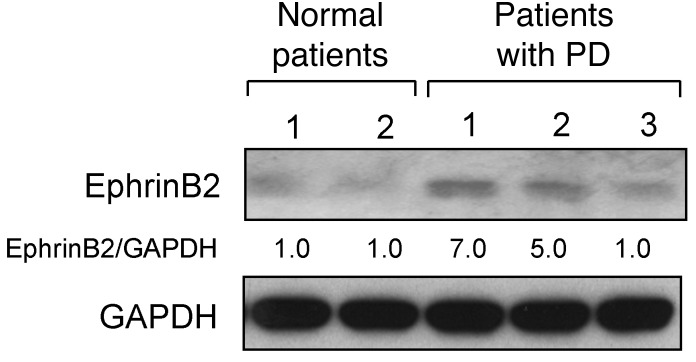
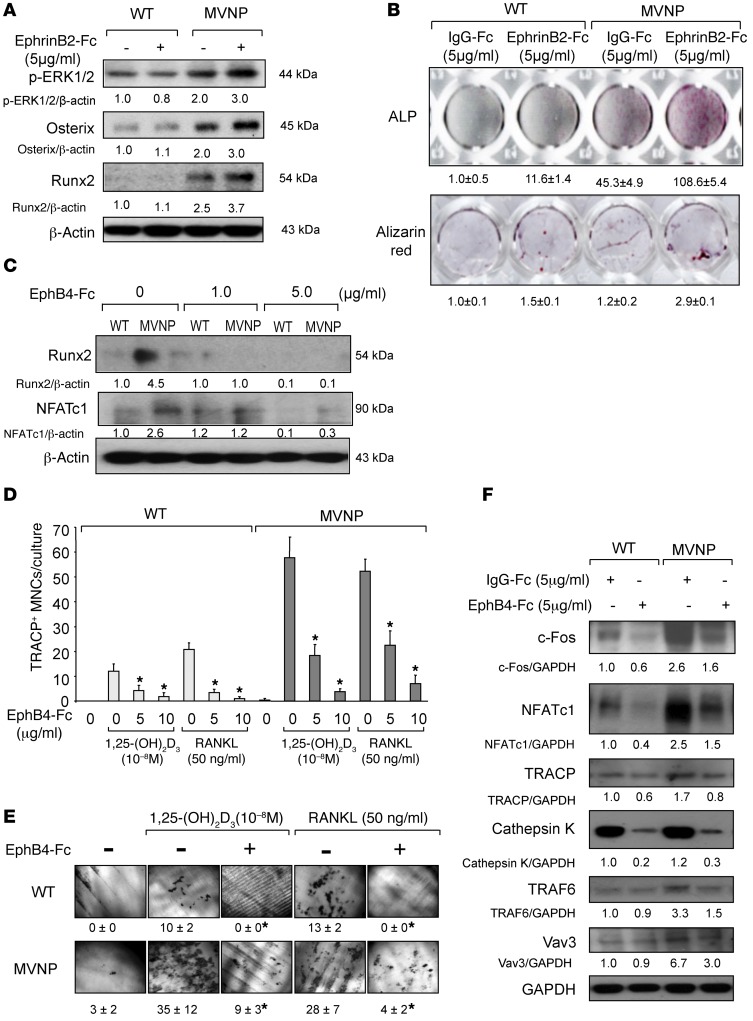
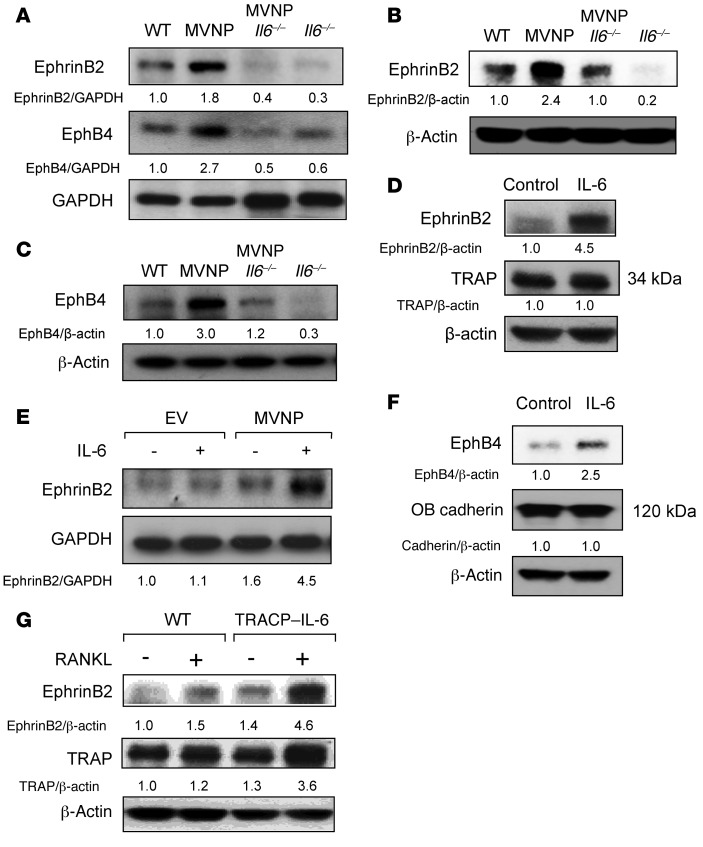
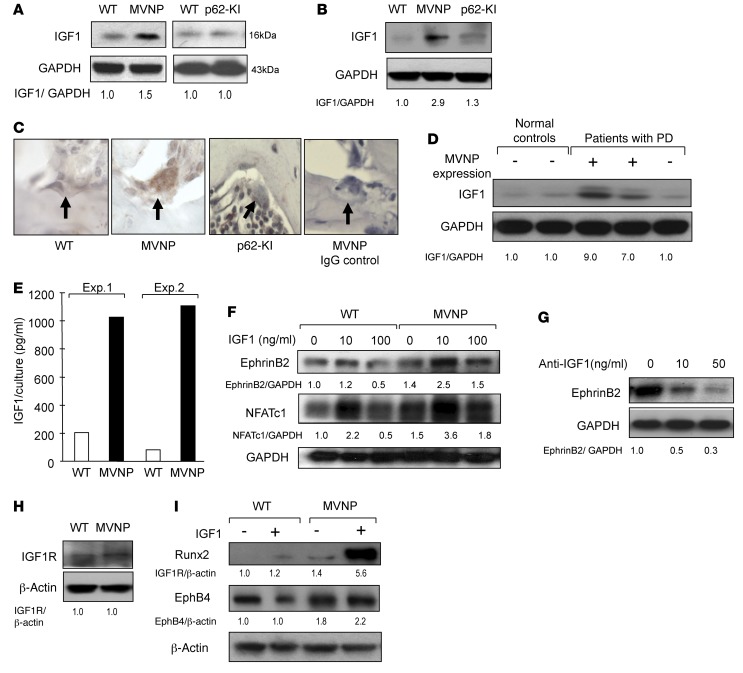
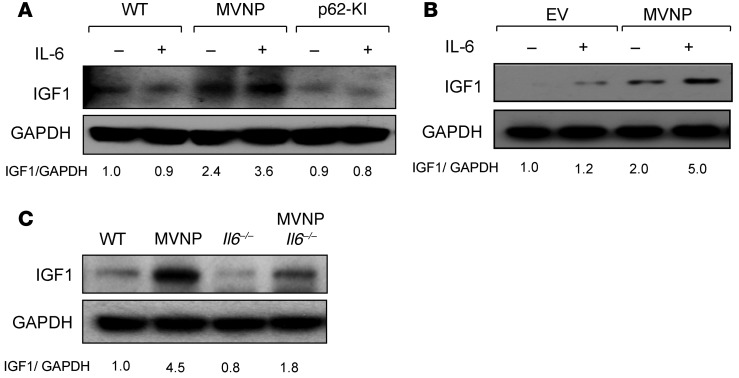
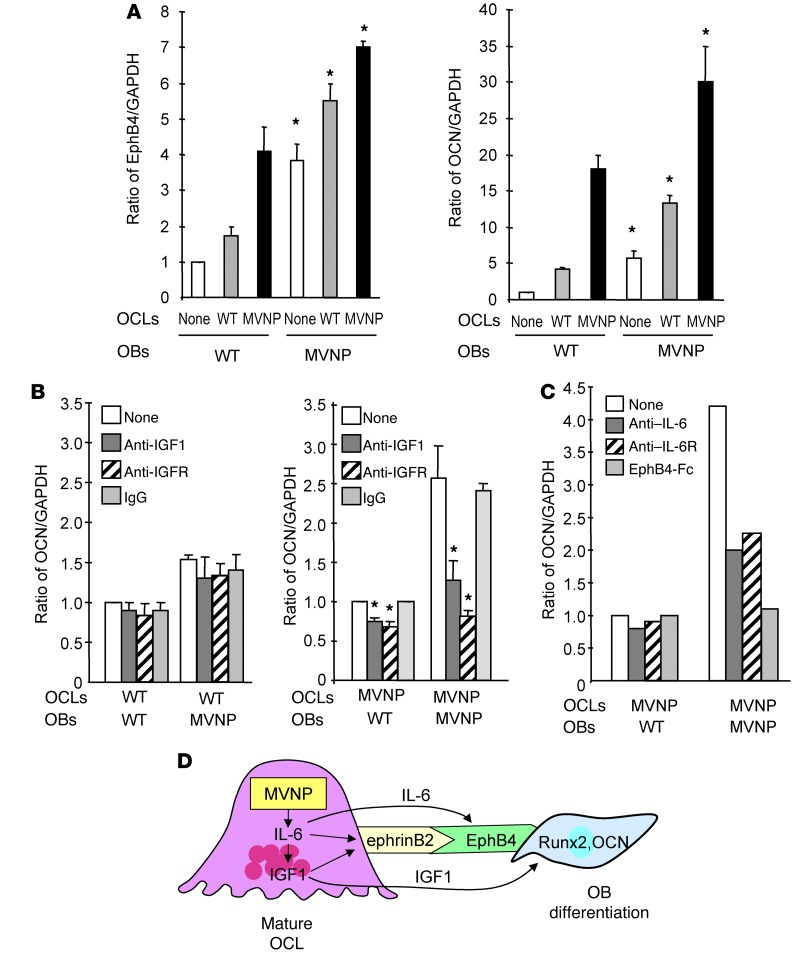
Paget's disease (PD) is characterized by focal and dramatic bone resorption and formation. Treatments that target osteoclasts (OCLs) block both pagetic bone resorption and formation; therefore, PD offers key insights into mechanisms that couple bone resorption and formation. Here, we evaluated OCLs from 3 patients with PD and determined that measles virus nucleocapsid protein (MVNP) was expressed in 70% of these OCLs. Moreover, transgenic mice with OCL-specific expression of MVNP (MVNP mice) developed PD-like bone lesions that required MVNP-dependent induction of high IL-6 expression levels in OCLs. In contrast, mice harboring a knockin of p62P394L (p62-KI mice), which is the most frequent PD-associated mutation, exhibited increased bone resorption, but not formation. Evaluation of OCLs from MVNP, p62-KI, and WT mice revealed increased IGF1 expression in MVNP-expressing OCLs that resulted from the high IL-6 expression levels in these cells. IL-6, in turn, increased the expression of coupling factors, specifically ephrinB2 on OCLs and EphB4 on osteoblasts (OBs). IGF1 enhanced ephrinB2 expression on OCLs and OB differentiation. Importantly, ephrinB2 and IGF1 levels were increased in MVNP-expressing OCLs from patients with PD and MVNP-transduced human OCLs compared with levels detected in controls. Further, anti-IGF1 or anti-IGF1R blocked Runx2 and osteocalcin upregulation in OBs cocultured with MVNP-expressing OCLs. These results suggest that in PD, MVNP upregulates IL-6 and IGF1 in OCLs to increase ephrinB2-EphB4 coupling and bone formation.


Figures

Figure 1
Figure 1. Expression of ephrins and Ephs in WT, MVNP, p62-KI, and MVNP p62-KI mice.
(A) Bone lysates from 8-month-old WT, MVNP, and p62-KI mice were assayed for ephrin and Eph protein expression. Results are representative of 3 biological replicates. (B) Bone lysates were obtained from 2- to 12-month-old mice and tested for ephrinB2 and EphB4 expression. Results are representative of 3 biological replicates. (C) Vertebral sections from 12-month-old mice were stained with anti-ephrinB2 and -EphB4 Abs as described in Methods. Results are representative of 3 to 7 biological replicates. OCLs from MVNP mice clearly stained for ephrinB2 compared with OCLs from p62-KI and WT mice, which showed minimal or negative staining. OBs from MVNP mice stained positively for EphB4 compared with OBs from WT and p62-KI mice. Scoring was based on staining intensity (positive or negative) and was performed by a blinded observer. Solid arrows point to OCLs, and arrowheads point to OBs. As previously reported, marrow cells (indicated by asterisks) also stained positively for EphB4 (33). Original magnification, ×400. (D) OCLs derived from cultures of CD11b+ cells from 8-month-old mice were assayed for ephrinB2 as described in Methods. Results are representative of 3 biological replicates. The basal ratio of every molecule/loading control is shown as 1.0 for WT samples in A, B, and D.
Figure 2
Figure 2. EphrinB2 expression in human OCLs from PD patients and normal donors.
Purified OCLs derived from peripheral blood MNCs from normal donors and patients with PD were assayed for ephrinB2 by Western blotting. We previously reported that OCLs from patients 1 and 2 expressed MVNP (13). Results are representative of a single experiment performed in triplicate.
Figure 3
Figure 3. Effects of ephrinB2-Fc or EphB4-Fc on OB and OCL differentiation.
(A) OB precursors from WT and MVNP mice were treated with ephrinB2-Fc for 4 days and analyzed for p-ERK1/2, osterix, and Runx2. (B) OBs from WT and MVNP mice were cultured with control-Fc or ephrinB2-Fc and stained for ALP or alizarin red (26). ALP and alizarin red staining was quantitated by ImageJ software. The values for cultures treated with IgG-Fc were set at 1. Original magnification, ×1. (C) Cocultures of OBs and OCLs from WT and MVNP mice were treated with EphB4-Fc for 3 days and then analyzed for Runx2 or NFATc1 expression. (D) CD11b+ cells from WT and MVNP mice were cultured with M-CSF, followed by 1,25-(OH)2D3 or RANKL and EphB4-Fc or IgG-Fc and stained for TRACP. Data represent the mean ± SD. *P < 0.01 compared with cultures with IgG-Fc using 1-way ANOVA. (E) Resorption pits formed on dentin slices by OCLs cultured with 1,25-(OH)2D3 or RANKL with or without EphB4-Fc. Original magnification, ×250. Data are expressed as the percentage of resorption area (mean ± SD; n = 4 technical replicates). *P < 0.01 compared with control cultures using a 2-tailed, unpaired Student’s t test. (F) CD11b+ cells were cultured with EphB4-Fc or control IgG-Fc as described in Methods. Cell lysates were analyzed for c-Fos, NFATc1, TRACP, cathepsin K, TRAF6, and Vav3. Protein expression levels in Figure 3 were compared with β-actin or GAPDH by densitometry. The value of the ratio obtained in lysates from untreated WT OCLs compared with β-actin or GAPDH was arbitrarily set at 1. Results for Figure 3 (except E) are representative of 3 biological replicates.
Figure 4
Figure 4. Effect of IL-6 on ephrinB2 and EphB4 expression by OCLs and OBs.
(A) Bone extracts were analyzed for ephrinB2 and EphB4 proteins. (B) OCLs from CD11b+ marrow cells from 8-month-old WT, MVNP, MVNP Il6–/–, and Il6–/– mice were analyzed for ephrinB2 expression. (C) Cell lysates from OBs derived from WT, MVNP, MVNP Il6–/–, and Il6–/– mice were prepared as previously described (26) and analyzed for EphB4 expression. (D) CD11b+ cells from WT mice were cultured with M-CSF for 3 days, treated with IL-6 for 4 days, and analyzed for ephrinB2 expression. (E) Human OCL precursors transduced with EV or MVNP, as previously described (34), were cultured with RANKL, then treated with IL-6 (10 ng/ml) for 3 days and tested for ephrinB2 expression. (F) OBs prepared as described previously (26) were treated with IL-6 for 3 days and then analyzed for EphB4 expression. (G) OCLs from CD11b+ cells of WT and TRACP–IL-6 mice were analyzed for ephrinB2 expression. The basal ratio of every molecule/loading control for vehicle treatment of WT cells was set at 1 in AG. All results are representative of 3 biological replicates.
Figure 5
Figure 5. Increased IGF1 expression by MVNP-expressing OCLs.
(A) Bone lysates were analyzed for IGF1 expression. (B) OCLs formed by CD11b+ cells from 8-month-old WT, MVNP, and p62-KI mice were analyzed for IGF1 expression. (C) Vertebral sections from 12-month-old WT, p62-KI, and MVNP mice were stained with anti-IGF1 or control IgG. Only OCLs from MVNP mice positively stained for IGF1. Original magnification, ×400. (D) IGF1 expression in OCLs from normal donors or patients with PD. The results shown in D are derived from the same gel shown in Figure 2. (E) IGF1 levels in OCL-conditioned media using an ELISA kit. Results represent the mean of 5 technical replicates from 2 biological replicates. (F) EphrinB2 and NFATc-1 expression in OCLs formed by CD11b+ cells treated with IGF1 for 4 days. (G) OCLs from PD patients were cultured with anti-IGF1 for 48 hours and the cell lysates assayed for ephrinB2 expression. (H) IGF1R expression on OCLs formed by CD11b+ cells were prepared as in B. (I) OBs were prepared as described previously (26), cultured with IGF1 for 3 days, and analyzed for EphB4 or Runx2 expression. Results for Figure 5 (except E) are representative of 3 biological replicates. The basal ratio of every molecule/loading control for vehicle treatment of WT cells was set at 1.0 in A, B, D, and FI. Staining of OCLs from MVNP and WT mice (scored as positive or negative) showed positive anti-IGF1 staining in OCLs from MVNP, but not WT, mice.
Figure 6
Figure 6. IL-6 increases IGF1 expression in MVNP-expressing OCLs.
(A) OCLs formed by CD11b+ cells from 8-month-old WT, MVNP, and p62-KI mice were treated with IL-6 (10 ng/ml) for 4 days and cell lysates analyzed for IGF1 expression. (B) OCLs from normal human OCL precursors transduced with EV or MVNP retroviral constructs were treated with IL-6 (10 ng/ml) for 4 days and assayed for IGF1 expression. Results shown in B are derived from the same gel shown in Figure 4E. (C) IGF1 expression by OCLs formed by CD11b+ cells from 8-month-old mice. The basal ratio of every molecule/loading control for vehicle treatment of WT cells was set at 1.0 in AC. Results are representative of 3 biological replicates.
Figure 7
Figure 7. EphB4 and OCN expression in OBs cocultured with OCLs from WT or MVNP mice.
(A) OCLs (2.5 × 10⁴/well) derived from MVNP or WT OCL precursors were cultured overnight with 50 ng/ml RANKL. OBs (1 × 10⁵/well), then plated on top of the OCLs and the cells cocultured for 72 hours. Lysates were tested for EphB4 and OCN expression. Data represent the mean ± SD for 3 biological replicates. *P < 0.01 compared with cocultures with WT OCLs using a 2-tailed, unpaired Student’s t test. (B) OCLs formed by WT or MVNP OCL precursors were prepared and cocultured with OBs for 72 hours as described in Figure 5A in the presence of anti-IGF1 (10 ng/ml), anti-IGF1R (0.5 μg/ml), or rabbit IgG (20 ng/ml), then assayed for OCN expression. The relative ratios of OCN/GAPDH were measured by ImageJ software. Data represent the mean ± SD for 3 biological replicates. *P < 0.01 compared with cultures with control IgG using a 2-tailed, unpaired Student’s t test. (C) OCLs formed by MVNP OCL precursors were cocultured with OBs for 72 hours (as described in Figure 5A) with anti–IL-6 (0.5 μg/ml), anti–IL-6R (0.5 μg/ml), or EphB4-Fc (5 μg/ml), then assayed for OCN expression. The relative ratios of OCN/GAPDH were measured by ImageJ software. Data are from a representative experiment of 2 biological replicates. (D) Model of OCL-OB coupling in PD: MVNP induces high IL-6 expression in OCLs, which increases expression of IGF1 and ephrinB2 in OCLs and EphB4 on OBs to enhance coupling. IGF1 enhances ephrinB2 expression on OCLs and increases Runx2 and OCN levels in OBs to increase bone formation.

References

    1. Basle M, Minard MF, Rebel A. [Structure and ultrastructure of osteoblasts and of the osteoid tissue in Paget’s disease of bone (author’s transl)] Pathol Biol (Paris) 1978;26(8):475–479. - PubMed
    1. Zajac AJ, Phillips PE. Paget’s disease of bone: clinical features and treatment. Clin Exp Rheumatol. 1985;3(1):75–88. - PubMed
    1. Rebel A, Malkani K, Basle M, Bregeon C. Osteoclast ultrastructure in Paget’s disease. Calcif Tissue Res. 1976;(2):187–199. - PubMed
    1. Roodman GD, Windle JJ. Paget disease of bone. J Clin Invest. 2005;115(2):200–208. doi: 10.1172/JCI24281. - DOI - PMC - PubMed
    1. Kukita A, Chenu C, McManus LM, Mundy GR, Roodman GD. Atypical multinucleated cells form in long-term marrow cultures from patients with Paget’s disease. J Clin Invest. 1990;85(4):1280–1286. doi: 10.1172/JCI114565. - DOI - PMC - PubMed

Publication types