. 2016 Mar 1;126(3):1023-38.
doi: 10.1172/JCI84505. Epub 2016 Feb 15.

Blocking mitochondrial calcium release in Schwann cells prevents demyelinating neuropathies

Blocking mitochondrial calcium release in Schwann cells prevents demyelinating neuropathies

Sergio Gonzalez et al. J Clin Invest. .

Erratum in

Retraction in

Expression of concern in

Abstract

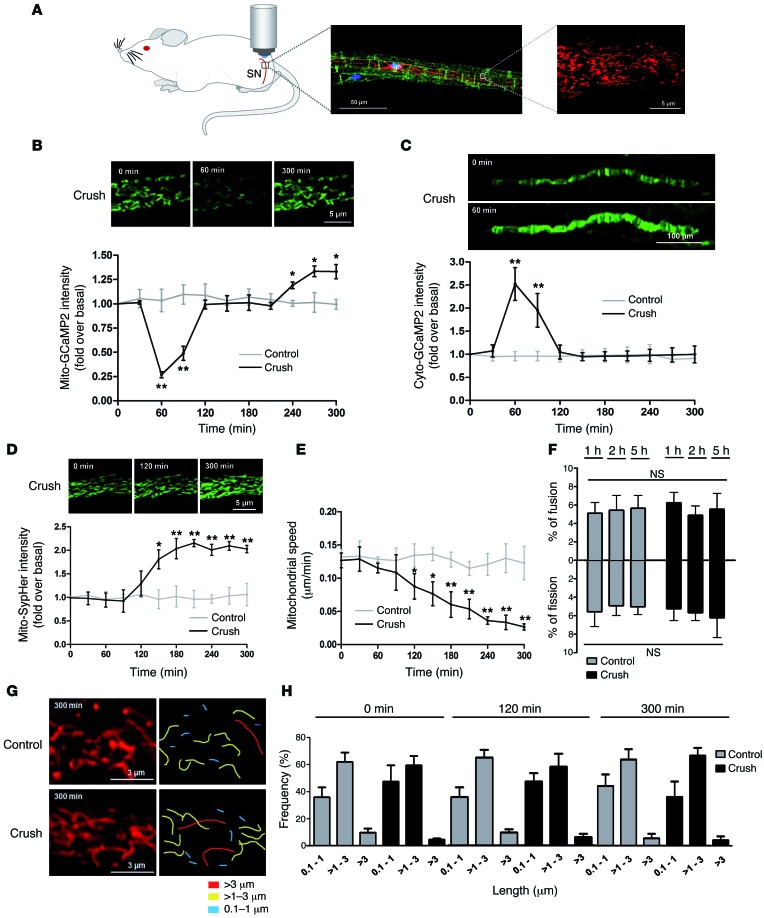
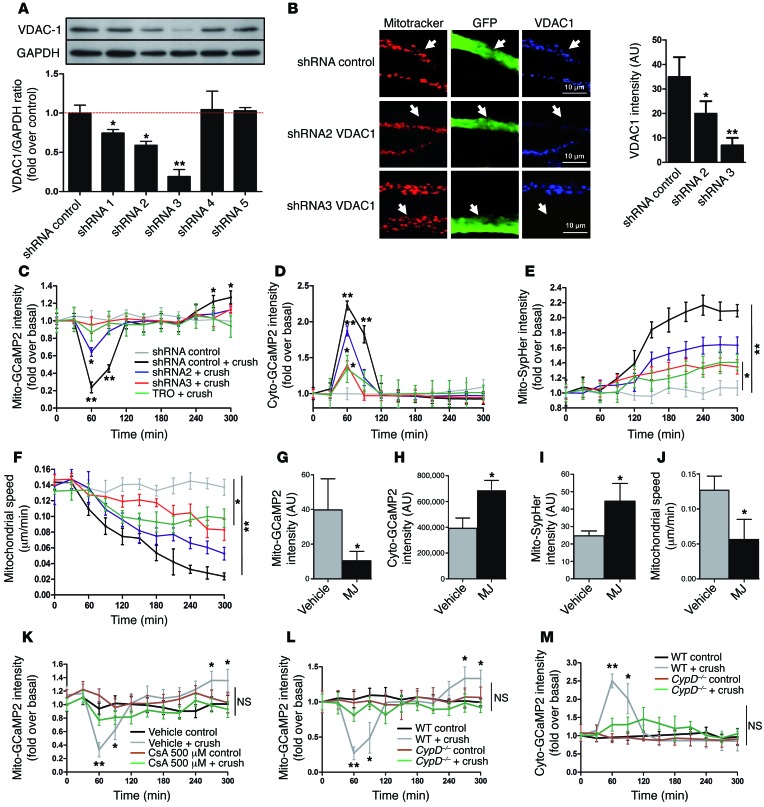
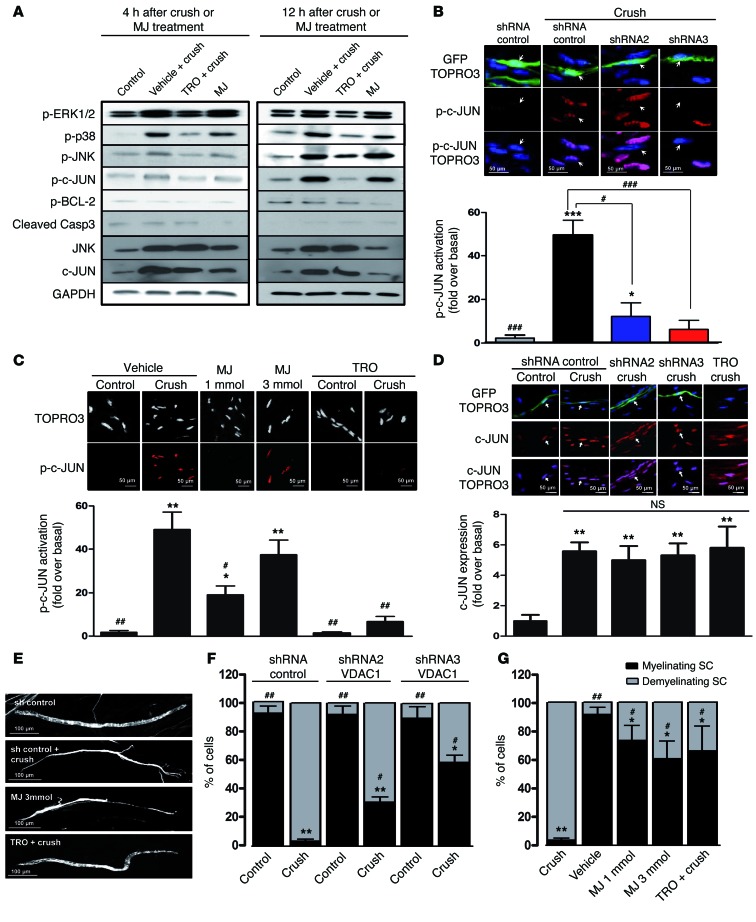
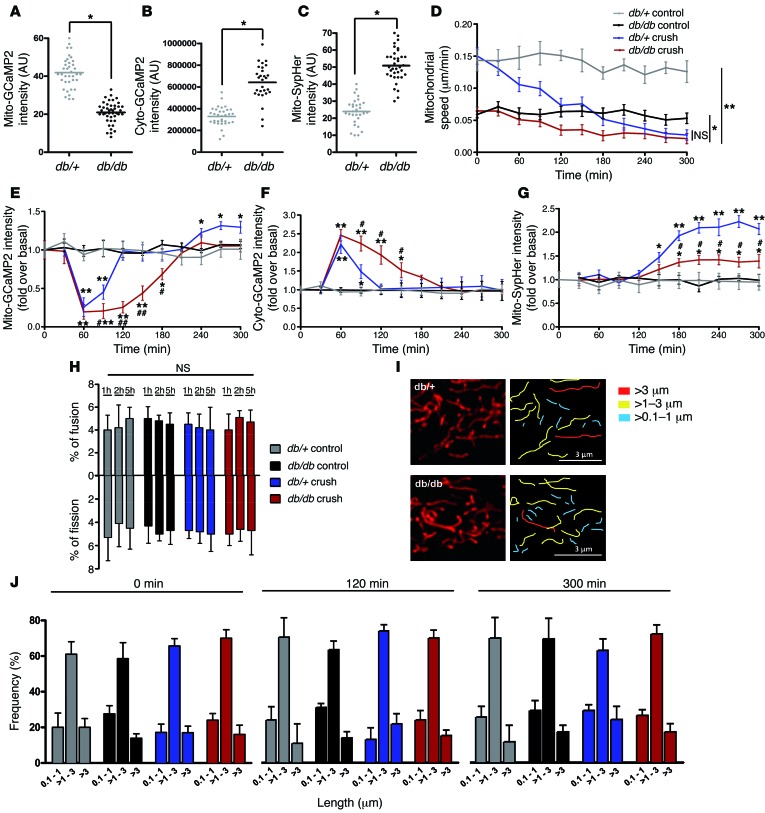
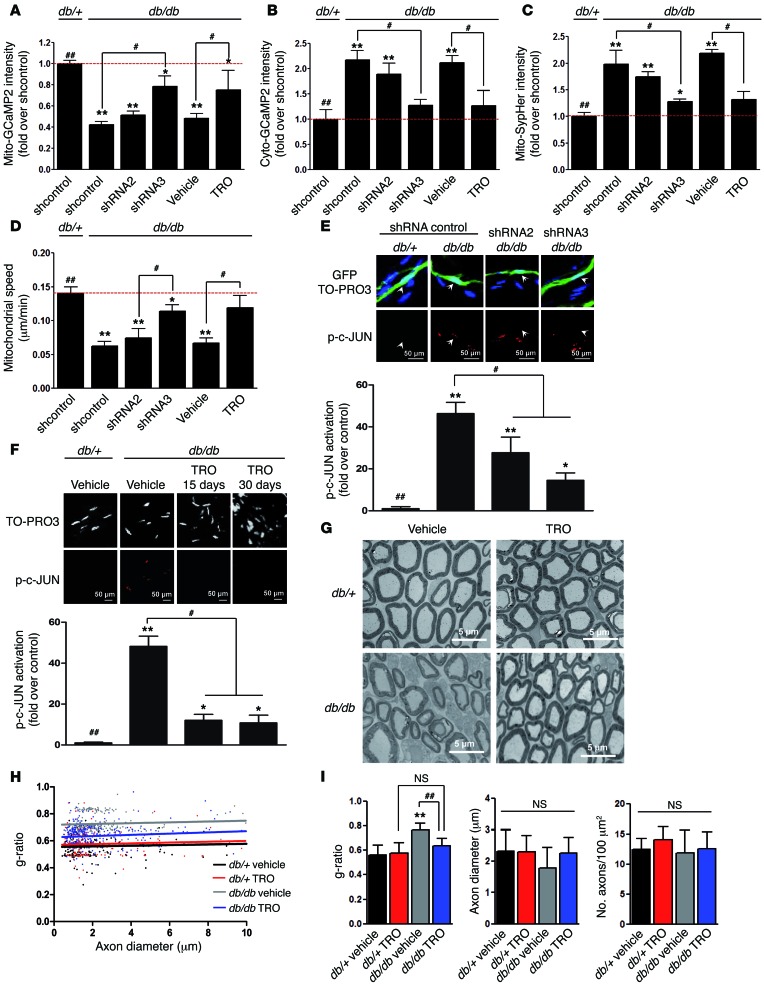
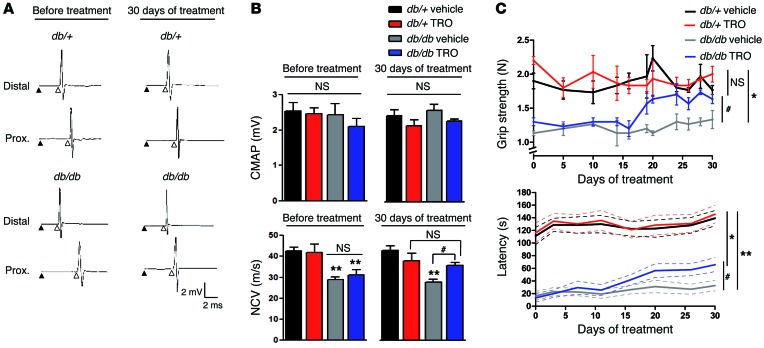
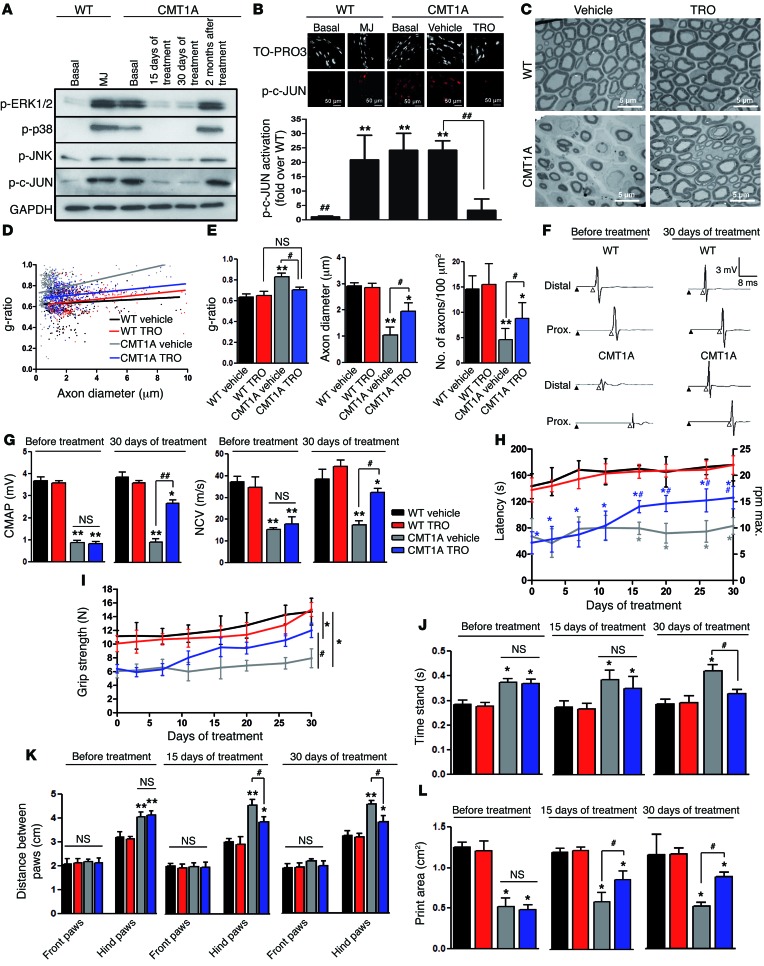
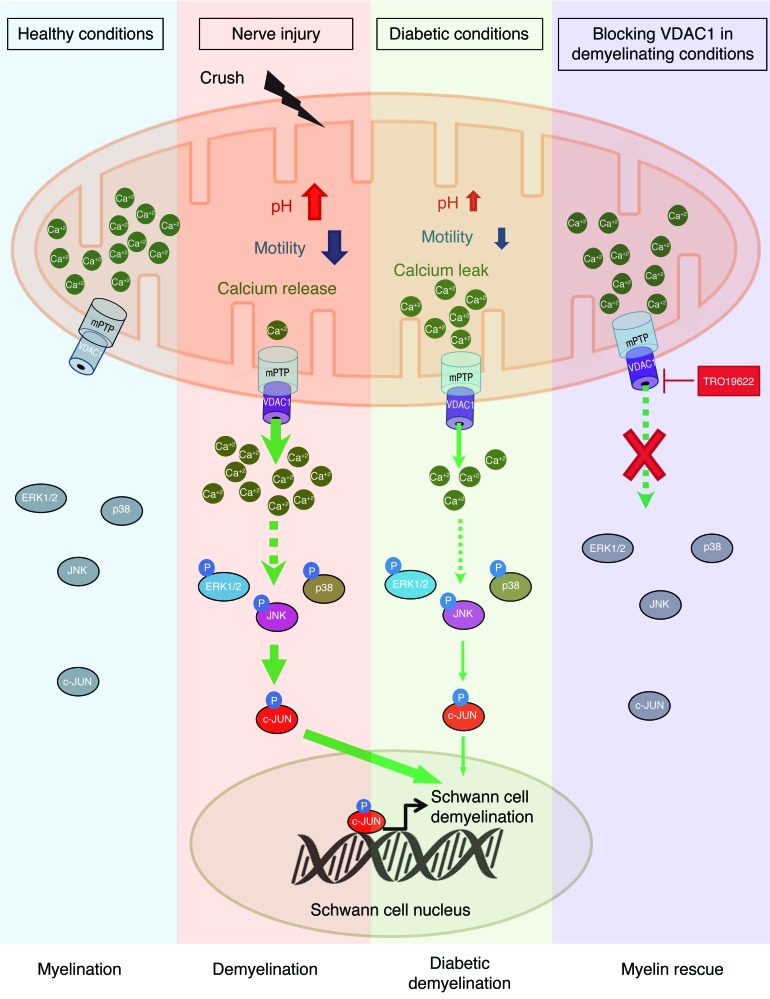
Schwann cells produce myelin sheath around peripheral nerve axons. Myelination is critical for rapid propagation of action potentials, as illustrated by the large number of acquired and hereditary peripheral neuropathies, such as diabetic neuropathy or Charcot-Marie-Tooth diseases, that are commonly associated with a process of demyelination. However, the early molecular events that trigger the demyelination program in these diseases remain unknown. Here, we used virally delivered fluorescent probes and in vivo time-lapse imaging in a mouse model of demyelination to investigate the underlying mechanisms of the demyelination process. We demonstrated that mitochondrial calcium released by voltage-dependent anion channel 1 (VDAC1) after sciatic nerve injury triggers Schwann cell demyelination via ERK1/2, p38, JNK, and c-JUN activation. In diabetic mice, VDAC1 activity was altered, resulting in a mitochondrial calcium leak in Schwann cell cytoplasm, thereby priming the cell for demyelination. Moreover, reduction of mitochondrial calcium release, either by shRNA-mediated VDAC1 silencing or pharmacological inhibition, prevented demyelination, leading to nerve conduction and neuromuscular performance recovery in rodent models of diabetic neuropathy and Charcot-Marie-Tooth diseases. Therefore, this study identifies mitochondria as the early key factor in the molecular mechanism of peripheral demyelination and opens a potential opportunity for the treatment of demyelinating peripheral neuropathies.


Figures

Figure 1
Figure 1. Mitochondrial physiology changes during SC demyelination.
(A) Schematic representation of the imaging technique (left). mSCs are labeled with E-cadherin (green), mitochondria are labeled with mito-dsRed2 (red), and the cell nucleus is labeled with DAPI (blue) (middle). Scale bar: 50 μm. Representative image of mitochondria imaged with a multiphoton microscope (right). Scale bar: 5 μm. SN, sciatic nerve. (B) Mitochondrial calcium amount (mito-GCaMP2), (C) cytoplasmic calcium amount (cyto-GCaMP2), (D) mitochondrial pH (mito-SypHer), and (E) mitochondrial motility (mito-dsRed2) in mSCs of control and crushed nerves. Probe intensities are represented as fold over basal conditions (before crush), and motility is represented as μm traveled in 1 minute over 300 minutes of time-lapse acquisition. Representative images of labeled mitochondria. Scale bar: 5 μm (B and D); 100 μm (C). (F) Ratio of mitochondrial fusion and fission events in control and crushed nerves. (G) Representative images of mSC mitochondria and mitochondrial length quantification in control and crushed nerves after 300 minutes of time-lapse imaging. Scale bar: 3 μm. (H) Frequency histogram of mitochondrial length in control and crush conditions. No significant difference was found. Data are expressed as the mean ± SEM. n = 3–6 mice for each group. Asterisks mark statistical differences compared with noncrushed nerves. *P < 0.05, **P < 0.01, 2-tailed Student’s t test.
Figure 2
Figure 2. VDAC1 controls mitochondrial calcium release during demyelination.
(A) VDAC1 shRNA validation in vitro. Mouse MSC80 cells were transfected with plasmids expressing VDAC1 shRNAs, and VDAC1 protein amounts were quantified by Western blot. GAPDH was used as loading control. n = 4 independent experiments. (B) AAV-expressing VDAC1 shRNA 2 or 3 or control shRNA together with GFP (green, white arrows) was injected in mouse sciatic nerve (left). Cells expressing VDAC1 shRNAs express less VDAC1 (blue) in their mitochondria (red) than noninfected surrounding cells or cells expressing control shRNA. Scale bar: 10 μm. Quantification of VDAC1 fluorescence intensity in infected cells (right). (C) Mitochondrial calcium, (D) cytoplasmic calcium, (E) mitochondrial pH, or (F) mitochondrial motility changes in mSCs expressing control shRNA in control conditions (gray) or after crush (black) or expressing VDAC1 shRNAs 2 (blue) or 3 (red) after crush or treatment with TRO19622 (TRO) before crush (green). Asterisks mark statistical differences compared with noncrushed nerve. Quantification of (G) mitochondrial calcium, (H) cytoplasmic calcium, (I) mitochondrial pH, or (J) mitochondrial motility in mSCs 2 hours after vehicle or MJ treatment (3 mmol). (K) Mitochondrial calcium changes in mice treated with vehicle or 500 μM CsA 30 minutes before crush or in control conditions (noncrushed mice). (L) Mitochondrial calcium and (M) cytoplasmic calcium changes of WT and CypD–/– mice after crush or control conditions. Data are expressed as the mean ± SEM. n = 3–8 mice for each group. Asterisks mark statistical differences over control conditions (noncrushed nerve). *P < 0.05, **P < 0.01, 2-tailed Student’s t test, compared with noncrushed nerves.
Figure 3
Figure 3. Mitochondrial calcium release through VDAC1 induces SC demyelination.
(A) Western blot analysis of phosphorylated ERK1/2, p38, JNK, c-JUN, BCL-2, cleaved caspase-3, total JNK, and c-JUN 4 hours or 12 hours after crush, with or without TRO19622 treatment or without crush but with MJ treatment. GAPDH was used as loading control. Blots are from samples run on parallel gels. n = 3–4 mice for each group. (B and C) Immunohistochemistry for nuclear phospho–c-JUN in mSCs of crushed or noncrushed control nerves after (B) VDAC1 silencing or (C) MJ or TRO19622 treatment. Mice were treated with TRO19622 intraperitoneally for 4 days before crush and via nerve injection 30 minutes before crush or treated with MJ via nerve injection 30 minutes before crush. Nerves were analyzed 12 hours after crush or injection. Representative images are shown. mSCs are stained for nuclei (TOPRO3, blue or white) and phospho–c-JUN (red), and infected cells express GFP (green). Arrows indicate infected mSC nuclei. Scale bar: 50 μm. Quantification of fluorescence intensity as fold over noncrushed nerve (basal). (D) Immunohistochemistry for total c-JUN in mSCs after VDAC1 silencing (shRNA) or blocking (TRO19622) and crush. Arrows indicate VDAC1 shRNA–infected mSC nuclei. Scale bar: 50 μm Quantification of total c-JUN represented as fold over basal (noncrushed mice). Noninfected neighbor cells were used as internal controls. (E) Representative images of myelinating and demyelinating SCs expressing GFP after crush or drug treatments. Scale bar: 100 μm. Quantification of myelinating and demyelinating SC frequency after (F) VDAC1 silencing and (G) MJ and TRO19622 treatment. Data are expressed as the mean ± SEM. n = 3–5 mice for each group. Asterisks and pound signs mark statistical differences compared with noncrushed and crushed nerves, respectively. *P < 0.05, #P < 0.05, **P < 0.01, ##P < 0.01, ***P < 0.001, ###P < 0.001, 2-tailed Student’s t test.
Figure 4
Figure 4. Mitochondrial physiology is altered in SCs of db/db diabetic mice.
(A) Mitochondrial calcium, (B) cytoplasmic calcium concentration, and (C) mitochondrial pH in mSCs of control (db/+) and diabetic (db/db) mice in basal conditions. (D) Mitochondrial motility, (E) mitochondrial calcium, (F) cytoplasmic calcium concentration, and (G) mitochondrial pH changes after crush or in control noncrushed conditions in mSCs of control and diabetic mice. (H) Ratio of mitochondrial fusion and fission events in mSCs of control and diabetic mice in crushed or control noncrushed conditions. (I) Representative images of mSC mitochondria (left panels) and mitochondrial length quantification (right panels) of control and diabetic mice after 300 minutes of time-lapse imaging acquisition. Scale bar: 3 μm. (J) mSC mitochondrial length frequency of control and diabetic mice in crushed or control conditions at different time points. No significant difference was found between control (db/+) and diabetic (db/db) mice. Data are expressed as the mean ± SEM. n = 3–6 mice. Asterisks and pound signs mark statistical differences compared with noncrushed control mice and crushed control mice, respectively. *P < 0.05, #P < 0.05, **P < 0.01, ##P < 0.01, 2-tailed Student’s t test.
Figure 5
Figure 5. VDAC1 silencing and inhibition prevent SC mitochondrial anomalies and improve the phenotype of diabetic mice.
(A) Mitochondrial calcium, (B) cytoplasmic calcium, (C) mitochondrial pH, and (D) motility in mSCs of diabetic mice (db/db) in basal conditions are partially corrected during VDAC1 silencing or blocking. Immunohistochemistry for phospho–c-JUN in mSCs of control and diabetic mice after (E) VDAC1 silencing or (F) TRO19622 treatment. Arrows indicate infected mSC nuclei. Scale bar: 50 μm. Quantification of nuclear phospho–c-JUN represented as fold over control mice (db/+). Noninfected neighbor cells were used as internal controls. (G) Representative transmission electron micrograph images of sciatic nerve cross sections of control (db/+) and diabetic (db/db) mice after vehicle or TRO19622 treatment. Scale bar: 5 μm. (H) Scatterplot showing the g-ratio plotted against the axon diameter of control and diabetic mice treated with vehicle or TRO16922 for 30 days. (I) Average myelin g-ratio, axonal diameter, and number of myelinated axons in sciatic nerves of control and diabetic mice described in H. A minimum of 200 fibers was measured per animal. *P < 0.05, #P < 0.05, **P < 0.01, ##P < 0.01, 1-way ANOVA followed by a Dunnett’s multiple comparison post-hoc test.
Figure 6
Figure 6. VDAC1 inhibition improves the phenotype of diabetic mice.
(A) Representative electrophysiological traces of sciatic nerve recording after distal and proximal stimulation of control and diabetic mice before and after TRO19622 treatment. The stimulus artifact (black arrowhead) and the onset of CMAP (white arrowhead) are shown. (B) Quantification of the CMAP and NCV from A. (C) Grip strength and rotarod latency of control and diabetic mice treated with vehicle or TRO19622. Data are expressed as the mean ± SEM. n = 12 mice for each group. Asterisks and pound signs mark statistical differences compared with control (db/+) mice and vehicle-treated diabetic mice, respectively. *P < 0.05, #P < 0.05, **P < 0.01, 1-way ANOVA followed by a Dunnett’s multiple comparison post-hoc test.
Figure 7
Figure 7. Blocking VDAC1 activity prevents demyelination and improves neuromuscular performance in the CMT1A rat model.
(A) Sciatic nerve Western blot analysis of WT and CMT1A rats in basal conditions, WT rats treated with MJ, and CMT1A rats treated with TRO19622 for 15 or 30 days or 2 months after ending treatment. GAPDH was used as loading control. n = 3 rats for each treatment. (B) Immunohistochemistry for phospho–c-JUN in mSCs of WT and CMT1A rats in basal conditions, WT rats treated with MJ, and CMT1A rats treated with vehicle or TRO19622 for 30 days. Scale bar: 50 μm. Quantification of phospho–c-JUN intensity. n = 3–6 rats for each treatment. (C) Representative transmission electron micrograph images of sciatic nerve cross sections of WT and CMT1A rats after vehicle or TRO19622 treatment. Scale bar: 5 μm. (D) Scatterplot showing the g-ratio plotted against the axon diameter of sciatic nerve fibers from WT and CMT1A rats after vehicle or TRO16922 treatment. n = 3 rats for each group. (E) Average myelin g-ratio, axonal diameter, and myelinated axon number in WT and CMT1A rats described in D. (F) Representative electrophysiological traces of sciatic nerve recording after stimulation of WT and CMT1A rats before and after TRO19622 treatment. Stimulus artifact (black arrowhead) and CMAP onset (white arrowhead) are shown. (G) Quantification of CMAP and NCV from F. (H) Accelerating rotarod latency, (I) grip strength, (J) time animals stand on each of their paws (time stand), (K) distance between paws, and (L) paw area of WT and CMT1A rats during vehicle or TRO19622 treatments. n = 6–10 rats for each group. Data are expressed as mean ± SEM. Asterisks and pound signs mark statistical differences compared with control and CMT1A rats treated with vehicle, respectively. *P < 0.05, #P < 0.05, **P < 0.01, ##P < 0.01, 1-way ANOVA followed by a Dunnett’s multiple comparison post-hoc test.
Figure 8
Figure 8. A graphical summary of the mitochondrial molecular mechanism of SC demyelination.
After nerve injury (crush), mitochondria release calcium through VDAC1, leading to an increase of mitochondrial pH and a decrease of mitochondrial motility. mPTP formation is also required for the mitochondrial calcium release. This release of calcium induces phospho-ERK1/2, phospho-p38, phospho-JNK, and phospho–c-JUN activation, leading to SC demyelination. In diabetic conditions, this mechanism is altered and mitochondria leak calcium, which primes SCs for demyelination. However, blocking VDAC1-forming mPTP activity using TRO19622 treatment induces inhibition of calcium release and the demyelination molecular pathway, allowing myelin sheath rescue.

Similar articles

Cited by

References

    1. Nave KA. Myelination and support of axonal integrity by glia. Nature. 2010;468(7321):244–252. doi: 10.1038/nature09614. - DOI - PubMed
    1. Sherman DL, Brophy PJ. Mechanisms of axon ensheathment and myelin growth. Nat Rev Neurosci. 2005;6(9):683–690. doi: 10.1038/nrn1743. - DOI - PubMed
    1. Hughes RA. Peripheral neuropathy. BMJ. 2002;324(7335):466–469. doi: 10.1136/bmj.324.7335.466. - DOI - PMC - PubMed
    1. Zochodne DW. Diabetic polyneuropathy: an update. Curr Opin Neurol. 2008;21(5):527–533. doi: 10.1097/WCO.0b013e32830b84cb. - DOI - PubMed
    1. Zenker J, Ziegler D, Chrast R. Novel pathogenic pathways in diabetic neuropathy. Trends Neurosci. 2013;36(8):439–449. doi: 10.1016/j.tins.2013.04.008. - DOI - PubMed

Publication types

MeSH terms