

A low-carbohydrate high-fat diet increases weight gain and does not improve glucose tolerance, insulin secretion or β-cell mass in NZO mice
- PMID: 26878317
- PMCID: PMC4775822
- DOI: 10.1038/nutd.2016.2
A low-carbohydrate high-fat diet increases weight gain and does not improve glucose tolerance, insulin secretion or β-cell mass in NZO mice
Abstract
Background/objectives: Dietary guidelines for the past 20 years have recommended that dietary fat should be minimized. In contrast, recent studies have suggested that there could be some potential benefits for reducing carbohydrate intake in favor of increased fat. It has also been suggested that low-carbohydrate diets be recommended for people with type 2 diabetes. However, whether such diets can improve glycemic control will likely depend on their ability to improve β-cell function, which has not been studied. The objective of the study was to assess whether a low-carbohydrate and therefore high-fat diet (LCHFD) is beneficial for improving the endogenous insulin secretory response to glucose in prediabetic New Zealand Obese (NZO) mice.
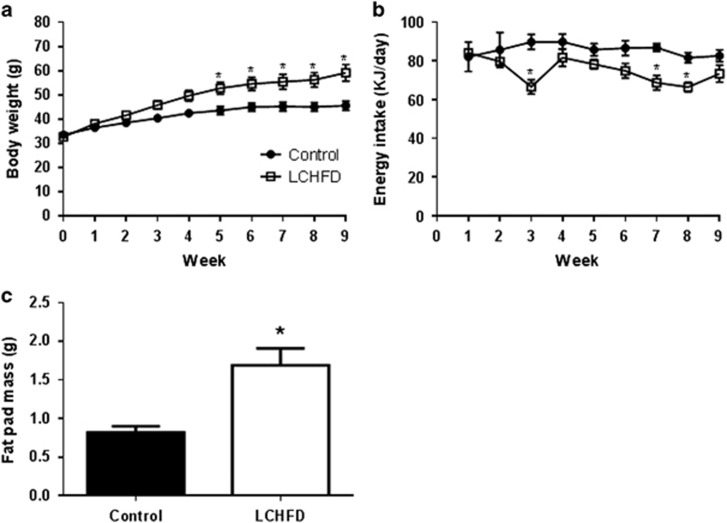
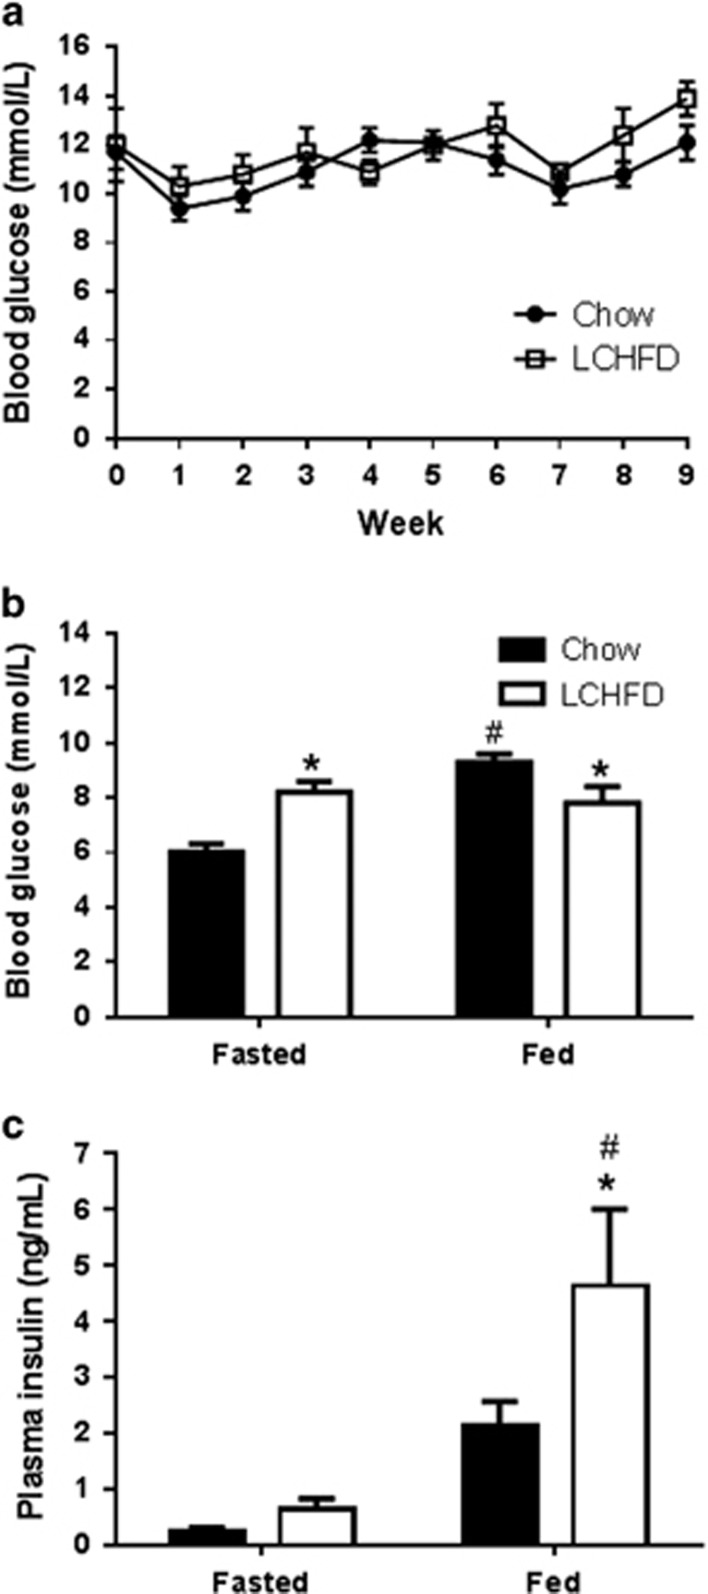
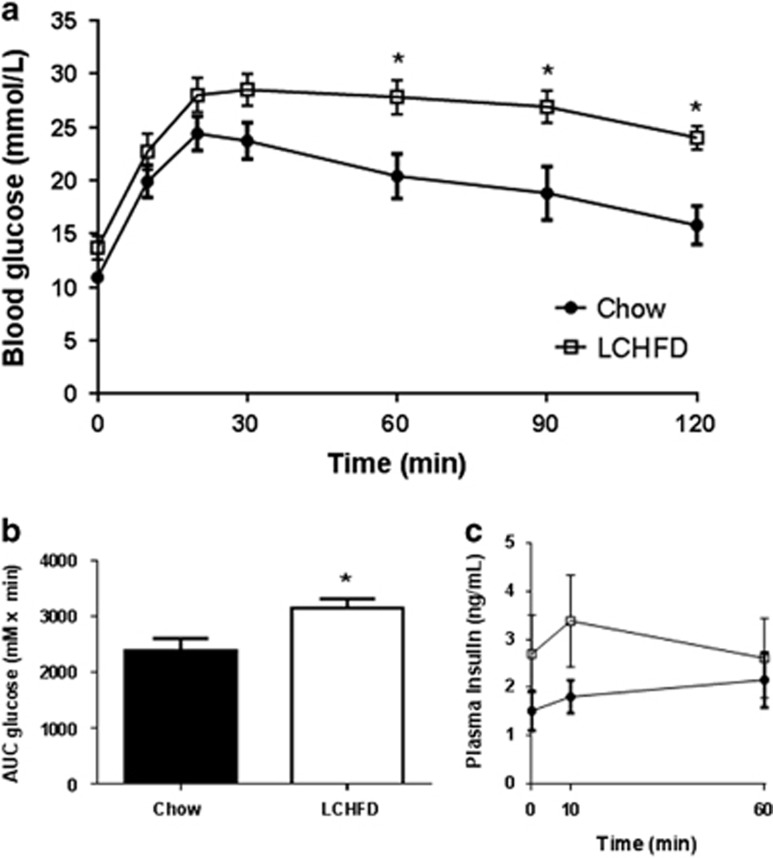
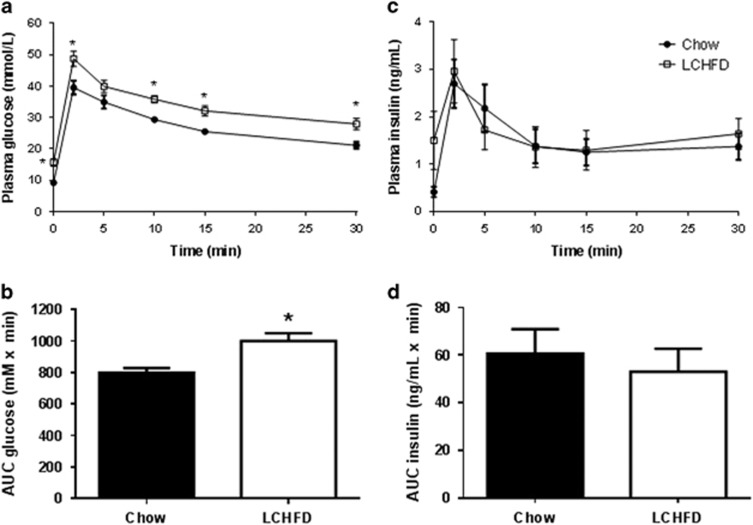
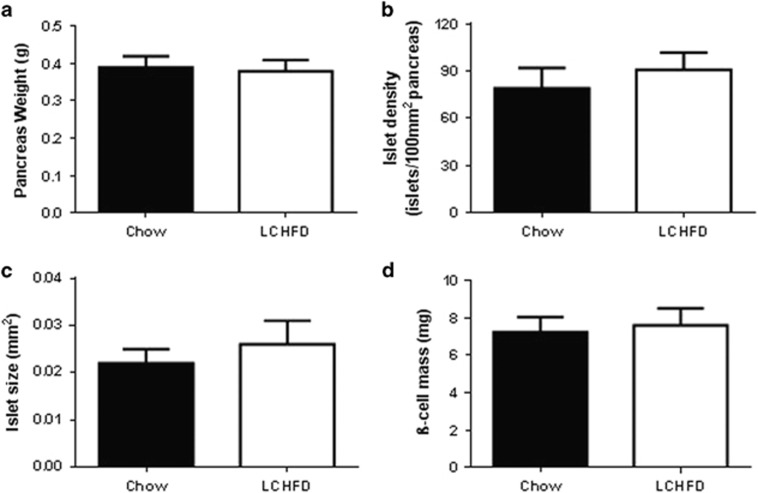
Methods: NZO mice were maintained on either standard rodent chow or an LCHFD from 6 to 15 weeks of age. Body weight, food intake and blood glucose were assessed weekly. Blood glucose and insulin levels were also assessed after fasting and re-feeding and during an oral glucose tolerance test. The capacity of pancreatic β-cells to secrete insulin was assessed in vivo with an intravenous glucose tolerance test. β-Cell mass was assessed in histological sections of pancreata collected at the end of the study.
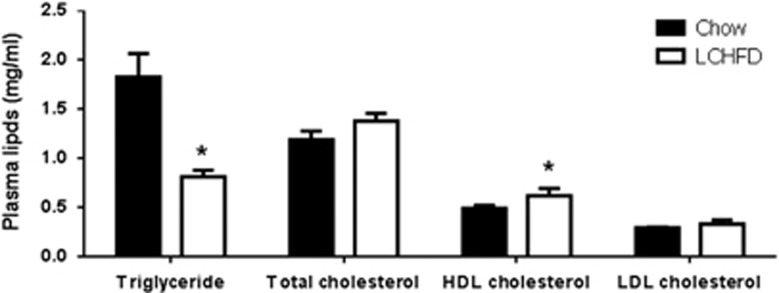
Results: In NZO mice, an LCHFD reduced plasma triglycerides (P=0.001) but increased weight gain (P<0.0001), adipose tissue mass (P=0.0015), high-density lipoprotein cholesterol (P=0.044) and exacerbated glucose intolerance (P=0.013). Although fasting insulin levels tended to be higher (P=0.08), insulin secretory function in LCHFD-fed mice was not improved (P=0.93) nor was β-cell mass (P=0.75).
Conclusions: An LCHFD is unlikely to be of benefit for preventing the decline in β-cell function associated with the progression of hyperglycemia in type 2 diabetes.
Figures
Comment in
-
Methodological problems with the test of the Paleo diet by Lamont et al. (2016).Nutr Diabetes. 2016 Jun 27;6(6):e214. doi: 10.1038/nutd.2016.22. Nutr Diabetes. 2016. PMID: 27348202 Free PMC article. No abstract available.
-
What are we to think when results from mouse research contradict those from human experiments and clinical practice?Nutr Diabetes. 2016 Aug 15;6(8):e224. doi: 10.1038/nutd.2016.31. Nutr Diabetes. 2016. PMID: 27525819 Free PMC article. No abstract available.
References
-
- Foster GD, Wyatt HR, Hill JO, McGuckin BG, Brill C, Mohammed BS et al. A randomized trial of a low-carbohydrate diet for obesity. N Engl J Med 2003; 348: 2082–2090. - PubMed
-
- Brinkworth GD, Noakes M, Buckley JD, Keogh JB, Clifton PM. Long-term effects of a very-low-carbohydrate weight loss diet compared with an isocaloric low-fat diet after 12 mo. Am J Clin Nutr 2009; 90: 23–32. - PubMed
-
- Samaha FF, Iqbal N, Seshadri P, Chicano KL, Daily DA, McGrory J et al. A low-carbohydrate as compared with a low-fat diet in severe obesity. N Engl J Med 2003; 348: 2074–2081. - PubMed
-
- Shai I, Schwarzfuchs D, Henkin Y, Shahar DR, Witkow S, Greenberg I et al. Weight loss with a low-carbohydrate, Mediterranean, or low-fat diet. N Engl J Med 2008; 359: 229–241. - PubMed
-
- Feinman RD, Pogozelski WK, Astrup A, Bernstein RK, Fine EJ, Westman EC et al. Dietary carbohydrate restriction as the first approach in diabetes management: critical review and evidence base. Nutrition 2015; 31: 1–13. - PubMed
Publication types
MeSH terms
Substances
LinkOut - more resources
Full Text Sources
Other Literature Sources
Medical
Miscellaneous
