. 2016 Apr;13(4):325-8.
doi: 10.1038/nmeth.3770. Epub 2016 Feb 15.

Simultaneous fast measurement of circuit dynamics at multiple sites across the mammalian brain

Affiliations

Simultaneous fast measurement of circuit dynamics at multiple sites across the mammalian brain

Christina K Kim et al. Nat Methods. 2016 Apr.

Abstract

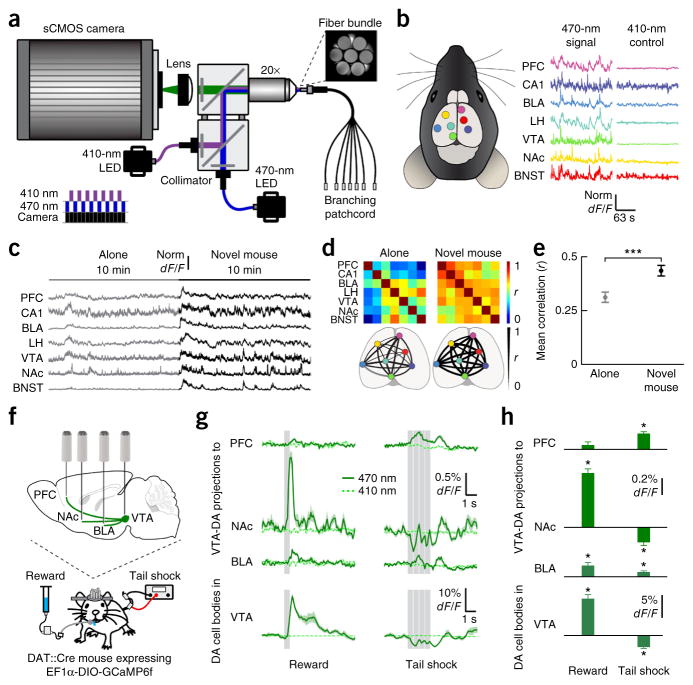
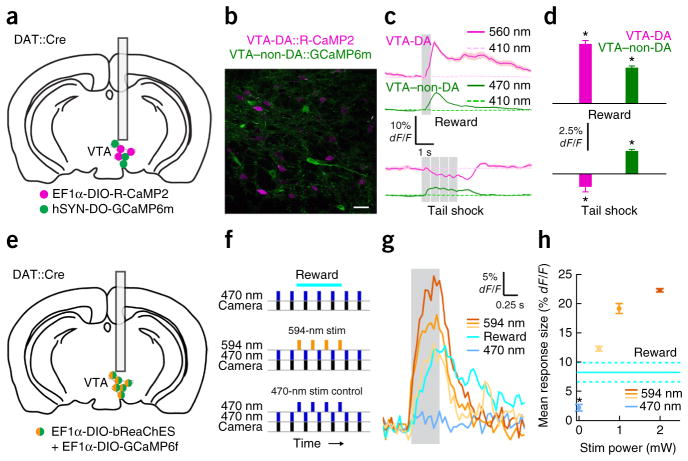
Real-time activity measurements from multiple specific cell populations and projections are likely to be important for understanding the brain as a dynamical system. Here we developed frame-projected independent-fiber photometry (FIP), which we used to record fluorescence activity signals from many brain regions simultaneously in freely behaving mice. We explored the versatility of the FIP microscope by quantifying real-time activity relationships among many brain regions during social behavior, simultaneously recording activity along multiple axonal pathways during sensory experience, performing simultaneous two-color activity recording, and applying optical perturbation tuned to elicit dynamics that match naturally occurring patterns observed during behavior.


Conflict of interest statement

COMPETING FINANCIAL INTERESTS

The authors declare competing financial interests: details are available in the online version of the paper.

Figures

Figure 1
Figure 1
Simultaneous Ca2+ measurements from multiple deep brain regions. (a) Schematic of the microscope used for simultaneous FIP Ca2+ recordings. The diagram at the lower left shows the time-division multiplexing scheme for simultaneous imaging of GCaMP6 at 470 nm and 410 nm. (b) Left, schematic of fiber placements in seven different brain regions expressing GCaMP6f. Right, example Ca2+ traces and simultaneously recorded control traces from a freely moving mouse. (c) GCaMP6f fluorescence traces simultaneously acquired across seven brain regions of a mouse when it was alone or socializing with a novel mouse. (d) Top, heat maps of Pearson’s correlation coefficient (r) calculated between brain regions for the mouse represented in c. Bottom, spatial representations of r between different brain regions. (e) The mean r value between all brain regions in mice alone (0.31 ± 0.024) and in mice socializing with a novel mouse (0.43 ± 0.024). Data plotted as mean ± s.e.m. ***P < 0.001, Wilcoxon’s rank-sum test; n = 84 pairs, 4 mice. (f) Schematic of surgery and recording setup for VTA-DA projection imaging. (g) GCaMP6f fluorescence traces simultaneously acquired in each brain region of a mouse in response to reward and tail shock. Data plotted as mean (dark green curves) ± s.e.m. (light green shaded regions). Gray bars indicate time of reward or shock. (h) Responses to reward and shock in each brain region (dF/FstimulusdF/Fbaseline) for the mouse represented in g. Data plotted as mean and s.e.m. *P < 0.05, Wilcoxon’s signed-rank test; n = 6 trials, 1 mouse. LH, lateral hypothalamus; BNST, bed nucleus of stria terminalis; Norm, normalized.
Figure 2
Figure 2
Dual-color imaging of different populations and simultaneous recording and perturbation of neural activity. (a) Schematic of dual-color imaging surgery. (b) Histology confirming non-overlapping labeled populations of VTA-DA and VTA–non-DA neurons. Scale bar, 25 μm. (c) VTA-DA and VTA–non-DA fluorescence traces acquired after reward or tail shock. Data plotted as mean (curves) ± s.e.m. (shading around curves). Gray bars indicate time of reward or shock. (d) Mean responses to reward and shock (dF/FstimulusdF/Fbaseline) for the mouse represented in c. Data plotted as mean and s.e.m. VTA-DA activity increased in response to reward (5.39% ± 0.32% dF/F) and decreased in response to shock (−1.18% ± 0.45% dF/F), whereas VTA–non-DA activity increased after both reward (3.26% ± 0.14% dF/F) and shock (2.08% ± 0.14% dF/F). *P < 0.05, Wilcoxon’s signed-rank test; n = 10 trials, 1 mouse. (e) Schematic of combined imaging and optogenetics surgery. (f) Schematic of imaging paradigm. (g) GCaMP6f fluorescence in response to 5 μW of 470-nm stimulation, 594-nm stimulation (different shades of orange from light to dark denote 0.5 mW, 1 mW and 2 mW of power, respectively) or reward. Gray bar indicates time of stimulation. (h) Mean response to bReaChES stimulation and reward (dF/FstimulusdF/Fbaseline). Data plotted as mean ± s.e.m. Color-coding matches the key in g. The mean response to 470-nm cross-stimulation (2.27% ± 0.57% dF/F) was significantly smaller than the response to reward (8.27% ± 1.63% dF/F) (*P < 0.05, Wilcoxon’s rank-sum test, n = 6 trials for 470 nm and 4 trials for reward/1 mouse). Dashed lines indicate ±s.e.m. Stim, stimulus.

References

    1. Tian L, et al. Nat Methods. 2009;6:875–881. - PMC - PubMed
    1. Chen TW, et al. Nature. 2013;499:295–300. - PMC - PubMed
    1. Inoue M, et al. Nat Methods. 2015;12:64–70. - PubMed
    1. Lecoq J, et al. Nat Neurosci. 2014;17:1825–1829. - PMC - PubMed
    1. Ghosh KK, et al. Nat Methods. 2011;8:871–878. - PMC - PubMed

Publication types