. 2016 Jul;148(3):253-65.
doi: 10.1111/imm.12598. Epub 2016 May 4.

Murine Sertoli cells promote the development of tolerogenic dendritic cells: a pivotal role of galectin-1

Affiliations

Murine Sertoli cells promote the development of tolerogenic dendritic cells: a pivotal role of galectin-1

Jianxin Gao et al. Immunology. 2016 Jul.

Abstract

Sertoli cells (SCs) possess inherent immunosuppressive properties and are major contributors to the immunoprivileged status of mammalian testis. SCs have been reported to inhibit the activation of B cells, T cells and natural killer cells but not dendritic cells (DCs). Herein, we present evidence that co-culture with SCs results in a persistent state of DC immaturity characterized by down-regulation of the surface molecules I-A/E, CD80, CD83, CD86, CCR7 and CD11c, as well as reduced production of pro-inflammatory cytokines. SC-conditioned DCs (SC-DCs) displayed low immunogenicity and enhanced immunoregulatory functions, including the inhibition of T-cell proliferation and the promotion of Foxp3(+) regulatory T-cell development. Mechanistically, the activation of p38, extracellular signal-regulated kinase 1/2, and signal transducer and activator of transcription 3 was suppressed in SC-DCs. More importantly, we demonstrate that galectin-1 secreted by SCs plays a pivotal role in the differentiation of functionally tolerogenic SC-DCs. These findings further support the role of SCs in maintaining the immunoprivileged environment of the testis and provide a novel approach to derive tolerogenic DCs, which may lead to alternative therapeutic strategies for the treatment of immunopathogenic diseases.

Keywords: Sertoli cells; co-culture; dendritic cells; galectin-1; immune tolerance.


Figures

Figure 1
Figure 1
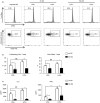
Sertoli cells (SCs) inhibit lipopolysaccharide (LPS)‐induced dendritic cell (DC) maturation. (a) Surface phenotypes of control DCs (ctr‐DCs) and SC‐conditioned DCs (SC‐DCs) with or without LPS stimulation were analysed by FACS. Dotted lines indicate isotype controls. Numbers indicate the mean fluorescence intensity (MFI) of each DC population. The results are representative of five independent experiments. (b) Production of interleukin‐10 (IL‐10), transforming growth factor‐β 1 (TGFβ 1), interleukin‐12‐p70 (IL‐12p70) and tumour necrosis factor‐α (TNFα) by DCs. Supernatants were collected from ctr‐DCs and SCDCs stimulated with or without LPS and analysed by ELISA. Data are indicated as the mean ± SEM from three independent experiments (Student's t‐test; *P < 0·05, **P < 0·01; ND, not detectable). (c) Phagocytic ability was assessed by analysing the cellular uptake of FITC‐dextran using FACS. Data in the left panel are representative of three independent experiments. Dotted lines indicate negative controls treated with FITC‐dextran at 4° for 30 min. Numbers indicate the mean fluorescence of each DC population incubated with FITC‐dextran at 37° for 30 min. Data in the right panel are expressed as the fold change of MFI ± SEM relative to the values observed for ctr‐DCs (LPS–), and the significance was calculated with one‐way analysis of variance and Tukey post‐tests (n = 3; *P < 0·05, **P < 0·01).
Figure 2
Figure 2
Sertoli cells (SCs) exert a suppressive effect on the T‐cell priming function of dendritic cells (DCs). (a) Gating on CD3+ CD4+ cells, the proliferation rate and CD69 expression of CD4+ T cells were analysed by FACS. Unpulsed DC represent syngenic DCs that were not pulsed with alloantigen; dotted lines indicate naive CD4+ T cells cultured alone. Numbers in the upper panels represent the percentages of proliferating CD4+ T cells; numbers in the lower panels indicate the percentages of CD69+ cells. (b) Graphs compiling the frequencies of proliferating CD4+ T cells (left panel) and CD3+ CD69+ T cells (right panel). Data are expressed as the percentage of indicated cells ± SEM from three independent experiments (*P < 0·05, ***P < 0·001; NS, no significance). (c) The concentrations of interleukin‐2 (IL‐2) and interferon‐γ (IFNγ) were analysed by ELISA. The supernatants from the DC‐T‐cell co‐culture system were collected on day 3. Data are indicated as the mean ± SEM from three independent experiments (*P < 0·05, **P < 0·01, ***P < 0·001; NS, no significance).
Figure 3
Figure 3
Sertoli cell‐conditioned dendritic cells (SCDCs) exhibit tolerogenic functions. (a) The proliferation and differentiation of anti‐CD3/28‐activated T cells were analysed by FACS. CFSE‐labelled CD4+ T cells were co‐cultured with DCs in the presence of anti‐CD3/28 antibodies. Dotted lines in the upper panels indicate naive T cells cultured alone; numbers represent the percentages of proliferated CD4+ T cells. Unlabeled CD4+ T cells under the same condition were stained with anti‐CD25 and anti‐Foxp3 antibodies and gated on CD3+ CD4+ T cells, as shown in the lower panels. Data are representative of four independent experiments. (b) Graphs compiling the frequencies of proliferating CD4+ T cells (left panel), the frequencies (middle panel) and absolute numbers (right panel) of CD25+ Foxp3+ T cells (right panel). Absolute numbers of CD25+ Foxp3+ T cells among all groups were calculated by multiplying the total viable leucocyte numbers per well by the frequencies of the CD25+ Foxp3+ population. Viable cell numbers were obtained using an automated cell counter (Invitrogen) with trypan blue staining for dead cells. Data are indicated as the mean ± SEM from four independent experiments (*P < 0·05, **P < 0·01, ***P < 0·001; NS, no significance). (c) Proliferation of responder cells in mixed leucocyte reaction experiments in the presence of different groups of DCs. Splenocytes of BALB/c (H‐2Kd) mice were labelled with CFSE and cultured as responder cells, while lethally irradiated C57BL/6 (H‐2Kb) splenocytes were stimulator cells (R : S = 10 : 1). Cells were gated based on the forward scatter and side scatter (lymphocyte gate). Numbers indicate the percentages of proliferated responder cells. The representative dot plots of three independent experiments are shown.
Figure 4
Figure 4
Sertoli cells (SCs) inhibit the activation of mitogen‐activated protein kinase and signal transducer and activator of transcription 3 (STAT3) signalling pathways in dendritic cells (DCs) through soluble factor(s). (a) The surface phenotype of DCs was analysed by FACS. DCs were co‐cultured with SCs by direct contact (SCDCs) or in the separated transwell chambers (trans‐DCs), with or without lipopolysaccharide (LPS) stimulation. Data are expressed as the fold change of MFI ± SEM relative to the values observed for control DCs (ctr‐DCs; LPS–) (n = 3; *P < 0·05, **P < 0·01; NS, no significance). (b) Following LPS stimulation at different times (0, 30, 60 and 90 min), DCs were lysed and analysed by immunoblotting with phospho‐specific or pan antibodies against β‐actin, extracellular signal‐regulated kinase 1/2 (ERK1/2), p38 and STAT3. The lower panels show the ratios between phosphorylated target proteins and the total ones, and data are shown as the fold change relative to values obtained for ctr‐DCs (LPS–) (n = 3; *P < 0·05; NS, no significance).
Figure 5
Figure 5
Sertoli cell (SC)‐derived galectin‐1 regulates the phenotype of dendritic cells (DCs). (a) Comparison of the cytokine profiles from the SC‐conditioned medium (SCCM) and control medium using a mouse cytokine array. RPMI‐1640 medium (0·2% fetal bovine serum) was used as the control medium (upper panel). Each spot signal was corrected for the adjacent background intensity and normalized to the positive control on the membranes. The proteins which showed > 20‐fold increase in SCCM are labelled in the panels. (b) CD83 expression on imDCs after exposure to different recombinant proteins. Mouse recombinant GAS6, IGFBP‐6, decorin, TWEAK R and galectin‐1 (100 ng/ml for all) were added to the culture medium of immature DCs. Following 3 days of culture, cells were collected and analysed by FACS. Dotted lines indicate isotype controls; numbers indicate the mean fluorescence of each DC population. The results are representative of three independent experiments. (c) ELISA of cytokines in supernatants of normal DCs or galectin‐1‐treated DCs. Supernatants were collected from immature DCs that were cultured with 10 ng/ml, 100 ng/ml or 1000 ng/ml or without galectin‐1 for another 3 days. Data are indicated as the mean ± SEM from three independent experiments (*P < 0·05, **P < 0·01; NS, no significance).
Figure 6
Figure 6
Sertoli cell (SC)‐derived galectin‐1 is the key mediator for the differentiation of co‐cultured dendritic cells (SCDCs). (a) Galectin‐1 concentration in the supernatants of control small interfering RNA (siRNA)‐treated SCs and galectin‐1 siRNA‐treated SCs was measured by ELISA. The supernatants were collected from transfected SCs after 24 hr of conditioning. The collected supernatants were used as control siRNA‐ SC‐conditioned medium (SCCM) and galectin‐1 siRNASCCM. Data are indicated as the mean ± SEM from three independent experiments (Student's t‐test; ***P < 0·001). (b) CD83 expression on immature DCs after exposure to control siRNASCCM and galectin 1‐siRNASCCM. SCMM or control medium (half volume) was added to the culture medium of immatureDCs. Cells were collected and analysed by FACS following another 3 days of culture. Dotted lines indicate isotype controls; numbers indicate the mean fluorescence of each DC population. The results are representative of three independent experiments. (c) Gene expression of interleukin‐12p35 (IL‐12p35) and tumour necrosis factor‐α (TNFα) in DCs treated by control siRNASCCM and galectin‐1 siRNASCCM. The immature DCs exposed to SCCM and control medium were stimulated with 1 μg/ml lipopolysaccharide (LPS) for another 24 hr, followed by the RNA extraction and real‐time PCR. Data are expressed as the fold change of gene expression ± SEM relative to control medium‐DC group (n = 3; *P < 0·05, **P < 0·01, ***P < 0·001; NS, no significance). (d) Proliferation of anti‐CD3/28‐activated CD4+ T cells cultured with DCs. DCs co‐cultured in different media were collected and co‐cultured with CFSE‐labelled, anti‐CD3/28‐activated T cells (DC : T = 1 : 5). Gating on CD3+ CD4+ cells, T‐cell proliferation was measured on day 3 by FACS. Dotted lines indicate naive T cells cultured alone; numbers represent the percentages of proliferating T cells. The results are representative of three independent experiments. Data in the right panel are expressed as the percentage of proliferating T cells ± SEM (n = 3; *P < 0·05, **P < 0·01; NS, no significance). (e) DCs cultured in different media were lysed and analysed by immunoblotting with antibodies against β‐actin, and phospho‐specific antibodies against extracellular signal‐regulated kinase 1/2 (ERK1/2), p38 and signal transducer and activator of transcription 3 (STAT3). The right panel shows the ratios between phosphorylated target proteins and β‐actin relative to the values observed for control medium‐DCs (n = 3; *P < 0·05, **P < 0·01; NS, no significance).

Similar articles

Cited by

References

    1. Zhao S, Zhu W, Xue S, Han D. Testicular defense systems: immune privilege and innate immunity. Cell Mol Immunol 2014; 11:428–37. - PMC - PubMed
    1. Head JR, Neaves WB, Billingham RE. Immune privilege in the testis. I. Basic parameters of allograft survival. Transplantation 1983; 36:423–31. - PubMed
    1. Doyle TJ, Kaur G, Putrevu SM, Dyson EL, Dyson M, McCunniff WT et al Immunoprotective properties of primary Sertoli cells in mice: potential functional pathways that confer immune privilege. Biol Reprod 2012; 86:1–14. - PMC - PubMed
    1. De Cesaris P, Filippini A, Cervelli C, Riccioli A, Muci S, Starace G et al Immunosuppressive molecules produced by Sertoli cells cultured in vitro: biological effects on lymphocytes. Biochem Biophys Res Commun 1992; 186:1639–46. - PubMed
    1. Bistoni G, Calvitti M, Mancuso F, Arato I, Falabella G, Cucchia R et al Prolongation of skin allograft survival in rats by the transplantation of microencapsulated xenogeneic neonatal porcine Sertoli cells. Biomaterials 2012; 33:5333–40. - PubMed

Publication types

MeSH terms

LinkOut - more resources