. 2016 Apr;48(4):349-55.
doi: 10.1038/ng.3511. Epub 2016 Feb 15.

An expanded sequence context model broadly explains variability in polymorphism levels across the human genome

Affiliations

An expanded sequence context model broadly explains variability in polymorphism levels across the human genome

Varun Aggarwala et al. Nat Genet. 2016 Apr.

Abstract

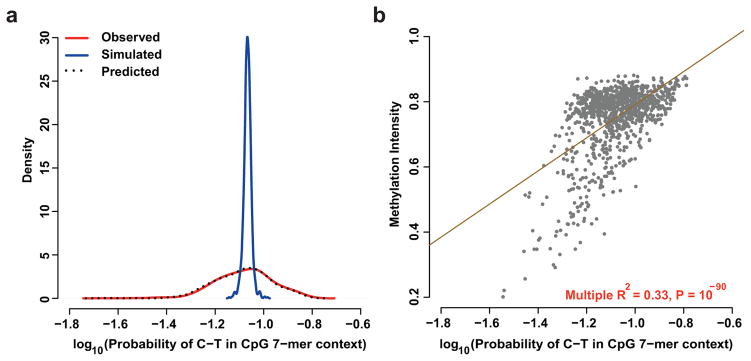
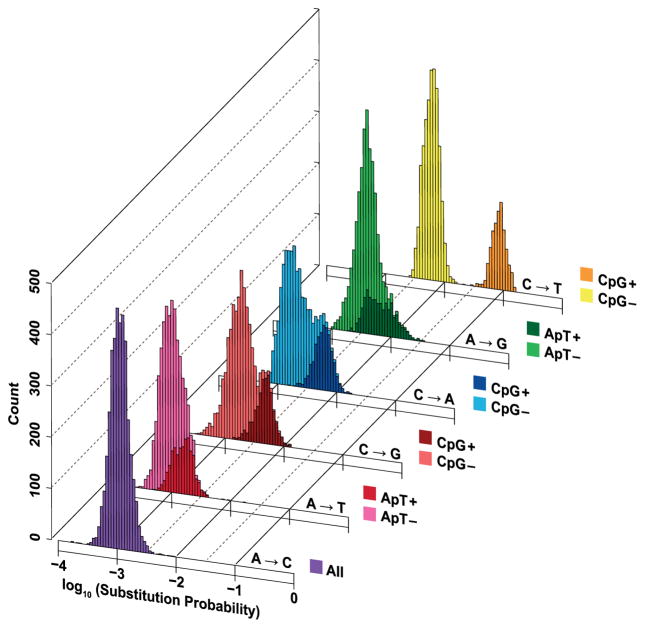
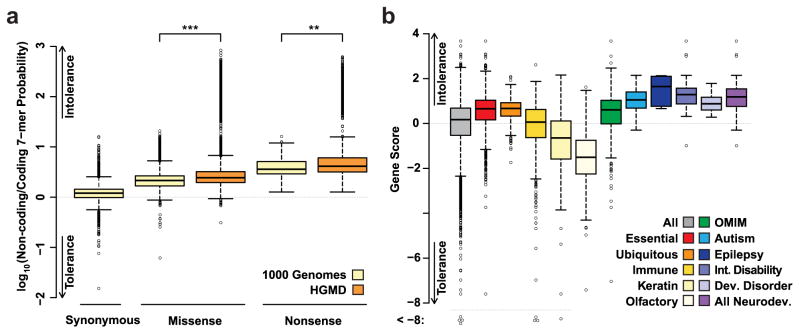
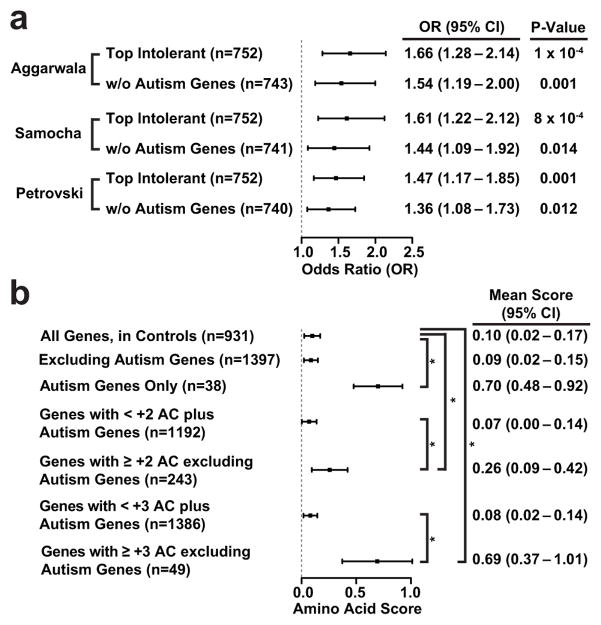
The rate of single-nucleotide polymorphism varies substantially across the human genome and fundamentally influences evolution and incidence of genetic disease. Previous studies have only considered the immediately flanking nucleotides around a polymorphic site--the site's trinucleotide sequence context--to study polymorphism levels across the genome. Moreover, the impact of larger sequence contexts has not been fully clarified, even though context substantially influences rates of polymorphism. Using a new statistical framework and data from the 1000 Genomes Project, we demonstrate that a heptanucleotide context explains >81% of variability in substitution probabilities, highlighting new mutation-promoting motifs at ApT dinucleotide, CAAT and TACG sequences. Our approach also identifies previously undocumented variability in C-to-T substitutions at CpG sites, which is not immediately explained by differential methylation intensity. Using our model, we present informative substitution intolerance scores for genes and a new intolerance score for amino acids, and we demonstrate clinical use of the model in neuropsychiatric diseases.


Conflict of interest statement

COMPETING FINANCIAL INTERESTS:

The authors declare no conflict of interest.

Figures

Figure 1
Figure 1
C-to-T substitution probabilities and methylation patterns within 7-mer CpG sequence contexts. (a) Simulations based on a fixed C-to-T substitution rate (blue) at CpG contexts do not capture the observed distribution of substitution probabilities (red) within the 7-mer sequence context. Rates predicted from our regression model (black) closely match the substitution probabilities observed under the 7-mer sequence context (R2 = 0.93). (b) Correlation between average methylation intensity versus probability of C-to-T substitution in CpG 7-mer context.
Figure 2
Figure 2
Posterior probabilities of all classes of nucleotide substitution in the intergenic noncoding genome, estimated using the 7-mer context model. Sequences contexts are further stratified by color to indicate either the presence of a CpG (C at the polymorphic 4th position and G at the 5th position, for C-to-A, C-to-G and C-to-T substitution classes = CpG+; else CpG−) or the ApT state (A at the polymorphic 4th position and T at the 5th position, for A-to-G and A-to-T substitution classes = ApT+; else ApT−). For A-to-C, the ApT state did not significantly contribute to variability in the estimated probability distribution.
Figure 3
Figure 3
Prioritizing pathogenic variants and causal genes using constraint scores. (a) log10 ratios of substitution probabilities from the 7-mer sequence context model using coding sequences matched to the intergenic noncoding sequences, for each type of substitution (synonymous, missense and nonsense) for all variants in the 1KG project or Human Gene Mutation Database (HGMD). Larger values indicate fewer substitutions in the coding genome than expected from matched noncoding sequences, consistent with the action of selective constraint. *** represents P ≪ 10−100 and ** represents P < 10−29. (b) Box and whisker plot of gene scores from the model, stratified into statistically significant gene classes. Positive gene scores indicate intolerance to substitutions that change an amino acid. For the boxplot, the center line in each box denotes the median. The inter-quartile range (25th and 75th) is indicated by the ends of each box. The whiskers extend 1.5x the inter-quartile range, and data points beyond this range are plotted as open circles.
Figure 4
Figure 4
Applications of gene and amino acid intolerance scores on de novo ASD mutational data. (a) Forest plot of the odds ratios (ORs), 95% confidence intervals (CIs), and p-values when comparing the de novo mutational burden in cases versus controls, on intolerant genes using different gene scoring methods. Scores are calculated including and excluding known Autism genes, as indicated. “Aggarwala” indicates gene scores from this report, while “Samocha” and “Petrovski” refers to the intolerant gene list from those works,. (b) Forest plots of the mean amino acid scores (with 95% CIs) found from de novo mutations in various gene collections. Average scores were based on variants ascertained in cases, except where noted (i.e., the first row: all genes in controls). W/o: without. +AC: excess count of missense or nonsense changes in cases relative to controls. For example, +3 indicates that a gene has 3 more missense or nonsense changes in cases relative to controls. *: P < 0.01.

Similar articles

Cited by

References

    1. Hodgkinson A, Eyre-Walker A. Variation in the mutation rate across mammalian genomes. Nat Rev Genet. 2011;12:756–66. - PubMed
    1. Ehrlich M, Wang RY. 5-Methylcytosine in eukaryotic DNA. Science. 1981;212:1350–7. - PubMed
    1. Rideout WM, Coetzee GA, Olumi AF, Jones PA. 5-Methylcytosine as an endogenous mutagen in the human LDL receptor and p53 genes. Science. 1990;249:1288–90. - PubMed
    1. Arbiza L, et al. Genome-wide inference of natural selection on human transcription factor binding sites. Nat Genet. 2013;45:723–9. - PMC - PubMed
    1. Yang Y, et al. Clinical whole-exome sequencing for the diagnosis of mendelian disorders. N Engl J Med. 2013;369:1502–11. - PMC - PubMed

Publication types

Substances