. 2016 Feb 16:6:21242.
doi: 10.1038/srep21242.

Quantitative molecular phenotyping with topically applied SERS nanoparticles for intraoperative guidance of breast cancer lumpectomy

Affiliations

Quantitative molecular phenotyping with topically applied SERS nanoparticles for intraoperative guidance of breast cancer lumpectomy

Yu Wang et al. Sci Rep. .

Abstract

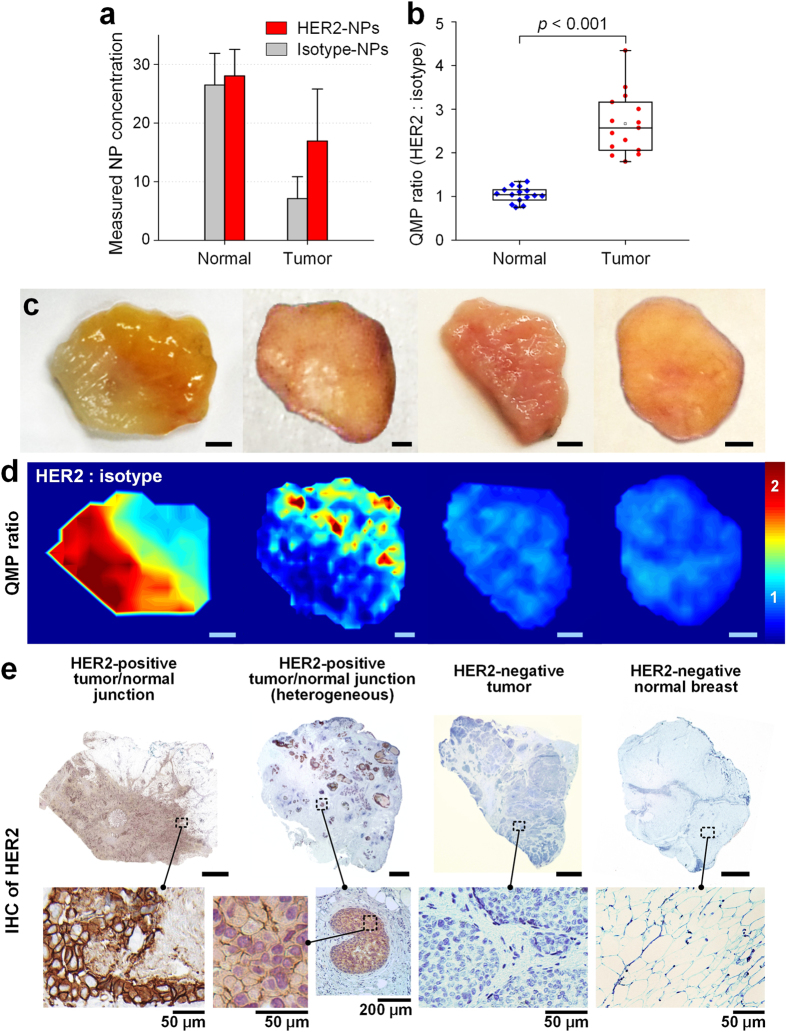
There is a need to image excised tissues during tumor-resection procedures in order to identify residual tumors at the margins and to guide their complete removal. The imaging of dysregulated cell-surface receptors is a potential means of identifying the presence of diseases with high sensitivity and specificity. However, due to heterogeneities in the expression of protein biomarkers in tumors, molecular-imaging technologies should ideally be capable of visualizing a multiplexed panel of cancer biomarkers. Here, we demonstrate that the topical application and quantification of a multiplexed cocktail of receptor-targeted surface-enhanced Raman scattering (SERS) nanoparticles (NPs) enables rapid quantitative molecular phenotyping (QMP) of the surface of freshly excised tissues to determine the presence of disease. In order to mitigate the ambiguity due to nonspecific sources of contrast such as off-target binding or uneven delivery, a ratiometric method is employed to quantify the specific vs. nonspecific binding of the multiplexed NPs. Validation experiments with human tumor cell lines, fresh human tumor xenografts in mice, and fresh human breast specimens demonstrate that QMP imaging of excised tissues agrees with flow cytometry and immunohistochemistry, and that this technique may be achieved in less than 15 minutes for potential intraoperative use in guiding breast-conserving surgeries.


Conflict of interest statement

Dr. Liu has an issued patent: “Raman imaging devices and methods of molecular imaging.” The other authors declare no competing financial interests.

Figures

Figure 1
Figure 1. Schematic of an intraoperative imaging technique to rapidly identify residual tumors at the margins of freshly resected tissues for guiding breast-conserving surgeries.
A ratiometric strategy (right inset) quantifies biomarker expression by comparing the signal from targeted NPs and nontargeted NPs. Y.W. drew the figure.
Figure 2
Figure 2. Raman imaging system.
(a) Schematic of the spectral-imaging system. A 785-nm laser is used to illuminate the NP-stained tissue, creating a submillimeter-diameter laser spot. Raman-scattered photons from illuminated NPs are collected by 36 multimode fibers and transmitted to a customized spectrometer (Andor Holospec), where they are dispersed onto a cooled deep-depletion spectroscopic CCD (Andor). For raster-scanning imaging, a two-axis stage is controlled through a custom LabVIEW program to translate the tissue sample. (b) A photograph of the raster-scanned tissue-imaging device. (c) A depiction of the structure of the targeted and nontargeted SERS NPs and (d) the Raman spectra of the various SERS NPs (targeted and nontargeted) used in this study. Y.W. drew the figure.
Figure 3
Figure 3. Optimization of a topical-staining procedure with tumor xenografts.
(a,b) Multi-stage rinsing of tissue samples after they have been stained for 10 min with a 1:1 mixture of EGFR-NPs and isotype-NPs (150 pM/flavor). (a) Measured NP concentrations on tumor and normal tissue. (b) Targeted vs. nontargeted NP ratios for 3 tumors and 3 normal samples. (c,d) Comparison of staining efficiency with and without 1% BSA in the staining solution (150 pM per NP flavor, 10 min staining). (c) Measured NP concentrations. (d) Concentration ratio of targeted vs. nontargeted NPs. (e) NP concentration on A431 tumors as a function of staining duration and staining concentration. (f) Targeted vs. nontargeted NP ratio as a function of staining duration and staining concentration.
Figure 4
Figure 4. QMP imaging of normal tissue (EGFR-negative) and tumor xenografts (SkBr3, U251, and A431) that express various levels of EGFR.
The tissues were stained with a two-flavor NP mixture (EGFR-NPs and isotype-NPs) and the staining-and-imaging procedure was achieved in less than 15 min. (a) Photographs of resected normal tissue (muscle) and tumor xenografts. (b) QMP images of the concentration ratio of EGFR-NPs vs. isotype-NPs. The line profiles at the bottom of the image indicate the QMP ratios along the gray line through the center of each tissue specimen. (c) Validation data: IHC for EGFR (10X and 40X views), and H&E staining (10X and 40X views). The scale bars represent 100 μm.
Figure 5
Figure 5
QMP imaging, with 0.5-mm spatial resolution, of tumor-xenograft specimens stained with a three-flavor NP mixture (EGFR-NPs, HER2-NPs and isotype-NPs). (a) Photograph of resected tumor xenografts and normal tissue. (b) A multiplexed QMP image generated by overlaying the ratiometric images of EGFR-NPs/isotype-NPs (plotted with a green colormap) and HER2-NPs/isotype-NPs (plotted with a red colormap). Images showing the concentration ratio of (c) EGFR-NPs/isotype-NPs and (d) HER2-NPs/isotype-NPs. The bottom plots show the correlation between the QMP ratio of a particular tissue specimen (in c,d) and the corresponding fluorescence ratio (targeted NP vs. isotype NP) from flow-cytometry experiments with the cell lines used to generate the various tumor xenografts (Supplementary Fig. S2). R > 0.98. Scale bars represent 2 mm.
Figure 6
Figure 6. QMP imaging of human breast tissues stained with a 2-flavor NP mixture (HER2-NPs and isotype-NPs, 150 pM/flavor).
(a) Absolute NP concentrations and (b) NP concentration ratios on normal tissues and tumors (10 tissue specimens from 5 patients). (c) Photographs of four tissue specimens from four patients: two HER2-positive specimens containing both tumor and normal tissue regions and two HER2-negative specimens (one tumor and one normal tissue). (d) Images of the concentration ratio of HER2-NPs vs. isotype-NPs and (e) IHC staining with an anti-HER2 mAb. Unlabeled scale bars represent 2 mm.

References

    1. Fisher B. et al. Twenty-Year Follow-up of a Randomized Trial Comparing Total Mastectomy, Lumpectomy, and Lumpectomy plus Irradiation for the Treatment of Invasive Breast Cancer. New Engl. J. Med. 347, 1233–1241 (2002). - PubMed
    1. DeSantis C., Ma J., Bryan L. & Jemal A. Breast cancer statistics, 2013. CA-Cancer J. Clin. 64, 52–62 (2014). - PubMed
    1. Waljee J. F., Hu E. S., Newman L. A. & Alderman A. K. Predictors of re-excision among women undergoing breast-conserving surgery for cancer. Ann. Surg. Oncol. 15, 1297–1303 (2008). - PubMed
    1. Jeevan R. et al. Reoperation rates after breast conserving surgery for breast cancer among women in England: retrospective study of hospital episode statistics. Brit. Med. J. 345 (2012). - PMC - PubMed
    1. Moran M. S. et al. Society of Surgical Oncology-American Society for Radiation Oncology consensus guideline on margins for breast-conserving surgery with whole-breast irradiation in stages I and II invasive breast cancer.Int. J. Radiat. Oncol. 88, 553–564 (2014). - PMC - PubMed

Publication types