. 2016 Feb 16:6:20889.
doi: 10.1038/srep20889.

Improving brightness and photostability of green and red fluorescent proteins for live cell imaging and FRET reporting

Affiliations

Improving brightness and photostability of green and red fluorescent proteins for live cell imaging and FRET reporting

Bryce T Bajar et al. Sci Rep. .

Abstract

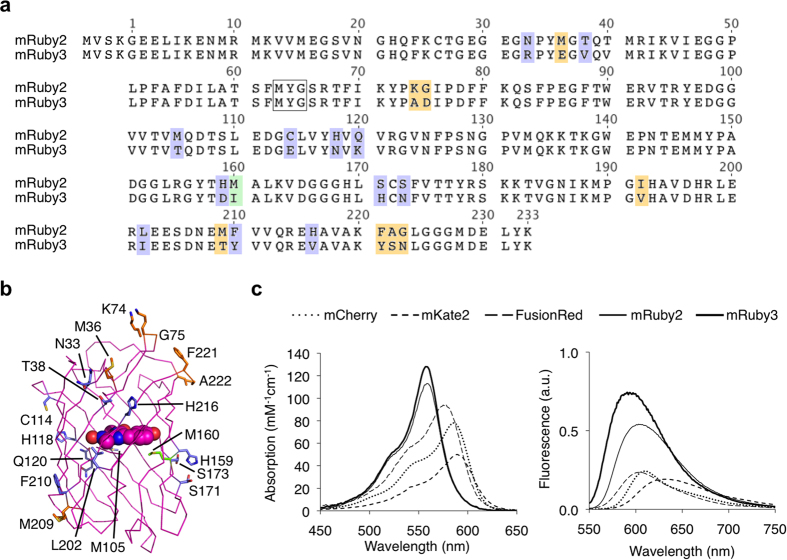
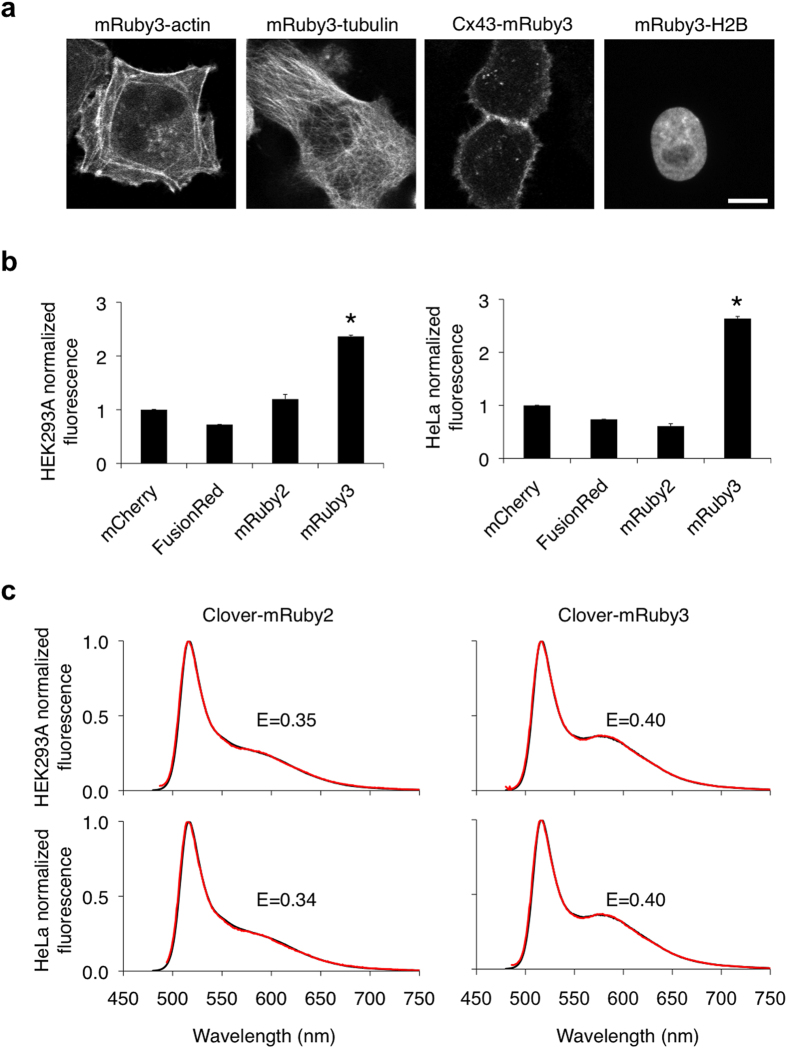
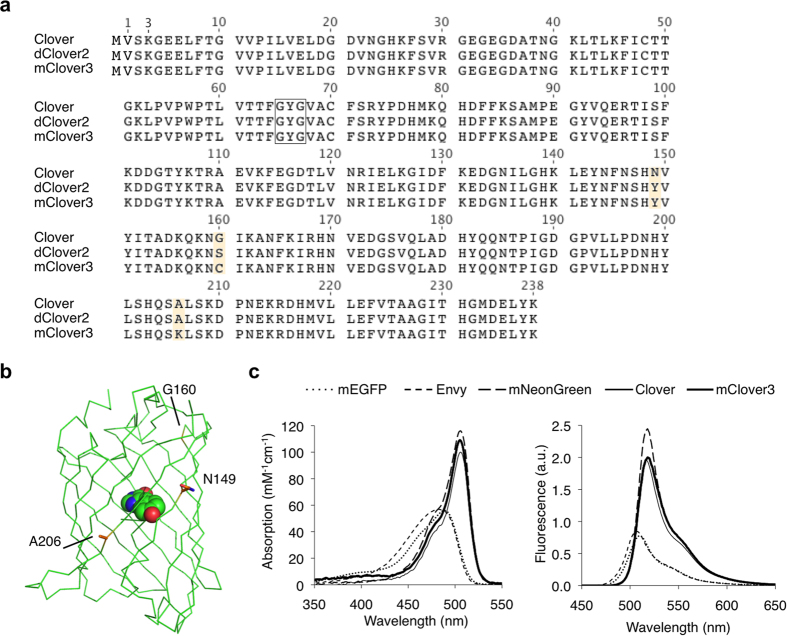
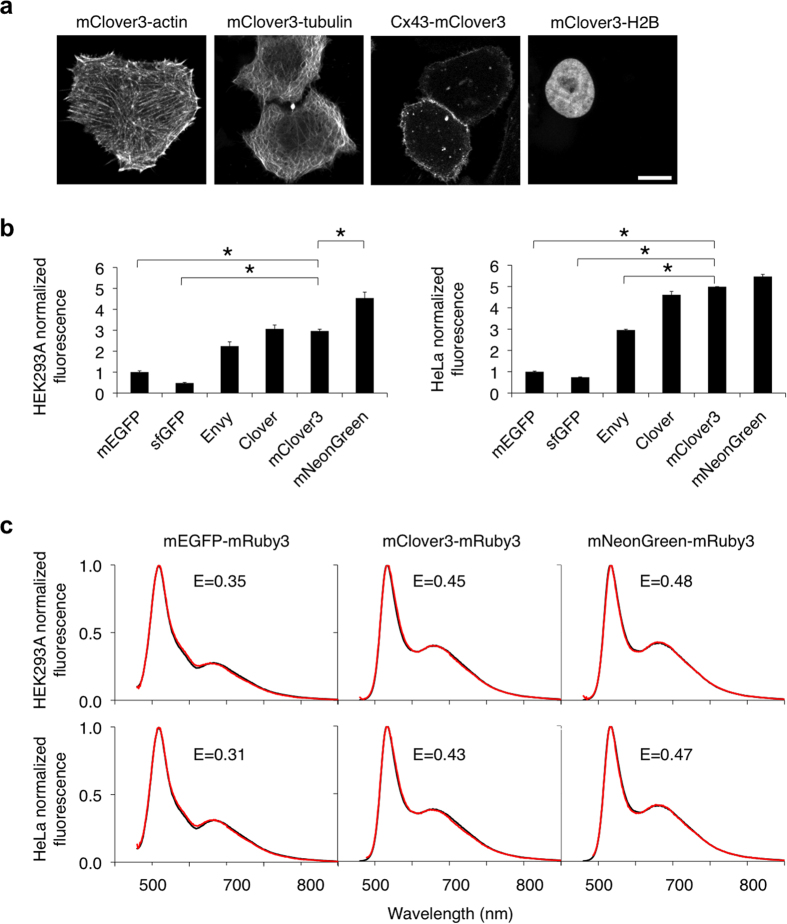
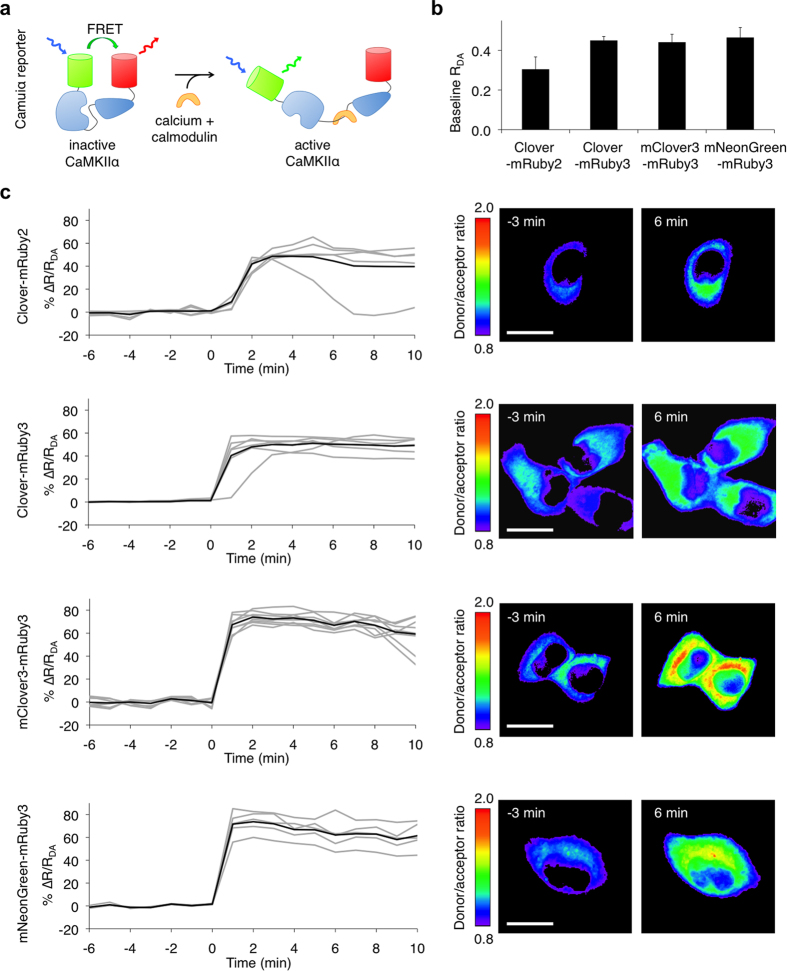
Many genetically encoded biosensors use Förster resonance energy transfer (FRET) to dynamically report biomolecular activities. While pairs of cyan and yellow fluorescent proteins (FPs) are most commonly used as FRET partner fluorophores, respectively, green and red FPs offer distinct advantages for FRET, such as greater spectral separation, less phototoxicity, and lower autofluorescence. We previously developed the green-red FRET pair Clover and mRuby2, which improves responsiveness in intramolecular FRET reporters with different designs. Here we report the engineering of brighter and more photostable variants, mClover3 and mRuby3. mClover3 improves photostability by 60% and mRuby3 by 200% over the previous generation of fluorophores. Notably, mRuby3 is also 35% brighter than mRuby2, making it both the brightest and most photostable monomeric red FP yet characterized. Furthermore, we developed a standardized methodology for assessing FP performance in mammalian cells as stand-alone markers and as FRET partners. We found that mClover3 or mRuby3 expression in mammalian cells provides the highest fluorescence signals of all jellyfish GFP or coral RFP derivatives, respectively. Finally, using mClover3 and mRuby3, we engineered an improved version of the CaMKIIα reporter Camuiα with a larger response amplitude.


Figures

Figure 1
Figure 1. Development of mRuby3.
(a) Sequence alignment of mRuby3 to its parent, mRuby2. The amino acids forming the chromophore are indicated by a black box. Outer barrel mutations are indicated in blue, inner barrel mutations are indicated in green, and loop mutations are indicated in orange. (b) Crystal structure of mRuby (PDB accession number 3U0M) showing mutations between mRuby2 and mRuby3. (c) Absorption (left) and emission (right) of mCherry, mKate2, FusionRed, mRuby2, and mRuby3. Absorbance spectra are scaled to peak extinction coefficient. Emission spectra are scaled so that areas under the curves are proportional to peak brightness (product of peak extinction coefficient and quantum yield).
Figure 2
Figure 2. Performance of mRuby3 in mammalian cells.
(a) Fluorescence images of HeLa cells expressing various mRuby3 fusion proteins that exhibit distinct subcellular localizations: mRuby3-7aa-actin (actin cytoskeleton), mRuby3-6aa-tubulin (microtubules), connexin43-7aa-mRuby3 (cell-cell adhesion junctions), mRuby3-10aa-H2B (nucleosomes). Linker lengths in amino acids are denoted by the number preceding ‘aa’. Scale bar, 10 μm. (b) Brightness comparison of monomeric RFPs in HEK293A and HeLa cells expressing mTurquoise2-P2A-RFP. The red fluorescence from each RFP, corrected by mTurquoise2, was normalized to that of mCherry. Data are presented as mean ± S.E.M. (n = 3). Asterisks indicate statistically significant differences (p < 0.05 by ANOVA followed by Dunnett’s post hoc tests). (c) FRET efficiency of Clover-mRuby2 compared to Clover-mRuby3 in HEK293A and HeLa cells. The emission spectra experimentally obtained (red lines) were fit to linear combinations of emission spectra of donor and acceptor (black lines).
Figure 3
Figure 3. Development of mClover3.
(a) Sequence alignment of mClover3 and dClover2 to its parent, Clover. The amino acids forming the chromophore are indicated by a black box. Outer barrel mutations are indicated in orange. (b) Crystal structure of superfolder GFP (PDB accession number 2B3P) showing mutations between Clover and mClover3. (c) Absorption (left) and emission (right) spectra of mEGFP, Envy, mNeonGreen, Clover, and mClover3. Absorbance spectra are scaled to peak extinction coefficient. Emission spectra are scaled so that areas under the curves are proportional to peak brightness (product of peak extinction coefficient and quantum yield).
Figure 4
Figure 4. Performance of mClover3 in mammalian cells.
(a) Fluorescence images of HeLa cells expressing various mClover3 fusion proteins that exhibit distinct subcellular localizations: mClover3-7aa-actin (actin cytoskeleton), mClover3-6aa-tubulin (microtubules), connexin43-7aa-mClover3 (cell-cell adhesion junctions), mClover3-10aa-H2B (nucleosomes). Linker lengths in amino acids are denoted by the number preceding ‘aa’. Scale bar, 10 μm. (b) Brightness comparison of GFPs in HEK293A and HeLa cells expressing GFP-P2A-mCherry. The green fluorescence from each GFP, corrected by mCherry fluorescence, was normalized to that of mEGFP. Data are presented as mean ± S.E.M. (n = 3). Asterisks indicate statistically significant differences (p < 0.05 by ANOVA followed by Dunnett’s post hoc tests). (c) FRET efficiencies of various GFP-mRuby3 tandem fusions in HEK293A and HeLa cells. The emission spectra experimentally obtained (red lines) were fit to linear combinations of emission spectra of donor and acceptor (black lines).
Figure 5
Figure 5. mClover3-mRuby3 and mNeonGreen3-mRuby3 improve responses in the CaMKIIα reporter Camuiα.
(a) Organization of Camuiα with green/red FRET pairs. (b) Donor/acceptor emission ratio (RDA) for green/red Camuiα-expressed HeLa cells without ionomycin stimulation. Data are presented as mean ± S.E.M. (n = 11, 14, 17, 10 for Camuiα-CR, Camuiα-CR3, Camuiα-C3R3, and Camuiα-NR3 respectively). (c) Mean donor/acceptor emission ratio changes (ΔR/RDA) over time (left panel) and corresponding intensity-modulated ratiometric images (right panel) of HeLa cells stimulated with ionomycin. Emission ratio changes of individual cells are plotted as gray lines and the mean as black line. Data are presented as mean ± S.E.M. n = 7 cells for Camuiα-CR; n = 6 cells for Camuiα-CR3; n = 8 cells for Camuiα-C3R3; n = 5 cells for Camuiα-NR3. Difference in peak emission ratio change between Camuiα-CR and both Camuiα-C3R3 and Camuiα-NR3 is statistically significant (p < 0.05 by Student’s t-test). Scale bar, 20 μm.

Similar articles

Cited by

References

    1. Lam A. J. et al. Improving FRET dynamic range with bright green and red fluorescent proteins. Nat Methods 9, 1005–1012 (2012). - PMC - PubMed
    1. Miranda J. G. et al. New alternately colored FRET sensors for simultaneous monitoring of Zn2+ in multiple cellular locations. PLoS One 7, e49371 (2012). - PMC - PubMed
    1. Ni Q., Titov D. V. & Zhang J. Analyzing protein kinase dynamics in living cells with FRET reporters. Methods 40, 279–286 (2006). - PubMed
    1. Takao K. et al. Visualization of synaptic Ca2+/calmodulin-dependent protein kinase II activity in living neurons. J Neurosci 25, 3107–3112 (2005). - PMC - PubMed
    1. Tsutsui H., Karasawa S., Okamura Y. & Miyawaki A. Improving membrane voltage measurements using FRET with new fluorescent proteins. Nat Methods 5, 683–685 (2008). - PubMed

Publication types

MeSH terms

Substances