. 2016 Feb 16:6:19976.
doi: 10.1038/srep19976.

Schizophrenia-Associated hERG channel Kv11.1-3.1 Exhibits a Unique Trafficking Deficit that is Rescued Through Proteasome Inhibition for High Throughput Screening

Affiliations

Schizophrenia-Associated hERG channel Kv11.1-3.1 Exhibits a Unique Trafficking Deficit that is Rescued Through Proteasome Inhibition for High Throughput Screening

Nicholas E Calcaterra et al. Sci Rep. .

Abstract

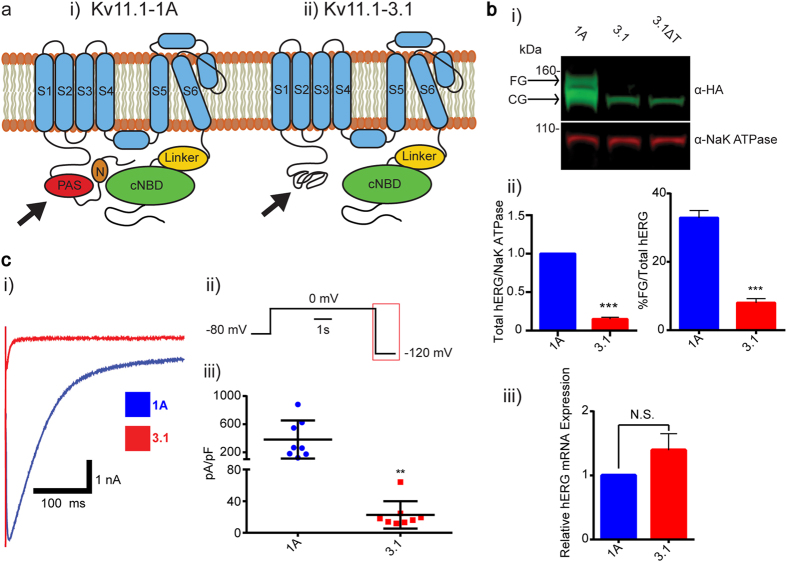
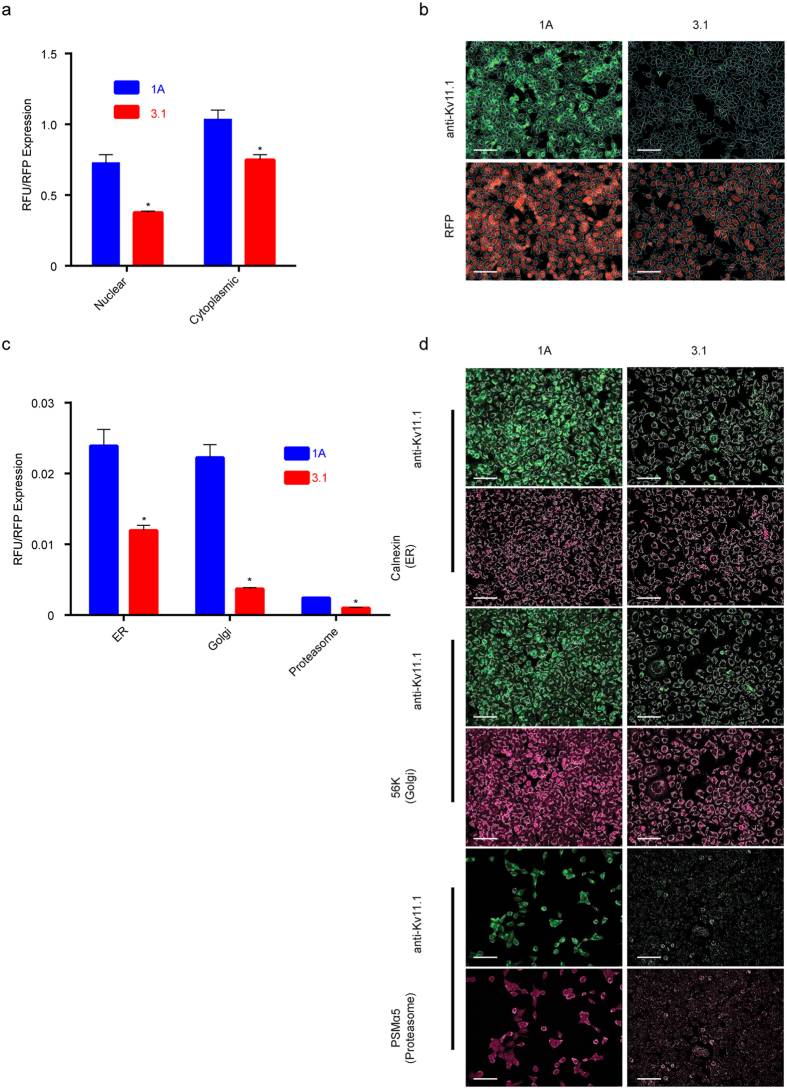
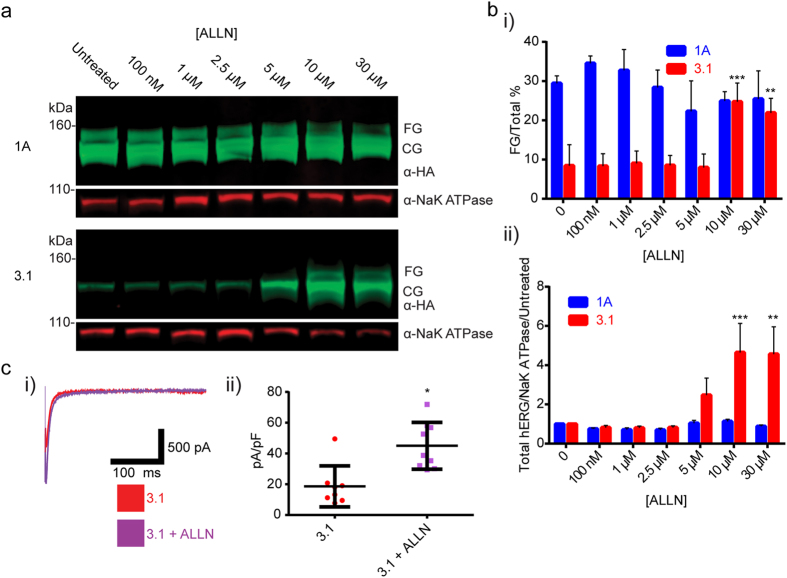
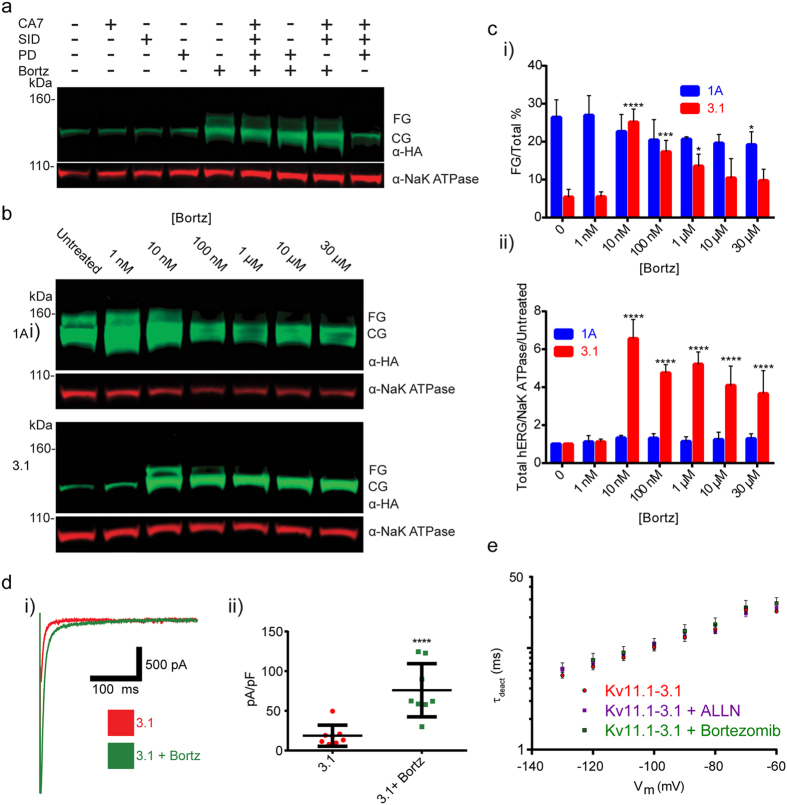
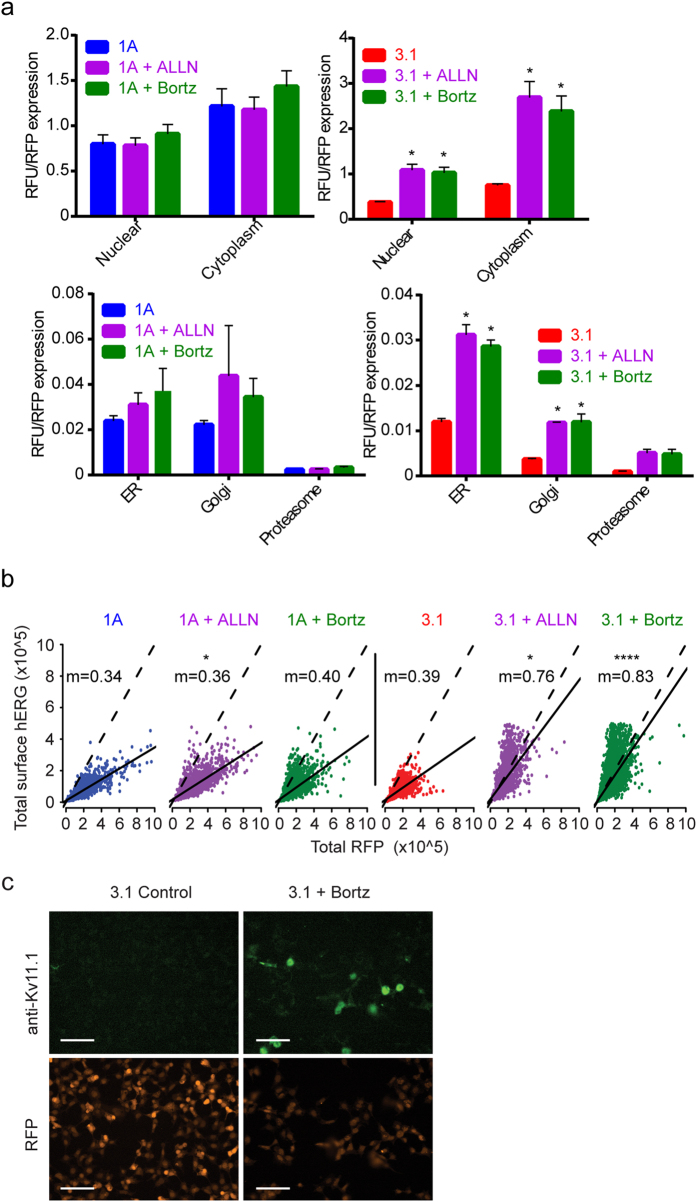
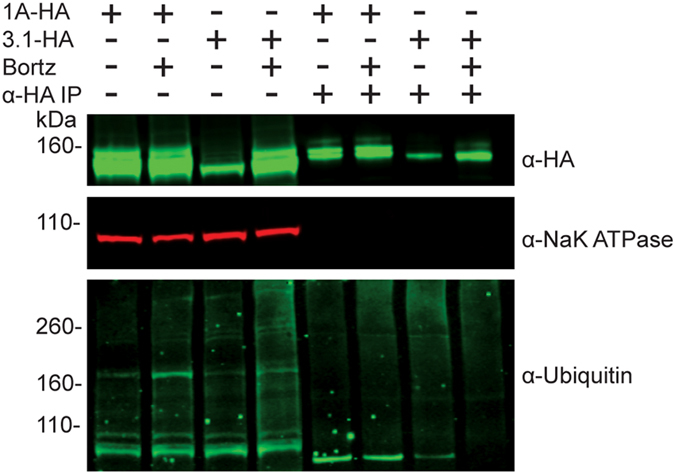
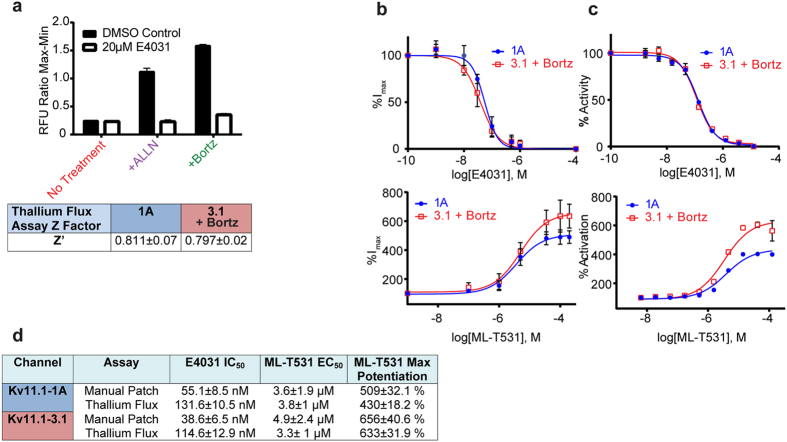
The primate-specific brain voltage-gated potassium channel isoform Kv11.1-3.1 has been identified as a novel therapeutic target for the treatment of schizophrenia. While this ether-a-go-go related K(+)channel has shown clinical relevance, drug discovery efforts have been hampered due to low and inconsistent activity in cell-based assays. This poor activity is hypothesized to result from poor trafficking via the lack of an intact channel-stabilizing Per-Ant-Sim (PAS) domain. Here we characterize Kv11.1-3.1 cellular localization and show decreased channel expression and cell surface trafficking relative to the PAS-domain containing major isoform, Kv11.1-1A. Using small molecule inhibition of proteasome degradation, cellular expression and plasma membrane trafficking are rescued. These findings implicate the importance of the unfolded-protein response and endoplasmic reticulum associated degradation pathways in the expression and regulation of this schizophrenia risk factor. Utilizing this identified phenomenon, an electrophysiological and high throughput in-vitro fluorescent assay platform has been developed for drug discovery in order to explore a potentially new class of cognitive therapeutics.


Figures

Figure 1
Figure 1. Kv11.1-3.1 is an N-terminally truncated hERG channel with trafficking, expression, and activity deficiencies.
(a) Illustrative examples of Kv11.1-1A (i) and Kv11.1-3.1(ii) channel structure. Full length Kv11.1 channels contain N-terminal PAS domain and amphipathic helix N-cap, suggested to interact with each other and a C-terminal cyclic nucleotide biding domain. Kv11.1-3.1, being absent of a full PAS domain, likely presents an unstably folded N-terminal motif. (b) Sample Western blot (i) of whole cell lysates from stably transfected HEK 293 cells expressing recombinant HA-tagged Kv11.1-1A, Kv11.1-3.1, or Kv11.1-3.1 after 20 hour incubation at 28 °C (ΔT). Lysates were probed with anti-HA and anti-NaK ATPase primary antibodies subsequently incubated with fluorescent IR dyes for quantitative detection. Ladder markers indicated with respective sizes in kDa. Arrows indicate respective FG and CG bands representative of mature fully glycosylated and immature core glycosylated channel populations. Neither 3.1 nor cold-incubated 3.1 show obvious FG band expression, suggesting the 3.1 trafficking phenotype is heat-insensitive. (ii) Summary quantification of trafficking efficiency (FG/Total hERG, n = 3) and relative expression differences (Total hERG/NaK ATPase normalized to 1A expression, n = 3) of 1A and 3.1 channels. 3.1 showed significant decreases in both trafficking and steady-state expression. Note that while no FG signal is visible for Kv11.1-3.1, there is a photon count present above true background. (iii) Kv11.1-3.1 expressing cells show a non-significant increase in total hERG channel transcription compared to Kv11.1-1A expressing cells via qPCR (n = 3). (c) (i) Example whole-cell deactivation tail current voltage clamp traces from HEK 293 cells expressing 1A or 3.1 channels. (ii) Currents were recorded by holding cells at −80 mV, activating channels with a voltage step to 0 mV for 5s, followed by a hyperpolarizing step to −120 mV to induce tail currents. 3.1 displays rapid deactivation compared to 1A. (iii) Peak tail currents from 1A and 3.1 traces were normalized to cell capacitance (pA/pF, n = 8) and analyzed. 3.1 shows significantly reduce average peak tail current relative to 1A. All bar graph data presented as mean ± SEM (*P = <0.05, **P = <0.01, ***P = <0.001, ****P = <0.0001).
Figure 2
Figure 2. Single cell measurements of Kv11.1-1A and Kv11.1-3.1 show reduced expression across sub-cellular compartments.
(a) Total Kv11.1-1A and Kv11.1-3.1 signal (RFU) was measured in each cell and normalized to the RFP signal from the same cells. Note the reduced signal in 3.1 from both nucleus and cytoplasm (n = 3 unique experiments). (b) Representative fluorescence micrographs show both fluorescence signal and overlay after sub-cellular image segmentation. (c) RFP-normalized signal from indicated sub-cellular compartments (n = 3 unique experiments). (d) Fluorescence micrographs demonstrate localized signal from Kv11.1 and the organelle-specific masks used for sub-cellular localization. Colocalization and segmentation data used is from same experiment in Fig. 5. Scale bars = 100μm. All bar graph data presented as mean ± SEM (*P = <0.05).
Figure 3
Figure 3. Kv11.1-3.1 expression, trafficking, and peak tail currents are significantly increased via pharmacological rescue with ALLN.
(a) Example Western blot analysis of cells expressing 1A or 3.1 treated with the calpain/lysosomal cathepsin/proteasome inhibitor ALLN. ALLN treatment of 3.1 expressing cells resulted in presence of the FG band and increased CG band intensity while only increasing 1A CG expression. (b) Quantitation summary of Western analysis shows significant increases of i) 3.1 trafficking and ii) total hERG expression upon ALLN treatment (n = 3). No significant effects were seen in 1A expressing cells. (c) i) Representative whole-cell voltage clamp tail current traces for ALLN treated 3.1 cells. ii) Peak tail currents were normalized to cell capacitance (n = 8) and analyzed. ALLN treatment was found to significantly increase normalized peak tail currents compared to untreated cells (*P = <0.05). All bar graph data presented as mean ± SEM (*P = <0.05, **P = <0.01, ***P = <0.001).
Figure 4
Figure 4. Proteasome inhibition is sufficient for Kv11.1-3.1 rescue via bortezomib.
(a) Example blot of 3.1 expressing cells treated with either selective calpain I/II inhibitor PD 150606, lysosomal cathepsin B/L inhibitors CA 074/SID 26681509, 26s proteasome inhibitor bortezomib, or various cocktails in order to determine ALLN mechanism of rescue. Only samples treated with bortezomib, or a cocktail consisting thereof, resulted in the display of a FG band. (b) Example blot of cells expressing 1A or 3.1 treated with bortezomib. Treatment of 3.1 expressing cells with bortezomib results in presence of the FG band and increased CG band intensity while only increasing 1A CG expression. (c) Quantitation summary of Western analysis shows significant increases of i) 3.1 trafficking and ii) total hERG expression upon bortezomib treatment(n = 3). (d) i) Representative whole-cell voltage clamp tail current traces for bortezomib treated 3.1 cells. ii) Peak tail currents were normalized to cell capacitance (n = 8) and analyzed. Bortezomib treatment was found to significantly increase normalized peak tail currents compared to untreated cells (****P = <0.0001). Note data for untreated 3.1 peak tail currents is from the same experiments in Fig. 3c ii. (e) Pharmacological rescue conditions were tested for alterations to channel kinetics according to deactivation rate voltage protocol. i) Extrapolated τdeact values for pharmacologically treated cells were not shown to be significantly different from those of controls, thus rescue compounds had no effect on Kv11.1-3.1 deactivation rates (n = 3). All bar graph data presented as mean ± SEM (*P = <0.05, ***P = <0.001, ****P = <0.0001).
Figure 5
Figure 5. Proteasome inhibitor treated cells show Kv11.1-3.1 rescue across sub-cellular compartments and cell surface.
(a) RFP-normalized fluorescence of Kv11.1 1A and 3.1. Note the differential elevation of 3.1 compared to 1A after the same treatments (n = 3). (b) Scatter plot of RFP vs surface Kv11.1 in single cells, n > 3000 measurements per condition (n = 3 unique experiments). m = slope of the linear regression (solid line). The dotted lines have slope m = 1 for reference. (c) Immunofluorescence micrographs of representative fields showing specific surface Kv11.1-3.1. Scale bars = 100 μm. All bar graph data presented as mean ± SEM (*P = <0.05, ****P = <0.0001).
Figure 6
Figure 6. Kv11.1-1A and Kv11.1-3.1 show different channel ubiquitinylated changes in response to bortezomib.
HA tagged hERG channels were immunoprecipated from stably expressing hERG cell lysates that had been incubated with bortezomib or DMSO for 16 hours. Cell lysates and IP elutions were probed for HA tag, NaK ATPase, and ubiquitin. Cell lysates show increases in total ubiquitin with bortezomib treatment and both 1A and 3.1 channels show poly-ubiquitinylation. Immunoprecipitated 1A channels show increase in ubiquitnylation accumulation in bortezomib treatments. Immunoprecipitated 3.1 channels from bortezomib treated cells show less accumulation than DMSO incubated cells.
Figure 7
Figure 7. Bortezomib treatment of Kv11.1-3.1 expressing cells produces sufficient currents for dose-response analysis of hERG inhibitors and activators via whole cell voltage clamp and high throughput fluorescence methods.
(a) 3.1 expressing cells were treated with ALLN or bortezomib as before in 384 well assay plates. Plates were incubated the next day with assay loading buffer for 45 minutes, and then incubated with either E4031 or DMSO for 5 minutes prior to addition of stimulation buffer and subsequent signal detection. Comparison of pharmacologically treated 3.1 expressing cells and controls shows that both ALLN and bortezomib tremendously increase signal to background window in the thallium flux assay (n = 16). Z’ scores for the thallium flux assay with either 1A cells or 3.1 cells treated with bortezomib are well above the 0.5 threshold across multiple trials (n = 3). (b) Dose-response of peak tail currents to either E4031 (n = 4) or ML-T531 (1A n = 3, 3.1 n = 6) titration in whole-cell voltage clamp of cells expressing either 1A or 3.1 treated with bortezomib. (c) Dose-response of peak tail currents to either E4031 (n = 4) or ML-T531 (1A n = 3, 3.1 n = 6) titration in thallium flux assay of cells expressing either 1A or 3.1 treated with bortezomib. (d) Table summary of compound potencies and activator potentiation data. E4031 potencies decrease in thallium flux assay compared to voltage-clamp by less than 3 fold. ML-T531 exhibits higher max potentiation in 3.1 channels than 1A. All graph and table data presented as mean ± SEM.

Similar articles

Cited by

References

    1. Schubert C. R., Xi H. S., Wendland J. R. & O’Donnell P. Translating human genetics into novel treatment targets for schizophrenia. Neuron 84, 537–541 (2014). - PubMed
    1. Network & Pathway Analysis Subgroup of Psychiatric Genomics, C. Psychiatric genome-wide association study analyses implicate neuronal, immune and histone pathways. Nat. Neurosci. 18, 199–209 (2015). - PMC - PubMed
    1. Schizophrenia Working Group of the Psychiatric Genomics, C. Biological insights from 108 schizophrenia-associated genetic loci. Nature 511, 421–427 (2014). - PMC - PubMed
    1. Harrison P. J. The current and potential impact of genetics and genomics on neuropsychopharmacology. Eur. Neuropsychopharmacol. 25, 671–681 (2015). - PubMed
    1. Huffaker S. J. et al. A primate-specific, brain isoform of KCNH2 affects cortical physiology, cognition, neuronal repolarization and risk of schizophrenia. Nat. Med. 15, 509–518 (2009). - PMC - PubMed

Publication types

MeSH terms