Theta synchronization between medial prefrontal cortex and cerebellum is associated with adaptive performance of associative learning behavior
- PMID: 26879632
- PMCID: PMC4754690
- DOI: 10.1038/srep20960
Theta synchronization between medial prefrontal cortex and cerebellum is associated with adaptive performance of associative learning behavior
Abstract
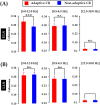
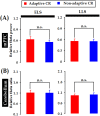
Associative learning is thought to require coordinated activities among distributed brain regions. For example, to direct behavior appropriately, the medial prefrontal cortex (mPFC) must encode and maintain sensory information and then interact with the cerebellum during trace eyeblink conditioning (TEBC), a commonly-used associative learning model. However, the mechanisms by which these two distant areas interact remain elusive. By simultaneously recording local field potential (LFP) signals from the mPFC and the cerebellum in guinea pigs undergoing TEBC, we found that theta-frequency (5.0-12.0 Hz) oscillations in the mPFC and the cerebellum became strongly synchronized following presentation of auditory conditioned stimulus. Intriguingly, the conditioned eyeblink response (CR) with adaptive timing occurred preferentially in the trials where mPFC-cerebellum theta coherence was stronger. Moreover, both the mPFC-cerebellum theta coherence and the adaptive CR performance were impaired after the disruption of endogenous orexins in the cerebellum. Finally, association of the mPFC -cerebellum theta coherence with adaptive CR performance was time-limited occurring in the early stage of associative learning. These findings suggest that the mPFC and the cerebellum may act together to contribute to the adaptive performance of associative learning behavior by means of theta synchronization.
Figures




Similar articles
-
Predictive nature of prefrontal theta oscillation on the performance of trace conditioned eyeblink responses in guinea pigs.Behav Brain Res. 2014 May 15;265:121-31. doi: 10.1016/j.bbr.2014.02.020. Epub 2014 Feb 23. Behav Brain Res. 2014. PMID: 24572215
-
Baseline theta activities in medial prefrontal cortex and deep cerebellar nuclei are associated with the extinction of trace conditioned eyeblink responses in guinea pigs.Behav Brain Res. 2014 Dec 15;275:72-83. doi: 10.1016/j.bbr.2014.08.059. Epub 2014 Sep 6. Behav Brain Res. 2014. PMID: 25200518
-
Increased Entorhinal-Prefrontal Theta Synchronization Parallels Decreased Entorhinal-Hippocampal Theta Synchronization during Learning and Consolidation of Associative Memory.Front Behav Neurosci. 2012 Jan 5;5:90. doi: 10.3389/fnbeh.2011.00090. eCollection 2011. Front Behav Neurosci. 2012. PMID: 22319482 Free PMC article.
-
Harnessing the power of theta: natural manipulations of cognitive performance during hippocampal theta-contingent eyeblink conditioning.Front Syst Neurosci. 2015 Apr 13;9:50. doi: 10.3389/fnsys.2015.00050. eCollection 2015. Front Syst Neurosci. 2015. PMID: 25918501 Free PMC article. Review.
-
The neural circuitry and molecular mechanisms underlying delay and trace eyeblink conditioning in mice.Behav Brain Res. 2015 Feb 1;278:307-14. doi: 10.1016/j.bbr.2014.10.006. Epub 2014 Oct 17. Behav Brain Res. 2015. PMID: 25448430 Review.
Cited by
-
Ventromedial Thalamus-Projecting DCN Neurons Modulate Associative Sensorimotor Responses in Mice.Neurosci Bull. 2022 May;38(5):459-473. doi: 10.1007/s12264-021-00810-9. Epub 2022 Jan 6. Neurosci Bull. 2022. PMID: 34989972 Free PMC article.
-
Short-Term Synaptic Plasticity Makes Neurons Sensitive to the Distribution of Presynaptic Population Firing Rates.eNeuro. 2021 Apr 8;8(2):ENEURO.0297-20.2021. doi: 10.1523/ENEURO.0297-20.2021. Print 2021 Mar-Apr. eNeuro. 2021. PMID: 33579731 Free PMC article.
-
VTA-projecting cerebellar neurons mediate stress-dependent depression-like behaviors.Elife. 2022 Feb 14;11:e72981. doi: 10.7554/eLife.72981. Elife. 2022. PMID: 35156922 Free PMC article.
-
Absence of modulatory effects of 6Hz cerebellar transcranial alternating current stimulation on fear learning in men.Front Hum Neurosci. 2024 Jan 9;17:1328283. doi: 10.3389/fnhum.2023.1328283. eCollection 2023. Front Hum Neurosci. 2024. PMID: 38264350 Free PMC article.
-
Sustained Activity of Hippocampal Parvalbumin-Expressing Interneurons Supports Trace Eyeblink Conditioning in Mice.J Neurosci. 2022 Nov 2;42(44):8343-8360. doi: 10.1523/JNEUROSCI.0834-22.2022. Epub 2022 Sep 27. J Neurosci. 2022. PMID: 36167784 Free PMC article.
References
-
- Woodruff-Pak D. S. & Disterhoft J. F. Where is the trace in trace conditioning? Trends Neurosci. 31, 105–112 (2008). - PubMed
-
- Chen H. et al. Prefrontal control of cerebellum-dependent associative motor learning. Cerebellum 13, 64–78 (2014). - PubMed
-
- Longley M. & Yeo C. H. Distribution of neural plasticity in cerebellum-dependent motor learning. Prog. Brain Res. 210, 79–101 (2014). - PubMed
Publication types
MeSH terms
LinkOut - more resources
Full Text Sources
Other Literature Sources

