. 2016 May;39(5):773-84.
doi: 10.1007/s00449-016-1557-1. Epub 2016 Feb 15.

Hybrid modeling as a QbD/PAT tool in process development: an industrial E. coli case study

Affiliations

Hybrid modeling as a QbD/PAT tool in process development: an industrial E. coli case study

Moritz von Stosch et al. Bioprocess Biosyst Eng. 2016 May.

Abstract

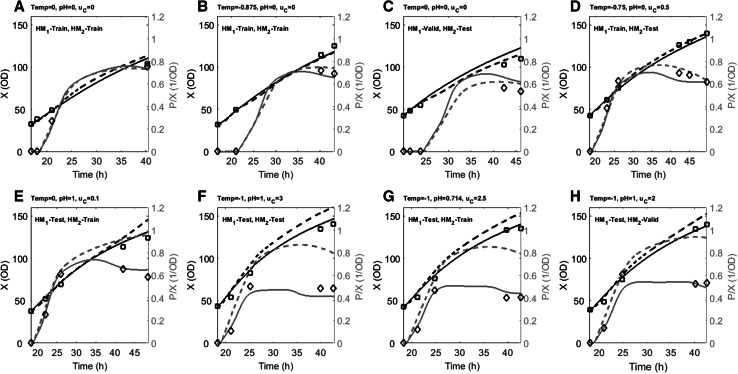
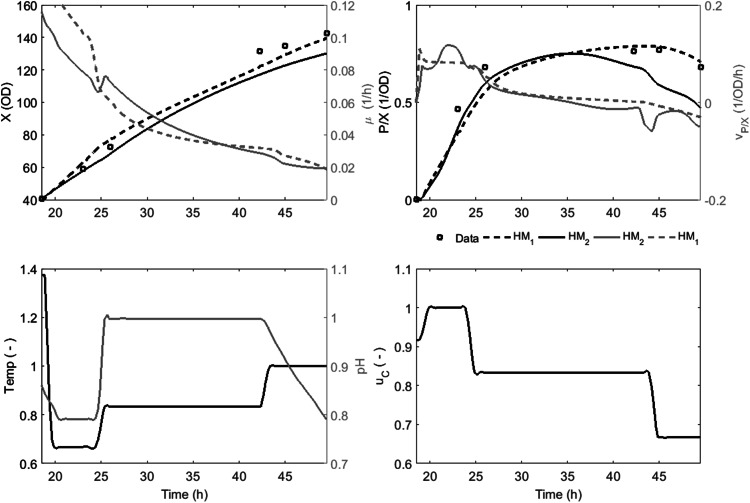
Process understanding is emphasized in the process analytical technology initiative and the quality by design paradigm to be essential for manufacturing of biopharmaceutical products with consistent high quality. A typical approach to developing a process understanding is applying a combination of design of experiments with statistical data analysis. Hybrid semi-parametric modeling is investigated as an alternative method to pure statistical data analysis. The hybrid model framework provides flexibility to select model complexity based on available data and knowledge. Here, a parametric dynamic bioreactor model is integrated with a nonparametric artificial neural network that describes biomass and product formation rates as function of varied fed-batch fermentation conditions for high cell density heterologous protein production with E. coli. Our model can accurately describe biomass growth and product formation across variations in induction temperature, pH and feed rates. The model indicates that while product expression rate is a function of early induction phase conditions, it is negatively impacted as productivity increases. This could correspond with physiological changes due to cytoplasmic product accumulation. Due to the dynamic nature of the model, rational process timing decisions can be made and the impact of temporal variations in process parameters on product formation and process performance can be assessed, which is central for process understanding.

Keywords: Dynamic modeling; E. coli; High cell density fermentation; Hybrid modeling; Upstream bioprocess development/optimization.


Figures

Fig. 1
Fig. 1
Left side ad HM1 regression plots for biomass, specific and volumetric productivity and for accumulated base addition. Right side eh HM2 regression plots for biomass concentration, specific and volumetric productivity and for the accumulated base addition. Specific and volumetric productivity as well as accumulated base addition were scaled for confidentiality reasons. The training partition is displayed as red stars, the validation partition as blue crosses and the test partition points are represented by a green x. Mathematical symbols as in the text
Fig. 2
Fig. 2
Left side Regression plot for residual of the product concentration for HM2. Right side Regression coefficients that correlate the mean centered and standard deviation scaled process variables to the residual
Fig. 3
Fig. 3
Dynamic profiles for HM1 (dashed lines) and HM2 (continuous lines) model estimates for biomass and scaled specific productivity and their respective experimental data points (squares biomass, diamonds P/X). Selected batches at different process conditions that are indicated above the graphs. Biomass at induction can be derived from the graph. Top row conditions within DoE 1 design space. Bottom row conditions outside DoE 1 design space. Note that due to variation in induction periods and sampling frequencies, different time spans are covered for different batches
Fig. 4
Fig. 4
HM2 model estimates for specific biomass growth rate (left side) and specific productivity rate (right side) as function of temperature, pH (−1 to 1 with step size 0.5, the arrow indicates increasing pH) and feeding rate at different stages of the process. A&D, early induction: OD 50, P/X = 0.125 OD−1; B&E, mid induction: OD 80, P/X = 0.25 OD−1; and C&F, late induction: OD 100, P/X = 0.5 OD−1. Note that for visibility reasons the x- and y-axis in F are switched and the direction in which feeding rate increases is inverted
Fig. 5
Fig. 5
Dynamic batch profiles of a fermentation performed at variable conditions (Dataset #4 in Table 1). Upper left side biomass concentration and specific biomass growth rate. Upper right side specific productivity and specific productivity rate. Lower left side process temperature and pH. Lower right side feeding rate

Similar articles

Cited by

References

    1. Fuhr T, Holcomb M, Rutten P (2009) Why quality-by-design should be on the executive team's agenda: developing new strategies for new times. In: Losch M, Schrader U (eds) Outpacing change in pharma operations. McKinsey & Co, pp 195–203
    1. FDA (2004) Guidance for industry-PAT—a framework for innovative pharmaceutical development, manufacturing, and quality assurance. Pharmaceutical CGMPs
    1. Chew W, Sharratt P. Trends in process analytical technology. Anal Methods. 2010;2(10):1412–1438. doi: 10.1039/c0ay00257g. - DOI
    1. Glassey J, et al. Process analytical technology (PAT) for biopharmaceuticals. Biotechnol J. 2011;6(4):369–377. doi: 10.1002/biot.201000356. - DOI - PubMed
    1. Rathore AS, Winkle H. Quality by design for biopharmaceuticals. Nat Biotechnol. 2009;27(1):26–34. doi: 10.1038/nbt0109-26. - DOI - PubMed

Publication types

Substances

LinkOut - more resources