

Early atherosclerosis aggravates renal microvascular loss and fibrosis in swine renal artery stenosis
- PMID: 26879682
- PMCID: PMC4829440
- DOI: 10.1016/j.jash.2016.01.019
Early atherosclerosis aggravates renal microvascular loss and fibrosis in swine renal artery stenosis
Abstract
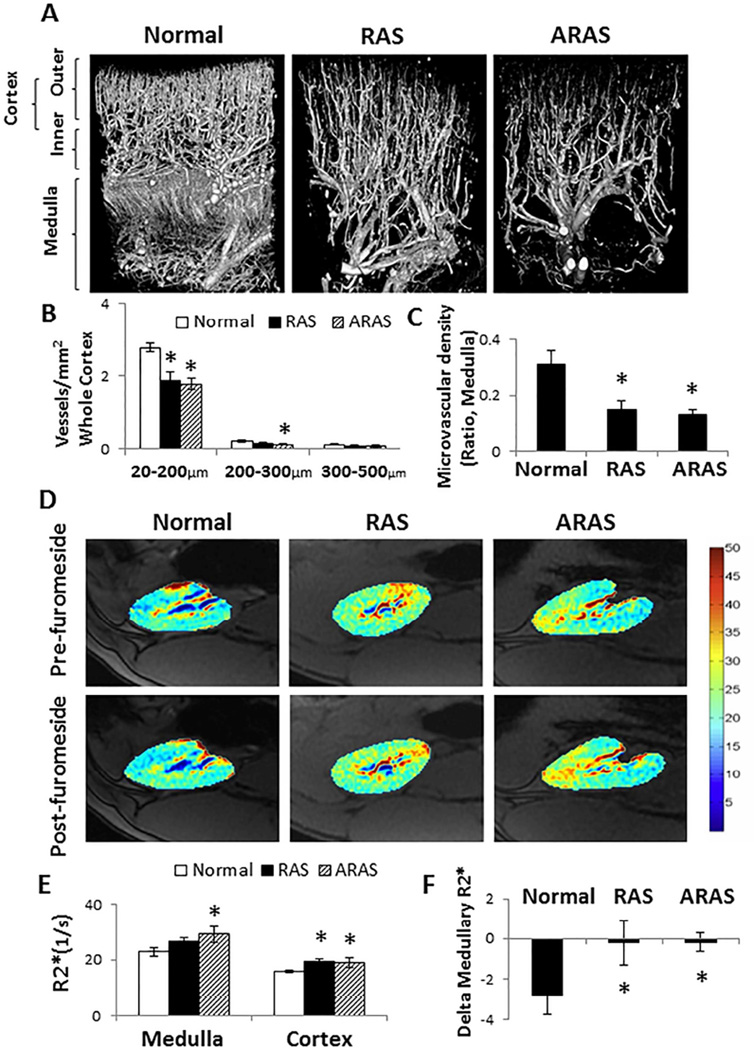
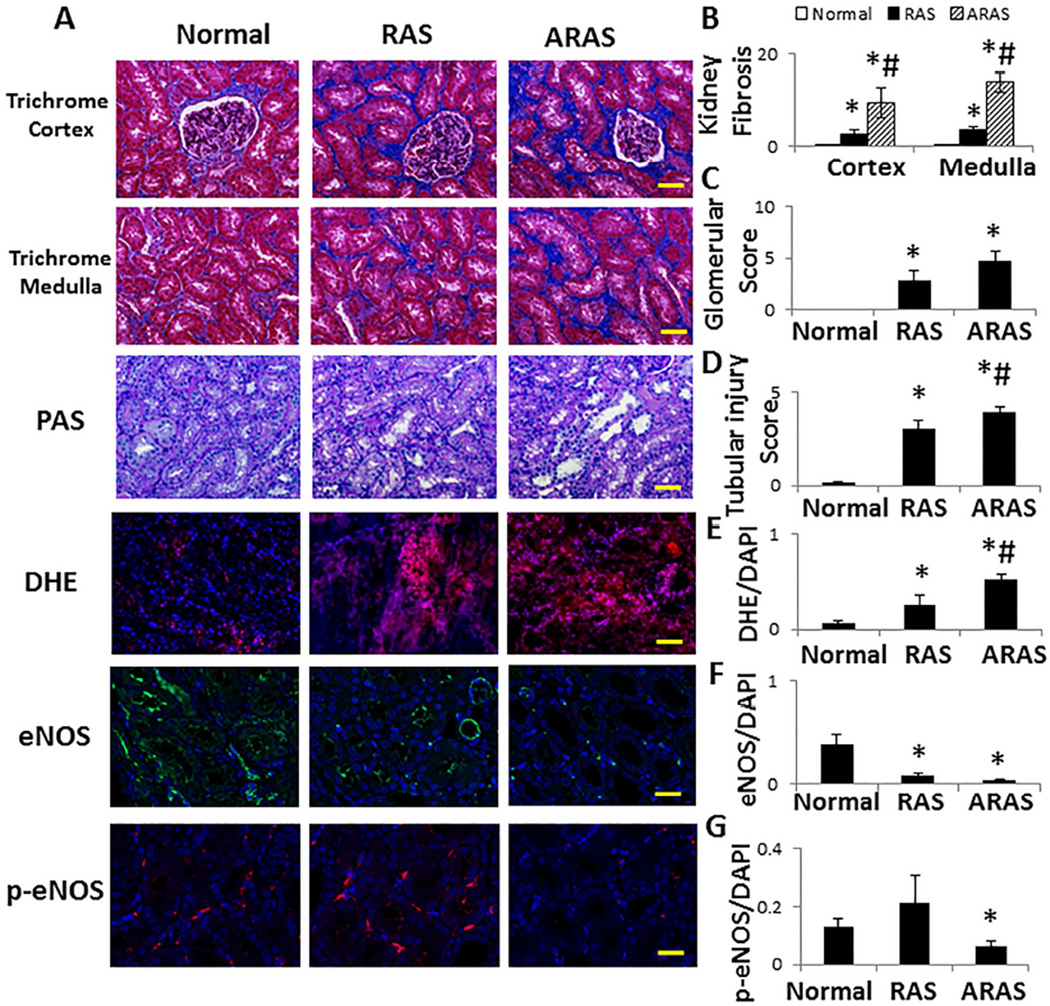
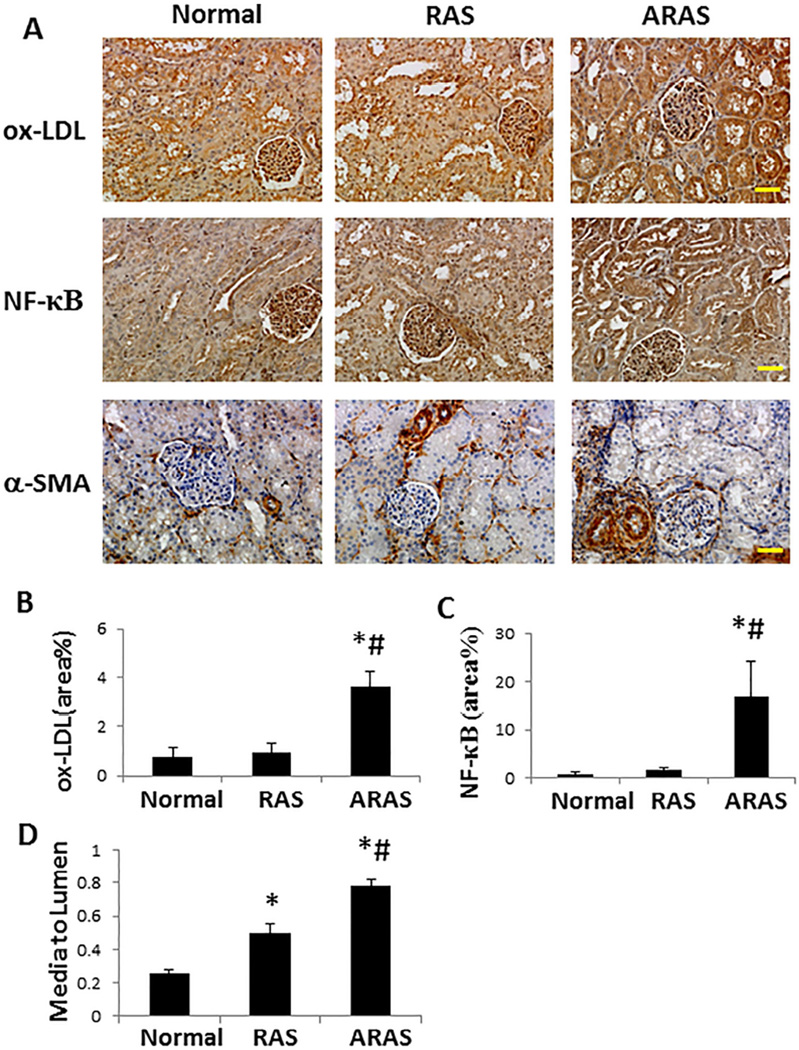
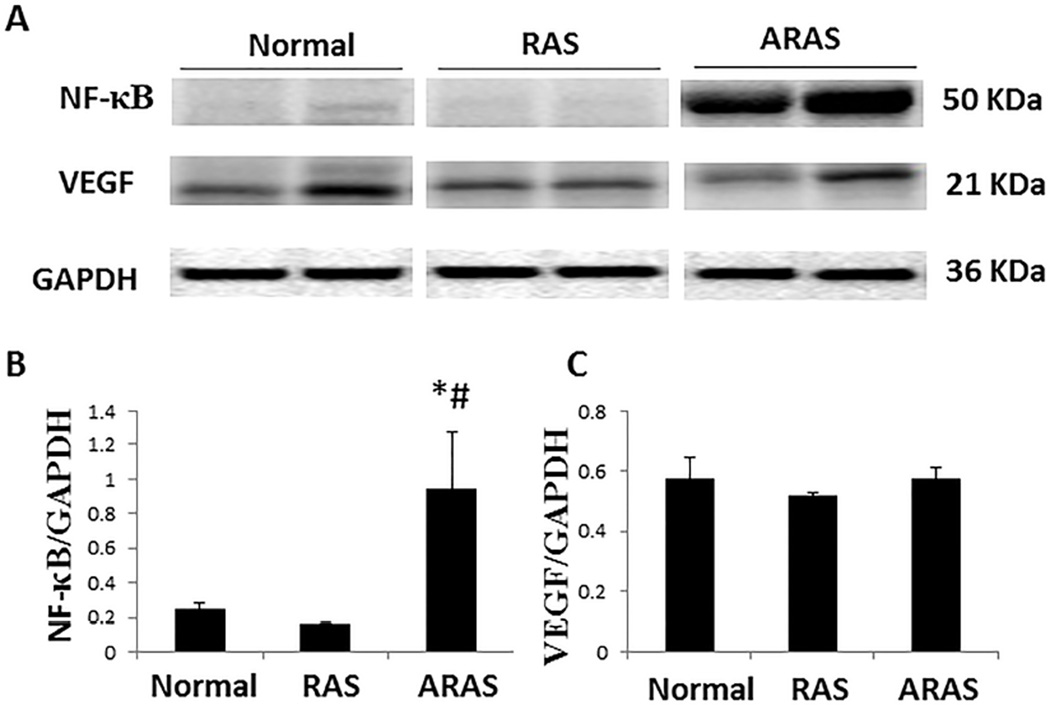
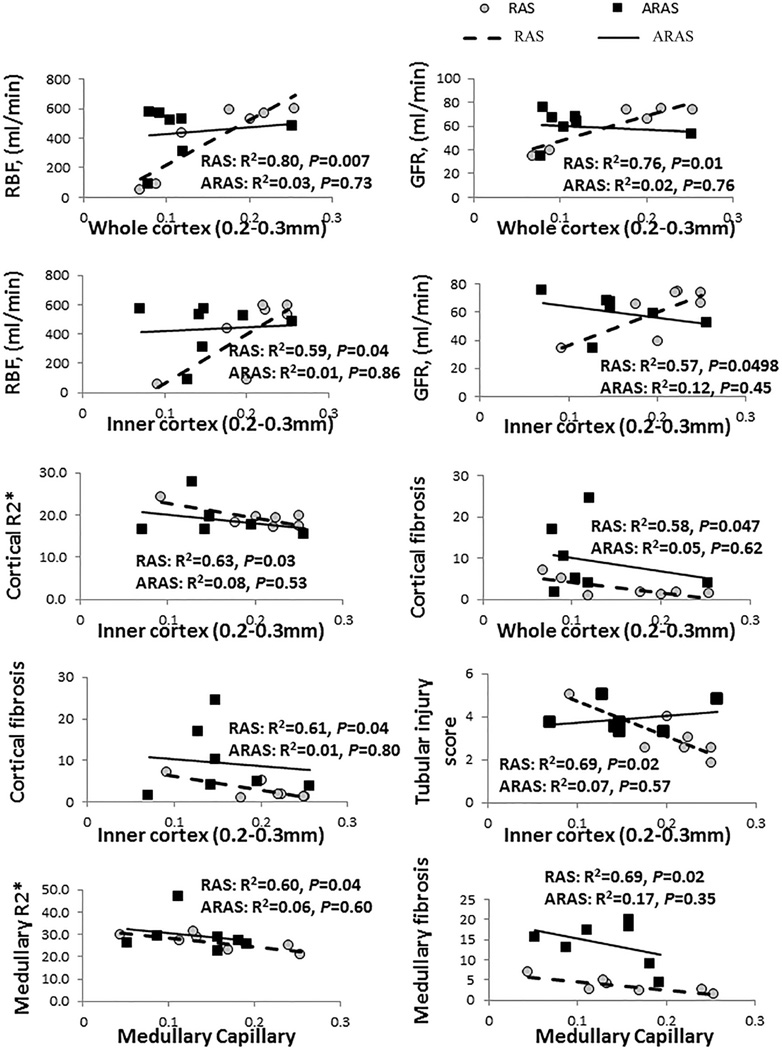
Renal function in patients with atherosclerosis and renal artery stenosis (ARAS) deteriorates more frequently than in nonatherosclerotic RAS. We hypothesized that ARAS aggravates stenotic-kidney micro vascular loss compared to RAS. Domestic pigs were randomized to normal, RAS, and ARAS (RAS fed a high-cholesterol diet) groups (n = 7 each). Ten weeks later stenotic-kidney oxygenation, renal blood flow, and glomerular filtration rate (GFR) were evaluated in vivo, and micro vascular density by micro-computed tomography. Blood pressure in both RAS and ARAS was elevated; and stenotic-kidney renal blood flow and GFR similarly decreased. RAS decreased the density of small-size cortical microvessels (<200 μm), whereas ARAS extended the decrease to medium-sized microvessels (200-300 μm). Cortical hypoxia and interstitial fibrosis increased in both RAS and ARAS but correlated inversely with micro vascular density only in RAS. Atherosclerosis aggravates loss of stenotic-kidney microvessels, yet additional determinants likely contribute to cortical hypoxia and fibrosis in swine ARAS.
Keywords: Atherosclerosis; fibrosis; micro vascular injury; renal artery stenosis.
Copyright © 2016 American Society of Hypertension. Published by Elsevier Inc. All rights reserved.
Conflict of interest statement
The authors declare no conflict of interest.
Figures
Similar articles
-
Early atherosclerosis aggravates the effect of renal artery stenosis on the swine kidney.Am J Physiol Renal Physiol. 2010 Jul;299(1):F135-40. doi: 10.1152/ajprenal.00159.2010. Epub 2010 May 12. Am J Physiol Renal Physiol. 2010. PMID: 20462971 Free PMC article.
-
Adjunctive mesenchymal stem/stromal cells augment microvascular function in poststenotic kidneys treated with low-energy shockwave therapy.J Cell Physiol. 2020 Dec;235(12):9806-9818. doi: 10.1002/jcp.29794. Epub 2020 May 19. J Cell Physiol. 2020. PMID: 32430932 Free PMC article.
-
Adipose tissue-derived mesenchymal stem cells improve revascularization outcomes to restore renal function in swine atherosclerotic renal artery stenosis.Stem Cells. 2012 May;30(5):1030-41. doi: 10.1002/stem.1047. Stem Cells. 2012. PMID: 22290832 Free PMC article.
-
[Imaging strategies for renovascular disease].G Ital Nefrol. 2005 May-Jun;22(3):226-34. G Ital Nefrol. 2005. PMID: 16001366 Review. Italian.
-
Mechanisms of tissue injury in renal artery stenosis: ischemia and beyond.Prog Cardiovasc Dis. 2009 Nov-Dec;52(3):196-203. doi: 10.1016/j.pcad.2009.09.002. Prog Cardiovasc Dis. 2009. PMID: 19917330 Free PMC article. Review.
Cited by
-
Improved renal outcomes after revascularization of the stenotic renal artery in pigs by prior treatment with low-energy extracorporeal shockwave therapy.J Hypertens. 2019 Oct;37(10):2074-2082. doi: 10.1097/HJH.0000000000002158. J Hypertens. 2019. PMID: 31246892 Free PMC article.
-
Cell-based regenerative medicine for renovascular disease.Trends Mol Med. 2021 Sep;27(9):882-894. doi: 10.1016/j.molmed.2021.06.004. Epub 2021 Jun 25. Trends Mol Med. 2021. PMID: 34183258 Free PMC article. Review.
-
Microvascular remodeling and altered angiogenic signaling in human kidneys distal to occlusive atherosclerotic renal artery stenosis.Nephrol Dial Transplant. 2022 Sep 22;37(10):1844-1856. doi: 10.1093/ndt/gfac156. Nephrol Dial Transplant. 2022. PMID: 35451482 Free PMC article.
-
Perspectives on the Role of Magnetic Resonance Imaging (MRI) for Noninvasive Evaluation of Diabetic Kidney Disease.J Clin Med. 2021 Jun 2;10(11):2461. doi: 10.3390/jcm10112461. J Clin Med. 2021. PMID: 34199385 Free PMC article. Review.
-
Superimposition of metabolic syndrome magnifies post-stenotic kidney injury in dyslipidemic pigs.Am J Transl Res. 2021 Aug 15;13(8):8965-8976. eCollection 2021. Am J Transl Res. 2021. PMID: 34540008 Free PMC article.
References
-
- Hansen KJ, Edwards MS, Craven TE, Cherr GS, Jackson SA, Appel RG, Burke GL, Dean RH. Prevalence of renovascular disease in the elderly: a population-based study. Journal of vascular surgery. 2002;36(3):443–451. - PubMed
-
- Eirin A, Ebrahimi B, Zhang X, Zhu XY, Tang H, Crane JA, Lerman A, Textor SC, Lerman LO. Changes in Glomerular Filtration Rate After Renal Revascularization Correlate With Microvascular Hemodynamics and Inflammation in Swine Renal Artery Stenosis. Circulation: Cardiovascular Interventions. 2012;5(5):720–728. - PMC - PubMed
-
- Kalra PA, Guo H, Kausz AT, Gilbertson DT, Liu J, Chen SC, Ishani A, Collins AJ, Foley RN. Atherosclerotic renovascular disease in United States patients aged 67 years or older: risk factors, revascularization, and prognosis. Kidney Int. 2005;68(1):293–301. - PubMed
-
- Dejani H, Eisen TD, Finkelstein FO. Revascularization of renal artery stenosis in patients with renal insufficiency. Am J Kidney Dis. 2000;36(4):752–758. - PubMed
Publication types
MeSH terms
Substances
Grants and funding
LinkOut - more resources
Full Text Sources
Other Literature Sources
Medical
