. 2016 Feb 16:6:21206.
doi: 10.1038/srep21206.

Non-canonical features of the Golgi apparatus in bipolar epithelial neural stem cells

Affiliations

Non-canonical features of the Golgi apparatus in bipolar epithelial neural stem cells

Elena Taverna et al. Sci Rep. .

Abstract

Apical radial glia (aRG), the stem cells in developing neocortex, are unique bipolar epithelial cells, extending an apical process to the ventricle and a basal process to the basal lamina. Here, we report novel features of the Golgi apparatus, a central organelle for cell polarity, in mouse aRGs. The Golgi was confined to the apical process but not associated with apical centrosome(s). In contrast, in aRG-derived, delaminating basal progenitors that lose apical polarity, the Golgi became pericentrosomal. The aRG Golgi underwent evolutionarily conserved, accordion-like compression and extension concomitant with cell cycle-dependent nuclear migration. Importantly, in line with endoplasmic reticulum but not Golgi being present in the aRG basal process, its plasma membrane contained glycans lacking Golgi processing, consistent with direct ER-to-cell surface membrane traffic. Our study reveals hitherto unknown complexity of neural stem cell polarity, differential Golgi contribution to their specific architecture, and fundamental Golgi re-organization upon cell fate change.


Figures

Figure 1
Figure 1. Subcellular localization of the Golgi apparatus in aRG.
(A) DAPI-stained E13.5 wt mouse telencephalon; single 1.5-μm optical section. Box: region of dorsolateral telencephalon examined in this study; V, ventricle. Scale bar, 100 μm. (B) Cartoon illustrating major features of aRG morphology and INM. (C) aRG in dorsolateral telencephalon of E13.5 GFAP::GFP transgenic mouse embryo, identified by GFP immunofluorescence (green, stack of 30 0.8-μm optical sections) combined with DAPI staining (blue, single 0.8-μm optical section at z-position of the indicated nuclei); arrowheads: apical process contacting ventricle (bottom) and basal process reaching the basal lamina (top). Scale bar, 20 μm. IZ, intermediate zone; in (C-F), the CP and IZ are indicated together; in the following figures, these layers are indicated as CP only. (D) aRG nuclei in VZ of dorsolateral telencephalon of E13.5 wt mouse embryo immunostained for Pax6 (green) combined with DAPI staining (blue, 0.8-μm optical sections). Scale bar, 10 μm. (E) Golgi apparatus in dorsolateral telencephalon of E14.5 wt mouse embryo revealed by GRASP-65 (red) and giantin (green) double immunofluorescence combined with DAPI staining (blue, 0.8-μm optical sections). Scale bar, 20 μm. (F) Subcellular localization of Golgi apparatus, revealed by GRASP-65 immunofluorescence (red), in an individual aRG in dorsolateral telencephalon of E13.5 GFAP::GFP transgenic mouse embryo, identified by GFP immunofluorescence (green, stack of 13 0.8-μm optical sections). Diagram: localization of all Golgi units (arrows) in the cell as reconstructed from the series of optical sections. Dashed lines, ventricular surface (bottom) and basal lamina (top). Scale bar, 10 μm. (G) Bottom row: presence of Golgi apparatus in the apical process of the aRG shown in (F). Top row: absence of Golgi apparatus in the basal process of another aRG, analyzed as in (F); dashed lines, basal lamina. Scale bars, 2 μm. (H,I) Z-stacks of APs in VZ of dorsolateral telencephalon of E14.5 wt mouse embryo co-electroporated in utero at E13.5 with plasmids encoding mCherry and either GalNAcT2-GFP (H) or GM130-GFP (I). Images are consecutive 0.8 μm optical sections. Diagrams: localization of all Golgi units (arrows) in the respective APs. Dashed lines, ventricular surface. Scale bars, 10 μm.
Figure 2
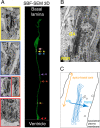
Figure 2. Electron microscopy analyses of the Golgi apparatus in aRG.
(A) SBF-SEM 3D reconstruction of an individual aRG (right) in E12.5 wt mouse dorsolateral telencephalon. Green, cell volume; arrows, Golgi units; arrowhead, centrosome. Asterisks indicate areas shown as electron micrographs on the left; note the color-coding. Dashed line, ventricular surface. Scale bars, 500 nm. (B) Transmission electron micrograph of a Golgi stack in the apical process of an aRG in E12.5 wt mouse dorsolateral telencephalon. Note the orientation of the cis-to-trans polarity axis of the Golgi apparatus (GA) perpendicular to the long axis of the apical process, i.e. the apico-basal axis of the cell. RER, rough endoplasmic reticulum. Scale bar, 100 nm. (C) Cartoon illustrating the orientation of the Golgi apparatus shown in (B).
Figure 3
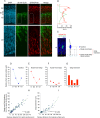
Figure 3. aRG Golgi apparatus during INM.
(A,B) E13.5 wt mouse embryos were pulse-labeled for 30 min with EdU followed by fixation. (A) Dorsolateral telencephalon (immuno)stained for GRASP-65 (red) and EdU (green) combined with DAPI staining (cyan). Images are 1-μm optical sections. Scale bar, 20 μm. (B) Quantification across cortical wall (top, pia; bottom, ventricle) of the GRASP-65 and EdU (immuno)fluorescence signals shown in (A). (C–I) Brains from E13.5 GFAP::GFP transgenic mouse embryos were either fixed (to identify aRG in M-phase and G1), or hemispheres were dissected, pulse-labeled for 30 min with EdU and either fixed (to identify aRG in S-phase) or chased for 60, 90 or 120 min followed by fixation (to identify aRG in G2). Dorsolateral telencephalon was (immuno)stained for GRASP-65, GFP and either EdU (aRG in S, G2) or cyclin D1 (aRG in G1), combined with DAPI staining (to identify aRG in M). (C) Example of determining the positions of nucleus (DAPI, blue) and Golgi units (GRASP-65, red) in an individual aRG (GFP, green) (single 1-μm optical section). Triple staining was used to determine the distance from apical surface (blue line) of apical-most Golgi unit (red square), basal-most Golgi unit (red triangle) and center of nucleus (blue circle), and to calculate the extension of the Golgi apparatus (see diagram on right). Scale bar, 10 μm. (D–G) Distance from apical plasma membrane of aRG nucleus (D), basal-most Golgi unit (E) and apical-most Golgi unit (F), and extension of the Golgi apparatus within the aRG apical process (G). Data are the mean of 23 (S, G2), 48 (M) and 42 (G1) individual aRG; error bars indicate SEM. aRG in G2 are the mean of 60, 90 and 120 min of chase. (H,I) Correlation between the distance, from apical plasma membrane, of nucleus and either basal-most Golgi unit (H) or the Golgi extension (I) in 136 identified aRG. Linear correlation in (H) (y = 0.7794x + 6.2656, R2 = 0.89506), non-linear (second order polynomial) correlation in (I) (y = 0.0046 × 2 + 0.1319x + 8.6358, R2 = 0.85108) (dashed green lines).
Figure 4
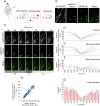
Figure 4. Live imaging of the dynamics of the aRG Golgi apparatus during INM.
APs in the VZ of dorsolateral telencephalon of E13.5 wt mouse embryos were co-electroporated in utero with plasmids encoding constitutively expressed GAP-43-GFP and GalNAcT2-Cherry; analyses started 24 h later. (A) Cartoon of the in utero electroporation procedure. (B) Expression of GAP-43-GFP (white) and GalNAcT2-Cherry (red) in aRG. Note the colocalization of GalNAcT2-Cherry with Golgi units (arrowheads), as revealed by GRASP-65 immunofluorescence (green). Dashed lines in the right panel indicate the two GAP-43-GFP–expressing aRG containing the indicated Golgi units. Images are stacks of 7 0.8-μm optical sections. Scale bar, 10 μm. (C) Still images from live time-lapse imaging of organotypic slices showing an aRG expressing GAP-43-GFP (top row, green in merge (bottom row)) and GalNAcT2-Cherry (middle row, red in merge (bottom row)) and undergoing INM followed by mitosis (0 min time point). Yellow arrows, position of mother aRG nucleus and daughter cell nuclei as revealed by GAP-43-GFP fluorescence; yellow arrowheads, position of apical-most and basal-most Golgi units in mother aRG and apical daughter cell as revealed by GalNAcT2-Cherry fluorescence. Images are stacks of 6 1-μm optical sections. Scale bar, 10 μm. (D–F). Live time-lapse imaging traces (20-min intervals) of 14 aRG undergoing INM followed by mitosis (set to 0 min time point, dashed line) and of one of their daughter cells (usually the apical one), showing the distance from the apical plasma membrane of the nucleus as revealed by GAP-43-GFP fluorescence (D) and of the basal-most (E) and apical-most (F) Golgi units as revealed by GalNAcT2-Cherry fluorescence. (G) Extension of the Golgi apparatus (from apical-most to basal-most unit) during INM and mitosis in 14 aRG and one of their daughter cells, calculated from the live time-lapse imaging traces shown in (E,F). Data are the mean ± SEM. (H) Correlation between the distance of the basal-most Golgi unit from the apical plasma membrane and the distance of the nucleus from the apical plasma membrane in 578 aRG. Note the linear correlation (y = 1.0159x – 0.4237, R2 = 0.8893) (dashed green line).
Figure 5
Figure 5. The aRG Golgi apparatus is not pericentrosomal.
(A) Double immunofluorescence of the VZ of dorsolateral telencephalon of E13.5 wt mouse embryos for the Golgi marker GRASP-65 (red) and the centrosome marker γ-tubulin (green), combined with DAPI staining (cyan). Images are single 1-μm optical sections. Scale bar, 10 μm. (B) Dorsolateral telencephalon of E13.5 GFAP::GFP transgenic mouse embryos was immunostained for GRASP-65, γ-tubulin and GFP, combined with DAP staining. The distance from the apical plasma membrane of the centrosome (green circles) and the apical-most Golgi unit (red squares) in individual aRG, as revealed by GFP immunofluorescence, was determined from series of optical sections. aRG in specific phases of the cell cycle were identified as described in the legend to Fig. 3C–I. Data for the apical-most Golgi are the same as in Fig. 3F and are the mean of 23 (S, G2), 48 (M) and 42 (G1) individual aRG; data for the centrosome are the mean of 38 (S), 55 (G1, G2) and 20 (M) individual aRG; error bars indicate SEM.
Figure 6
Figure 6. A non-pericentrosomal localization and an INM-linked extension of the Golgi apparatus are evolutionary conserved features of columnar epithelial cells.
(A–D) The Golgi apparatus in cells of the simple columnar epithelium of adult mouse duodenal mucosa. (A) Transmission electron micrograph. Cell 1and cell 2 are shown at higher magnification in (B) and (C,D), respectively. Scale bar, 2 μm. (B–D) Higher magnification transmission electron micrographs showing the Golgi apparatus (GA) and centrosome (C) of cell 1 (B) and cell 2 (C,D) indicated in (A). Insets in (B,D), Golgi apparatus. Scale bars, 200 nm; insets, 100 nm. (E–G) Dynamics of the Golgi apparatus in pseudostratified columnar epithelial cells of developing zebrafish retina. (E) Confocal image (stack of 5 1-μm optical sections) showing the localization of the Golgi apparatus (CFP-tagged beta-galactosyltransferase, GalTase–CFP, cyan, arrowheads) and centrosome (GFP-centrin, green, arrows) in a retinal neuroepithelial cell. The plasma membrane and nucleus are revealed by expression of mKate2-ras (red) and histone H2B-RFP (red), respectively. Diagram: localization of the Golgi (GA), apical centrosome (C) and nucleus (N) as reconstructed from single optical sections. Scale bar, 5 μm. (F) Still images (stacks of 5–10 1-μm optical sections) from live time-lapse imaging (5-min intervals) showing the localization and extension of the Golgi apparatus in a retinal neuroepithelial cell and one of its daughter cells as revealed by expression of GFP-GM130 (magenta); apical-most and basal-most extension of the Golgi apparatus is indicated by arrowheads. The position of the nucleus and the progression through the cell cycle are revealed by expression of RFP-PCNA (green; mother cell S-to-G2, punctate-to-diffuse nuclear pattern; daughter cell G1-to-S, diffuse-to-punctate nuclear pattern). The plasma membrane is revealed by expression of mKate2-ras (green). The mother cell undergoes INM followed by mitosis (set to 0 min time point), and the nuclei of the daughter cells migrate basally (nuclei are indicated by asterisks). Scale bar, 5 μm. (G) Live time-lapse imaging traces (5-min intervals) of the mother neuroepithelial cell and its apical daughter cell shown in (F). Cell cycle phases were deduced from the nuclear PCNA pattern.
Figure 7
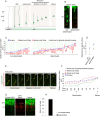
Figure 7. Subcellular localization and extension of the Golgi apparatus in newborn delaminating BPs.
Analysis of the Golgi apparatus in newborn, delaminating BPs (A) in dorsolateral telencephalon of E13.5 Eomes::GFP transgenic mouse embryos (B–D, G,H) and of E14.5 wt mouse embryos co-electroporated in utero at E13.5 with plasmids encoding GAP-43-GFP and GalNAcT2-Cherry (E,F). (A) Cartoon illustrating major features of basal intermediate progenitor (bIP) delamination. (B) Subcellular localization of the Golgi apparatus (GRASP-65 immunofluorescence, red) in a non-delaminated (left) and delaminated (right) bIP (Eomes::GFP, green). Asterisks, nucleus; arrowheads, basal-most and apical-most Golgi unit; arrow, retracting apically directed process. Dashed lines, ventricular surface. Images are stacks of 5 (left) and 6 (right) 0.9-μm optical sections. Scale bar, 20 μm. (C) Distance from apical surface of the nucleus (blue circles), basal-most (red triangles) and apical-most (red squares) Golgi units, and apical end of apically directed process (green horizontal bars) in individual (light green vertical lines) BPs with (non-delaminated, left) and without (delaminated, right) apical contact. (D) Mean of the data shown in (C); error bars indicate SEM. (E) Still images from live time-lapse imaging (20-min intervals) of organotypic slices showing a newborn bIP expressing GAP-43-GFP (green) and GalNAcT2-Cherry (red) that undergoes delamination from the ventricular surface followed by migration to the SVZ and mitosis. Asterisks, nucleus; yellow arrowheads, apical-most and basal-most Golgi units; white arrow, apical end of the retracting apically directed process. Images are stacks of 3 1-μm optical sections. Scale bar, 10 μm. (F) Live time-lapse imaging traces of the newborn delaminating bIP shown in (E). (G) E13.5 Eomes::GFP mice were pulse-labeled for 30 min with EdU followed by fixation. Dorsolateral telencephalon was (immuno)stained for GFP (to identify individual BPs, green) and EdU (to identify BPs in S-phase, red). Arrows, EdU-positive BPs. Images are single 1-μm optical sections. Scale bar, 5 μm. (H) Percentage of EdU-positive BPs in S-phase, labeled and identified as in (G), lacking (delaminated, black) or still exhibiting (non-delaminated, white) apical contact, as reconstructed from the series of optical sections of Eomes::GFP immunofluorescence.
Figure 8
Figure 8. The Golgi apparatus becomes pericentrosomal in delaminated BPs.
(A) Subcellular localization of the Golgi apparatus, as revealed by GRASP-65 immunofluorescence (red), and centrosomes, as revealed by the punctate γ-tubulin immunofluorescence (green), in the SVZ of E13.5 wt mouse dorsolateral telencephalon. An example showing the proximity of the Golgi apparatus (arrowheads) and the centrosome (arrows) is indicated. Images are single 1-μm optical section. Scale bar, 10 μm. (B) Adjacent transmission electron micrographs of a presumptive bIP in the SVZ of E13.5 wt mouse dorsolateral telencephalon. Left section shows the centrosome (C) constituting the basal body of a primary cilium; right section shows the Golgi apparatus (GA) Scale bars, 1 μm. (C) E13.5 Eomes::GFP (top row) or GFAP::GFP (bottom row) transgenic mice were pulse-labeled for 30 min with EdU followed by fixation. Dorsolateral telencephalon was (immuno)stained for GFP (to identify individual aRG (bottom) and BPs (top), green), GRASP-65 (to reveal the position of the Golgi units), γ-tubulin (to identify centrosomes), and EdU (to identify progenitors in S-phase). Diagrams on the right show the localization of Golgi units (blue), with the one nearest to the centrosome (C) indicated (GA), in the respective S-phase cells, as reconstructed from the series of optical sections. Images are stacks of 3 (top) and 2 (bottom) 0.9-μm optical sections. Scale bars, 10 μm. (D) Distance between the position of the centrosome (set to zero, red circles) and the nearest Golgi unit (blue squares) in S-phase aRG and BPs, labelled, (immuno)stained and analyzed as in (C). Data are the mean of 38 aRG and 20 BPs; error bars indicate SEM.
Figure 9
Figure 9. Golgi apparatus in mitotic neural progenitor.
Subcellular localization of the Golgi apparatus, as revealed by GRASP-65 immunofluorescence, in mitotic APs (A) and BPs (B) of E14.5 wt mouse dorsolateral telencephalon. Cell contours (yellow dashed lines) were deduced from phalloidin staining (not shown). The mitotic phase was determined based on the state of DNA condensation and organization (DAPI staining), and the mitotic spindle is revealed by immunofluorescence for α-tubulin. Blue and orange boxes: high magnification of areas highlighted in the Merge, showing the proximity of Golgi units to the mitotic spindle (white arrows) or their localization near the cell periphery (yellow arrows). Scale bar, low magnification 5 μm, high magnification 0.5 μm.
Figure 10
Figure 10. The ER is present in both apical and basal process of aRGs.
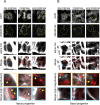
(A) Subcellular localization of the ER, revealed by immunofluorescence for KDEL-containing ER-resident proteins (red), in aRGs in dorsolateral telencephalon of an E14.5 GFAP::GFP transgenic mouse embryo, identified by GFP immunofluorescence (green). Images are either stacks of six 0.6-μm single optical sections, or one single optical section, as indicated. Diagram on the right shows the localization of endoplasmic reticulum (arrows) in the two single aRGs the nuclei of which are indicated by asterisks in the left panel, as reconstructed from the series of optical sections. Note that the ER staining is more diffuse in the stack than in the single optical section, and appears non-continuous. The latter may reflect local inhomogeneities, within the ER, of KDEL-containing proteins that are related to the specific aRG cell architecture in tissue (see also the pattern of Sec61 and Sec16 immunofluorescence, Figure S5). Scale bar, 20 μm. (B) Cartoon of an aRG illustrating the regions of the apical and basal process subjected to immunofluorescence analysis in (C). Blue boxes, apical process in the VZ apical and basal to the nucleus; orange box, basal process in the CP. (C) High magnification of portions of the basal process (top row), the apical process above the nucleus (middle row) and the apical process below the nucleus (bottom row) of a single aRG in dorsolateral telencephalon of an E14.5 GFAP::GFP transgenic mouse embryo, identified by GFP immunofluorescence (green), showing the presence of ER (arrowheads) as revealed by immunofluorescence for KDEL-containing ER-resident proteins (red). Dashed lines indicate the apical or basal process of the aRG analyzed. Images are single 0.6-μm optical sections. Scale bars, 2 μm.
Figure 11
Figure 11. The plasma membrane of the aRG basal process lacks Golgi-modified glycans.
E14.5-16.5 wt mouse cerebral hemispheres were labeled with DiI applied to the ventricular surface, fixed and cell surface-stained with ConA-A488 or WGA-A488 (DG). (A) Cartoon illustrating DiI labeling. (B) Cartoon of a DiI-labeled aRG illustrating the region of the apical and basal process subjected to lectin staining and quantification in (DG). Blue box, apical process in VZ apical to nucleus; orange box, basal process in CP. (C) DiI fluorescence showing single labeled aRGs including their apical process (blue boxes) and basal process (orange boxes). Arrows with asterisk, nucleus of the two indicated aRGs. The image is a stack of 20 0.6-μm single optical sections. Scale bar, 20 μm. (D,E) ConA (green, (D) top row, (E) top row) and WGA (green, (D) bottom row, (E) bottom row) fluorescence of a DiI-labeled basal (D) and apical (E) process (magenta). Images are 0.6-μm single optical sections. Solid white lines: orientation of the scans to measure fluorescence intensity, as shown in the line plots on right: magenta lines, DiI fluorescence; green lines, ConA or WGA fluorescence; A.U., arbitrary units. The scanned DiI-labeled basal process (D) is indicated by a dotted white line positioned immediately adjacent to the process. Magenta rectangular areas in line plots indicate the width of the process in the scan; in the case of the apical process (E) the plasma membrane on either side of the process can be distinguished. Note the presence of both, ConA-positive and WGA-positive constituents in the plasma membrane of the apical process (E), and the presence of ConA-positive, but the lack of WGA-positive, constituents in the plasma membrane of the basal process (D). Scale bars, 5 μm. (F,G) 84 and 41 basal (F) and 43 and 107 apical (G) processes were analyzed as in (D,E), respectively, for the occurrence of ConA or WGA cell surface staining. The colocalization of a peak of lectin staining with the peak of DiI labeling in line plots was scored as positive lectin staining. The percentage of lectin + processes is shown.
Figure 12
Figure 12. Cartoon illustrating the distinct aRG plasma membrane domains and the canonical vs. unconventional biosynthetic membrane traffic routes to these domains.
Membrane constituents of the apical plasma membrane domain (magenta) and the apical lateral plasma membrane domain (blue) are largely delivered via the canonical traffic route (purple), transiting through the Golgi apparatus; PM, plasma membrane. In contrast, membrane constituents of the basal lateral plasma membrane domain (orange) and the basal plasma membrane domain (dark brown) are proposed to be largely delivered via the unconventional traffic route (light brown), bypassing the Golgi apparatus. IZ, intermediate zone. It should be noted that the presence of ConA-stained membrane constituents in the apical and the apical lateral plasma membrane domains (see Fig. 11E and Supplementary Figure S7A) may reflect either traffic via a Golgi-independent route or lack of processing of high-mannose N-linked glycans during their passage through the Golgi apparatus.

Similar articles

Cited by

References

    1. Götz M. & Huttner W. B. The cell biology of neurogenesis. Nat. Rev. Mol. Cell Biol. 6, 777–788 (2005). - PubMed
    1. Taverna E., Götz M. & Huttner W. B. The cell biology of neurogenesis: toward an understanding of the development and evolution of the neocortex. Annu. Rev. Cell Dev. Biol. 30, 465–502 (2014). - PubMed
    1. Paridaen J. T. & Huttner W. B. Neurogenesis during development of the vertebrate central nervous system. EMBO reports 15, 351–64 (2014). - PMC - PubMed
    1. Taverna E. & Huttner W. B. Neural progenitor nuclei IN Motion. Neuron 67, 906–914 (2010). - PubMed
    1. Lee H. O. & Norden C. Mechanisms controlling arrangements and movements of nuclei in pseudostratified epithelia. Trends Cell Biol 23, 141–50 (2013). - PubMed

Publication types

Substances