. 2016 Mar;147(3):321-37.
doi: 10.1111/imm.12564. Epub 2016 Feb 8.

Heme oxygenase-1 inhibits basophil maturation and activation but promotes its apoptosis in T helper type 2-mediated allergic airway inflammation

Affiliations

Heme oxygenase-1 inhibits basophil maturation and activation but promotes its apoptosis in T helper type 2-mediated allergic airway inflammation

Wenwei Zhong et al. Immunology. 2016 Mar.

Abstract

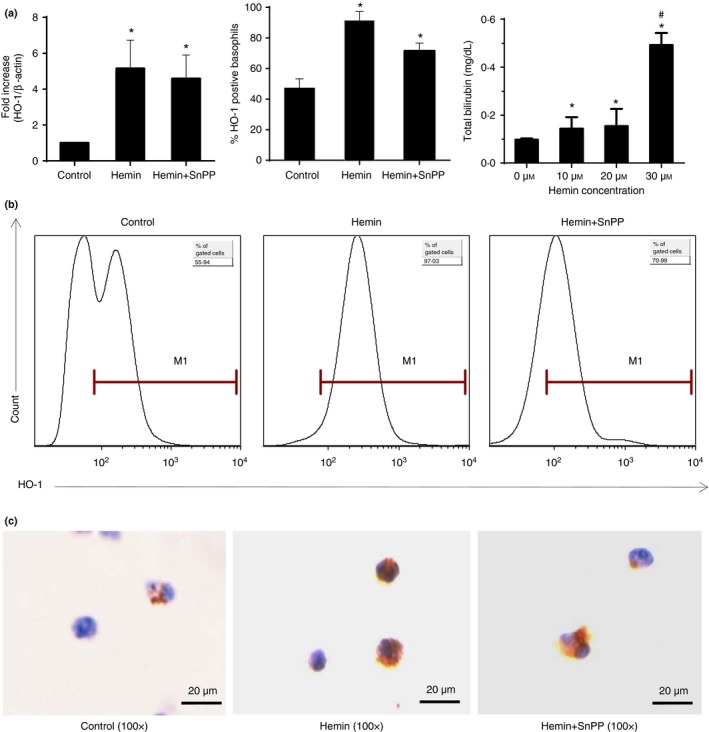
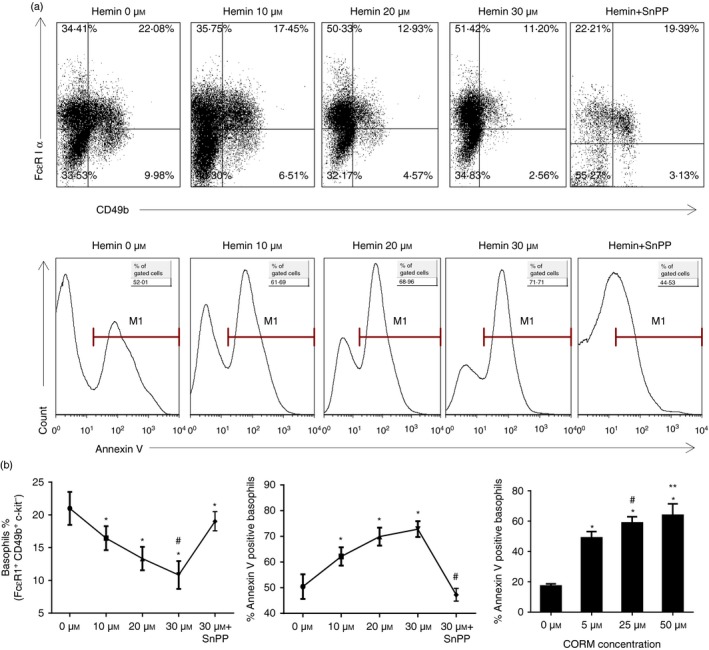
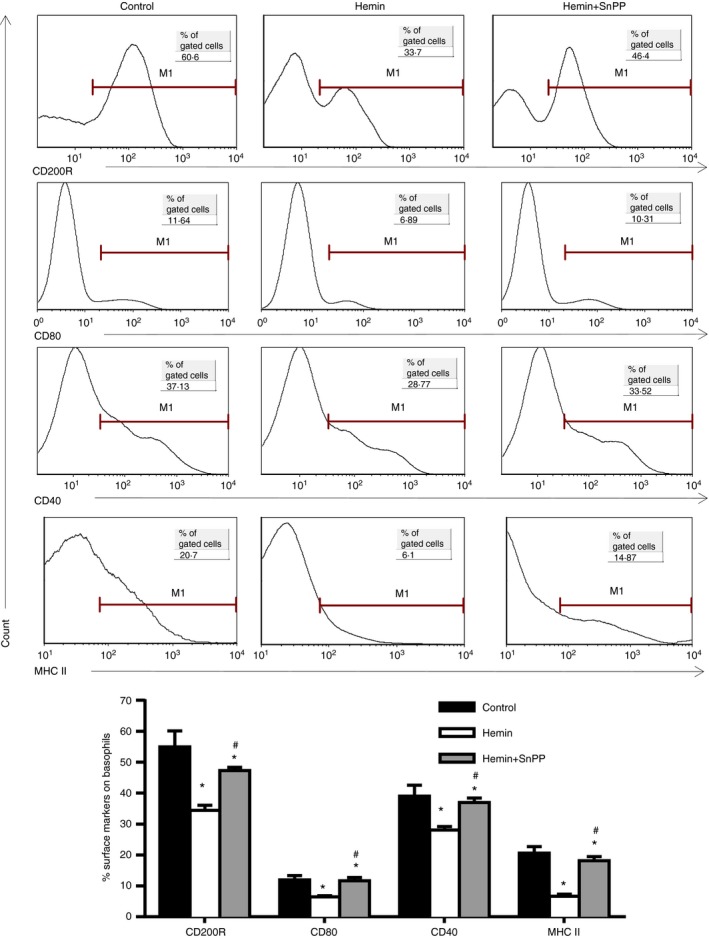
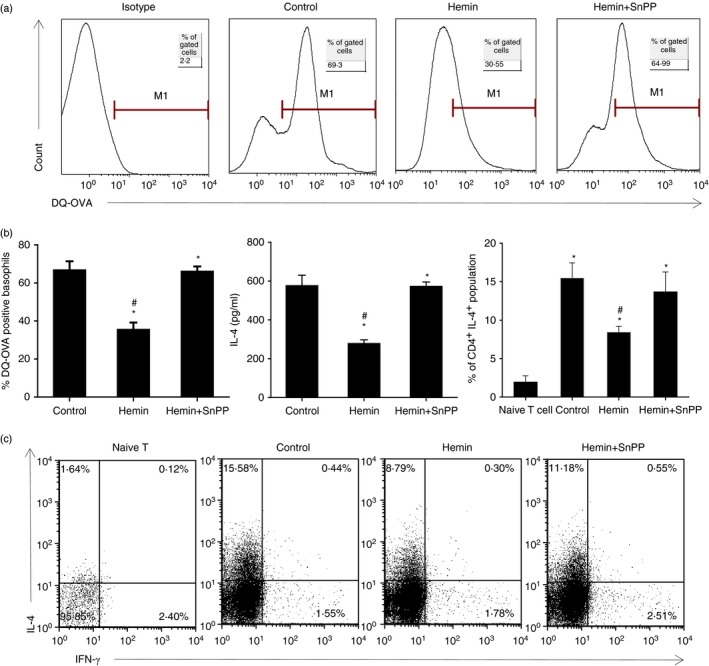
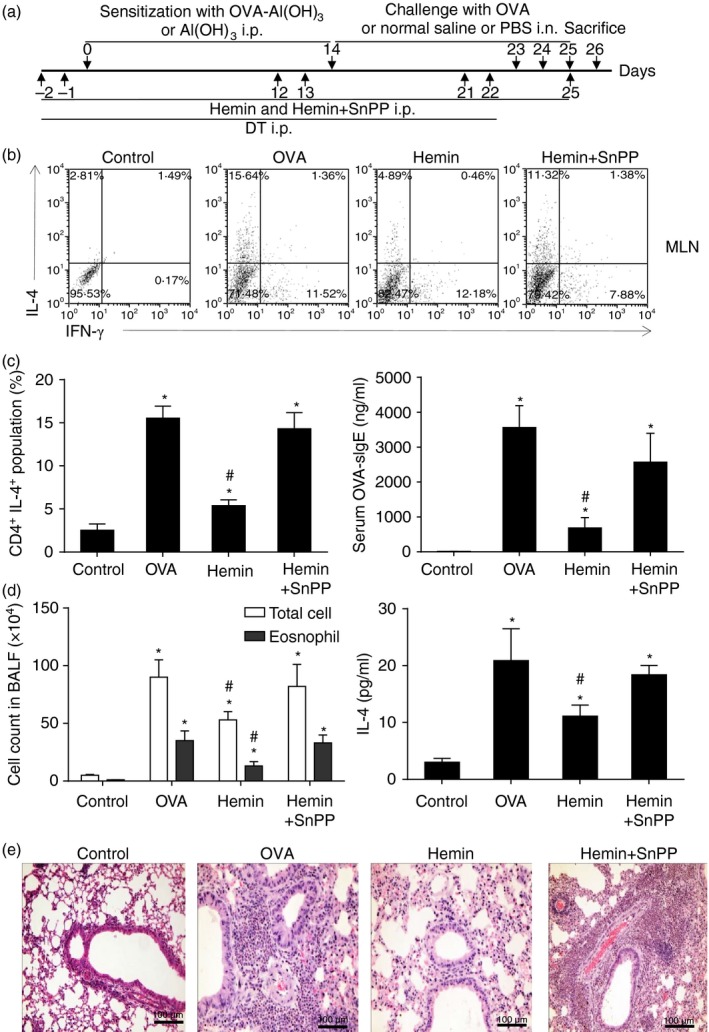
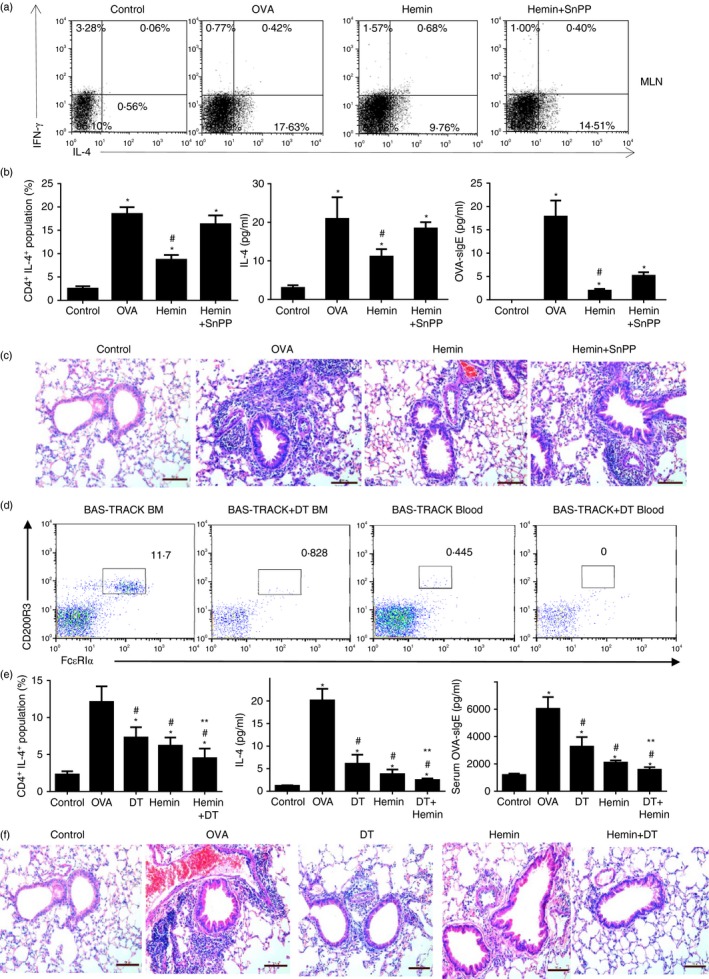
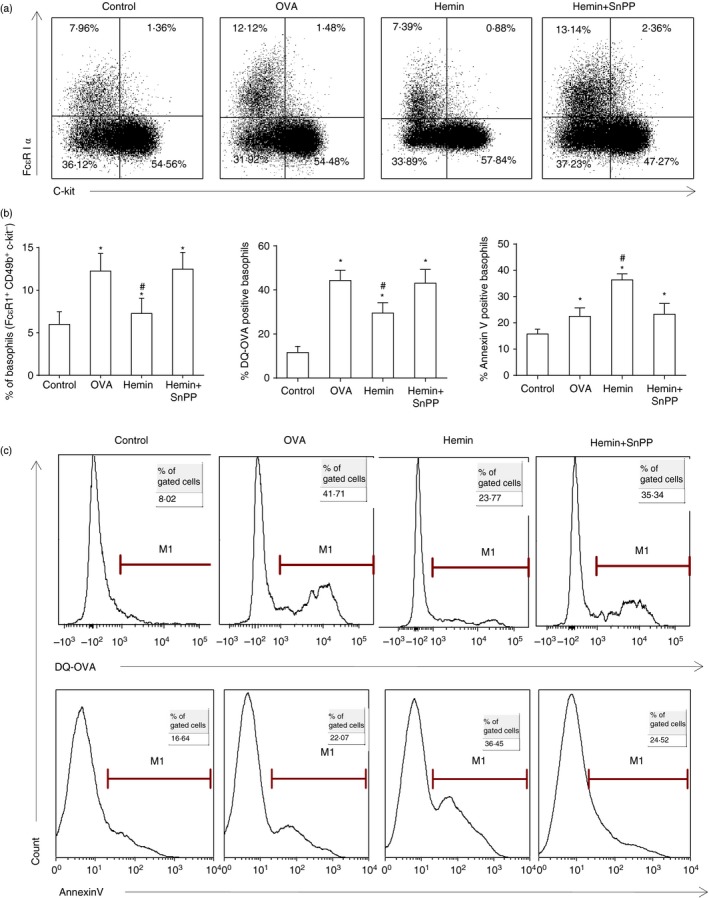
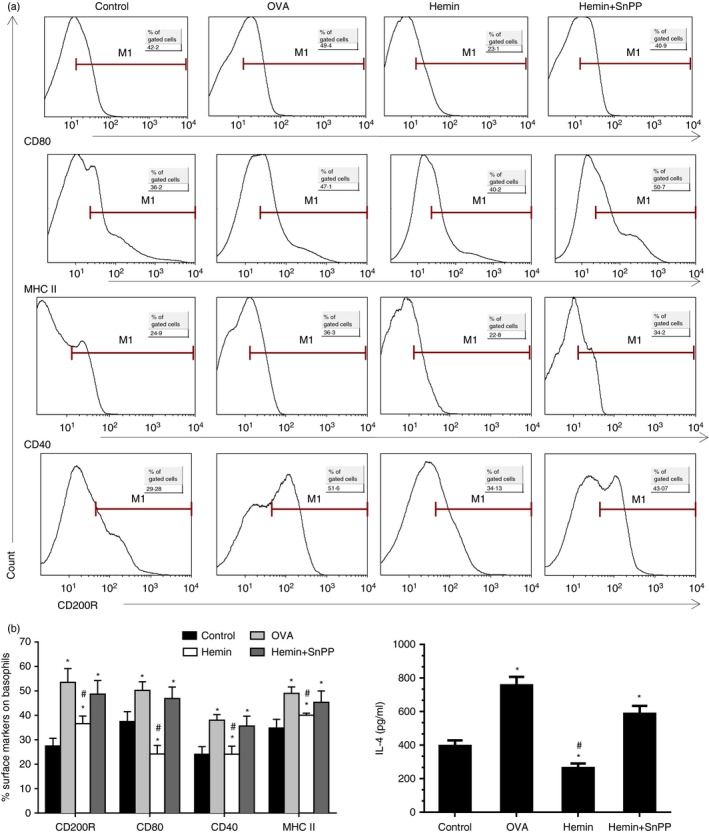
The anti-inflammatory role of heme oxygenase-1 (HO-1) has been studied extensively in many disease models including asthma. Many cell types are anti-inflammatory targets of HO-1, such as dendritic cells and regulatory T cells. In contrast to previous reports that HO-1 had limited effects on basophils, which participate in T helper type 2 immune responses and antigen-induced allergic airway inflammation, we demonstrated in this study, for the first time, that the up-regulation of HO-1 significantly suppressed the maturation of mouse basophils, decreased the expression of CD40, CD80, MHC-II and activation marker CD200R on basophils, blocked DQ-ovalbumin uptake and promoted basophil apoptosis both in vitro and in vivo, leading to the inhibition of T helper type 2 polarization. These effects of HO-1 were mimicked by exogenous carbon monoxide, which is one of the catalytic products of HO-1. Furthermore, adoptive transfer of HO-1-modified basophils reduced ovalbumin-induced allergic airway inflammation. The above effects of HO-1 can be reversed by the HO-1 inhibitor Sn-protoporphyrin IX. Moreover, conditional depletion of basophils accompanying hemin treatment further attenuated airway inflammation compared with the hemin group, indicating that the protective role of HO-1 may involve multiple immune cells. Collectively, our findings demonstrated that HO-1 exerted its anti-inflammatory function through suppression of basophil maturation and activation, but promotion of basophil apoptosis, providing a possible novel therapeutic target in allergic asthma.

Keywords: T helper type 2 response; allergic airway inflammation; basophil; heme oxygenase-1.


Figures

Figure 1
Figure 1
Hemin interference induced expression of HO‐1 in basophils and increased bilirubin production. Cultured and FACS‐purified bone‐marrow‐derived basophils BMBs from BALB/c mice were further treated with 30 μmol/l of hemin or hemin plus SnPP for 48 hr in the presence of 10 ng/ml interleukin‐3 (IL‐3). Cells without hemin and SnPP treatment were control groups. The concentration of bilirubin was determined after 48 hr of culture. RTPCR, flow cytometry and immunocytochemistry were performed for detecting HO‐1 expression in basophils. (a) Left, HO‐1 expression from purified basophils by RTPCR, the level of HO‐1 mRNA was normalized to β‐actin. Data are presented as fold change in hemin and hemin plus SnPP groups compared with the control group (*< 0·05, versus control group); Middle, the percentage of HO‐1 positive basophils (*< 0·05, versus control group); Right, the concentration of bilirubin in medium (*< 0·05, versus 0 μmol/l group, #< 0·01 30 μmol/l group versus 10 μmol/l group and 20 μmol/l group). (b) Intracellular staining for HO‐1 in cultured BMBs (gated on Fcε RI α + CD49b+ c‐kit subset). (c) Immunocytochemistry staining for HO‐1 in purified basophils, scale bar, 20 μm (DAB stain, 100×). Data are representative of three independent experiments.
Figure 2
Figure 2
HO‐1 and exogenous CO inhibited basophil maturation and promoted their apoptosis in vitro. Bone marrow cells from normal BALB/c mice were cultured for 10 days with IL‐3. Different doses of hemin (0, 10, 20 and 30 μmol/l) or CORM (0, 5, 25, 50 μmol/l) were added. In the hemin plus SnPP group, 30 μmol/l hemin and 30 μmol/l SnPP were used respectively. Flow cytometry analysis was performed to detect the percentage and apoptosis of basophils. (a) Flow cytometeric analysis of the percentage of basophils in culture under different concentrations of hemin and hemin plus SnPP (gated on c‐kit basophil‐enriched population; upper panel); Annexin V expression in basophils under different concentrations of hemin and hemin plus SnPP (gate on Fcε RI α + CD49b+ PI subset; low panel). (b) Left, the percentage of basophils (gated on Fcε RI α + CD49b+ c‐kit subset (*< 0·05, versus 0 μmol/l group; #< 0·05, versus hemin+SnPP group, respectively); Middle, the percentage of Annexin V expression in basophils (gate on Fcε RI α + CD49b+ PI subset; *< 0·05, versus 0 μmol/l group; #< 0·05, versus 10, 20 and 30 μmol/l group, respectively); Right, the percentage of Annexin V expression in basophils (gate on Fcε RI α + CD49b+ PI subset; (*< 0·05, versus 0 μmol/l group, respectively; #< 0·05, 25 μmol/l group versus 5 μmol/l group; **< 0·05, 25 μmol/l group versus 50 μmol/l group). Data are representative of three independent experiments.
Figure 3
Figure 3
HO‐1 inhibited the expression of CD200R and co‐stimulatory molecules on basophils in vitro. Bone marrow cells from normal BALB/c mice were cultured for 10 days in complete RPMI‐1640 medium with the addition of IL‐3. Hemin and hemin+ SnPP were added at concentrations of 30 μmol/l, respectively. Expression of CD200R, CD40, CD80 and MHC II on basophils was determined by flow cytometry (gated on Fcε RI α + CD49b+ c‐kit subset; *< 0·05, versus control group; #< 0·05, hemin+SnPP group versus hemin group, respectively). Data are representative of three independent experiments.
Figure 4
Figure 4
HO‐1 inhibited OVA uptake, IL‐4 releasing and basophil‐induced Th2 polarization in vitro. (a) Purified BMBs were further treated with or without hemin and hemin plus SnPP at the concentration of 30 μmol/l for 48 hr, respectively, then cultured for a further 4 hr with DQOVA. DQOVA taken up by basophils was examined using flow cytometry (gated on Fcε RI α + CD49b+ c‐kit subset). (b) Left, the percentage of DNPOVA‐positive basophils (*< 0·05, versus control group); Middle, IL‐4 level of sort‐purified BMBs treated with hemin or hemin plus SnPP and stimulated with anti‐DNP‐IgE in the presence of IL‐3 for 16 hr (*< 0·05, versus control group); Right, the percentage of CD4+ IL‐4+ population (*< 0·05, versus naive T‐cell group; #< 0·05, versus control group without hemin or SnPP treatment). (c) Purified BMBs from BALB/c mice were treated with hemin or hemin plus SnPP and further co‐cultured with MACS‐screened splenic naive T cells (DO11.10) in the presence of DNPOVA, anti‐DNP IgE, IL‐3 and IL‐2 for 5 days. Intracellular staining of IL‐4 and interferon‐γ were performed and the Th2 subset (CD4+ IL‐4+) was determined by flow cytometry. Data are representative of three independent experiments.
Figure 5
Figure 5
Up‐regulation of HO‐1 attenuated Th2 immune responses and OVA ‐induced allergic airway inflammation. (a) The schematic diagram of OVA‐induced asthmatic mouse model and hemin or SnPP administration. (b) Isolated cells from mediastinal lymph nodes (MLNs) were cultured with 500 μg/ml OVA for 5 days followed by intracellular staining of IL‐4 and interferon‐γ (IFNγ). Th1/Th2 subsets were assessed by flow cytometry (gated on CD4+ cells). (c) Left, the percentage of CD4+ IL‐4+ population from MLNs (*< 0·05, versus control group; #< 0·05, versus OVA group); Right, serum OVAsIgE level was quantified by ELISA (*< 0·05, versus control group; #, < 0·05, versus OVA group). (d) Left, total cell numbers count and eosinophil numbers count in bronchoalveolar lavage fluid (*< 0·05, versus control group; #< 0·05, versus OVA group); Right, IL‐4 level in lung tissue were quantified by ELISA (*< 0·05, versus control group; #< 0·05, versus OVA group). (e) Pathological change of lung tissue, scale bar, 100 μm (haematoxylin & eosin stain, 40×). Data are representative of three independent experiments.
Figure 6
Figure 6
HO‐1 reduced allergic airway inflammation invoked by adoptive transfer of basophils and conditional depletion of basophils did not reverse the protective role of HO‐1. FACS purified FcεR1+ CD49b+ c‐kit CD11c basophils of bone marrow derived from normal BALB/c mice were treated with 30 μmol/l hemin, SnPP or hemin plus SnPP for 48 hr and were further treated with 500 μg/ml OVA, 100 μg/ml DNPOVA and 10 μg/ml anti‐DNP IgE for 4 hr to active basophils. A total of 2·5 × 105 basophils were delivered to naive BALB/c mice using intraperitoneal. injection at day 0 and day 14 followed by three intranasal challenges with OVA. (a) Flow cytometry assessed Th1/Th2 subsets in MLNs; gated on CD4+ cells). (b) Left, the percentage of CD4+ IL‐4+ population from MLNs (*< 0·05, versus control group; #< 0·05, versus OVA group); Middle, IL‐4 level in lung tissue detected by ELISA (*< 0·05, versus control group; #< 0·05, versus OVA group); Right, serum OVAsIgE level was detected by ELISA (*< 0·05, versus control group; #< 0·05, versus the OVA group). (c) Pathological change in lung tissue (haematoxylin & eosin stain, 40×). Diphtheria toxin (DT) ‐mediated conditional basophil‐specific depletion was performed before OVA sensitization and challenge or hemin administration. (d) DT treatment significantly decreased the percentage of basophils both in bone marrow and peripheral blood in Bas‐TRACK mice after two injections of DT (gated on CD49B+ c‐KIT cells). (e) Left, the percentage of CD4+ IL‐4+ population from MLNs assessed by flow cytometry (gated on CD4+ cells; *< 0·05, versus control group; #< 0·05, versus OVA group; **< 0·05, Hemin versus Hemin+DT group); Middle, IL‐4 level in lung tissue determined by ELISA (*< 0·05, versus control group; #< 0·05, versus OVA group; **< 0·05, Hemin versus Hemin+DT group); Right, serum OVAsIgE level was determined by ELISA (*< 0·05, versus control group; #< 0·05, versus OVA group; **< 0·05, Hemin versus Hemin+DT group). (f) Pathological change in lung tissue, scale bar, 100 μm (haematoxylin & eosin stain, 40×). Data are representative of three independent experiments.
Figure 7
Figure 7
Up‐regulation of HO‐1 decreased pulmonary basophil number, inhibited basophil DQ‐OVA uptake, but promoted its apoptosis. (a) Flow cytometry analysis was performed to determine basophil amount (gate on CD49b+ basophil‐enriched population). (b) Left, the percentage of basophils (gate on CD49b+ subset; *< 0·05, versus control group; #< 0·05, versus OVA group); Middle, the percentage of DQOVA positive basophils (gate on Fcε RI α + CD49b+ c‐kit subset; *< 0·05, versus control group; # < 0·05, versus OVA group); Right, the percentage of Annexin V positive basophils (gate on Fcε RI α + CD49b+ PI + subset; *< 0·05, versus control group; #< 0·05, versus OVA group). (c) DQOVA uptake (gate on Fcε RI α + CD49b+ c‐kit subset) and Annexin V expression of pulmonary basophils using flow cytometry (gate on Fcε RI α + CD49b+ PI + subset). Data are representative of three independent experiments.
Figure 8
Figure 8
Up‐regulation of HO‐1 decreased co‐stimulators and activation marker CD200R expression on pulmonary basophils and inhibited IL‐4 release. (a) Flow cytometry analysis was performed to determine CD40, CD80, MHC II and activation marker CD200R expression on pulmonary basophils (gate on Fcε RI α + CD49b+ c‐kit subset). (b) Left, the percentage of CD40, CD80, MHC II and CD200R positive basophils [*< 0·05, versus control group; #< 0·05, versus OVA group]; Right, IL‐4 level released from flow cytometry sorted pulmonary basophils upon DNPOVA/anti‐DNP‐IgE stimulation (*< 0·05, versus control group; #< 0·05, versus OVA group). Data are representative of three independent experiments.

Similar articles

Cited by

References

    1. Dunn LL, Midwinter RG, Ni J, Hamid HA, Parish CR, Stocker R. New insights into intracellular locations and functions of heme oxygenase‐1. Antioxid Redox Signal 2014; 20:1723–42. - PMC - PubMed
    1. Naito Y, Takagi T, Higashimura Y. Heme oxygenase‐1 and anti‐inflammatory M2 macrophages. Arch Biochem Biophys 2014; 564C:83–8. - PubMed
    1. Gayathri G, Muthukumar S, Joseph LD, Suresh R. Immunolocalization of heme oxygenase‐1 in periodontal diseases. Indian J Dent Res 2014; 25:567–71. - PubMed
    1. Zhang Y, Zhang L, Wu J, Di C, Xia Z. Heme oxygenase‐1 exerts a protective role in ovalbumin‐induced neutrophilic airway inflammation by inhibiting Th17 cell‐mediated immune response. J Biol Chem 2013; 288:34612–26. - PMC - PubMed
    1. Xia ZW, Zhong WW, Meyrowitz JS, Zhang ZL. The role of heme oxygenase‐1 in T cell‐mediated immunity: the all encompassing enzyme. Curr Pharm Des 2008; 14:454–64. - PubMed

Publication types