Immune/Inflammatory Response and Hypocontractility of Rabbit Colonic Smooth Muscle After TNBS-Induced Colitis
- PMID: 26879904
- PMCID: PMC4920730
- DOI: 10.1007/s10620-016-4078-5
Immune/Inflammatory Response and Hypocontractility of Rabbit Colonic Smooth Muscle After TNBS-Induced Colitis
Abstract
Background: The contractility of colonic smooth muscle is dysregulated due to immune/inflammatory responses in inflammatory bowel diseases. Inflammation in vitro induces up-regulation of regulator of G-protein signaling 4 (RGS4) expression in colonic smooth muscle cells.
Aims: To characterize the immune/inflammatory responses and RGS4 expression pattern in colonic smooth muscle after induction of colitis.
Methods: Colitis was induced in rabbits by intrarectal instillation of 2,4,6-trinitrobenzene sulfonic acid (TNBS). Innate/adaptive immune response RT-qPCR array was performed using colonic circular muscle strips. At 1-9 weeks after colonic intramuscular microinjection of lentivirus, the distal and proximal colons were collected, and muscle strips and dispersed muscle cells were prepared from circular muscle layer. Expression levels of RGS4 and NFκB signaling components were determined by Western blot analysis. The biological consequences of RGS4 knockdown were assessed by measurement of muscle contraction and phospholipase C (PLC)-β activity in response to acetylcholine (ACh).
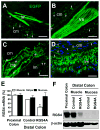
Results: Contraction in response to ACh was significantly inhibited in the inflamed colonic circular smooth muscle cells. RGS4, IL-1, IL-6, IL-8, CCL3, CD1D, and ITGB2 were significantly up-regulated, while IL-18, CXCR4, CD86, and C3 were significantly down-regulated in the inflamed muscle strips. RGS4 protein expression in the inflamed smooth muscles was dramatically increased. RGS4 stable knockdown in vivo augmented ACh-stimulated PLC-β activity and contraction in colonic smooth muscle cells.
Conclusion: Inflamed smooth muscle exhibits up-regulation of IL-1-related signaling components, Th1 cytokines and RGS4, and inhibition of contraction. Stable knockdown of endogenous RGS4 in colonic smooth muscle increases PLC-β activity and contractile responses.
Keywords: Colitis; Rabbit; Regulators of G-protein signaling; Smooth muscle cells; shRNA.
Figures


Similar articles
-
Upregulation of RGS4 and downregulation of CPI-17 mediate inhibition of colonic muscle contraction by interleukin-1beta.Am J Physiol Cell Physiol. 2007 Dec;293(6):C1991-2000. doi: 10.1152/ajpcell.00300.2007. Epub 2007 Oct 24. Am J Physiol Cell Physiol. 2007. PMID: 17959727 Free PMC article.
-
Concurrent infection with Schistosoma mansoni attenuates inflammation induced changes in colonic morphology, cytokine levels, and smooth muscle contractility of trinitrobenzene sulphonic acid induced colitis in rats.Gut. 2004 Jan;53(1):99-107. doi: 10.1136/gut.53.1.99. Gut. 2004. PMID: 14684583 Free PMC article.
-
Interleukin-1beta up-regulates RGS4 through the canonical IKK2/IkappaBalpha/NF-kappaB pathway in rabbit colonic smooth muscle.Biochem J. 2008 May 15;412(1):35-43. doi: 10.1042/BJ20080042. Biochem J. 2008. PMID: 18260825 Free PMC article.
-
The effect of sphingosine-1-phosphate on colonic smooth muscle contractility: Modulation by TNBS-induced colitis.PLoS One. 2017 May 11;12(5):e0170792. doi: 10.1371/journal.pone.0170792. eCollection 2017. PLoS One. 2017. PMID: 28493876 Free PMC article.
-
Role of nitric oxide in the impairment of circular muscle contractility of distended, uninflamed mid-colon in TNBS-induced acute distal colitis in rats.World J Gastroenterol. 2005 Sep 28;11(36):5677-84. doi: 10.3748/wjg.v11.i36.5677. World J Gastroenterol. 2005. PMID: 16237764 Free PMC article.
Cited by
-
The Role of Inflammatory Mediators in the Development of Gastrointestinal Motility Disorders.Int J Mol Sci. 2022 Jun 22;23(13):6917. doi: 10.3390/ijms23136917. Int J Mol Sci. 2022. PMID: 35805922 Free PMC article. Review.
-
Regulator of G protein signaling 4 is a novel target of GATA-6 transcription factor.Biochem Biophys Res Commun. 2017 Feb 12;483(3):923-929. doi: 10.1016/j.bbrc.2016.10.024. Epub 2016 Oct 13. Biochem Biophys Res Commun. 2017. PMID: 27746176 Free PMC article.
-
Targeting Inflammation and Oxidative Stress to Improve Outcomes in a TNBS Murine Crohn's Colitis Model.Nanomaterials (Basel). 2024 May 20;14(10):894. doi: 10.3390/nano14100894. Nanomaterials (Basel). 2024. PMID: 38786849 Free PMC article.
-
Contractile function of the cervix plays a role in normal and pathological pregnancy and parturition.Med Hypotheses. 2020 Dec;145:110336. doi: 10.1016/j.mehy.2020.110336. Epub 2020 Oct 7. Med Hypotheses. 2020. PMID: 33049595 Free PMC article.
-
Evaluation of animal models of Crohn's disease with anal fistula (Review).Exp Ther Med. 2021 Sep;22(3):974. doi: 10.3892/etm.2021.10406. Epub 2021 Jul 8. Exp Ther Med. 2021. PMID: 34335916 Free PMC article. Review.
References
-
- Salinthone S, Singer CA, Gerthoffer WT. Inflammatory gene expression by human colonic smooth muscle cells. Am J Physiol Gastrointest Liver Physiol. 2004;287:G627–G637. - PubMed
-
- Singer CA, Salinthone S, Baker KJ, Gerthoffer WT. Synthesis of immune modulators by smooth muscles. BioEssays. 2004;26:646–655. - PubMed
Publication types
MeSH terms
Substances
Grants and funding
LinkOut - more resources
Full Text Sources
Other Literature Sources
Miscellaneous

