. 2016 Feb 16:6:21174.
doi: 10.1038/srep21174.

Three-dimensional Organotypic Culture Models of Human Hepatocellular Carcinoma

Affiliations

Three-dimensional Organotypic Culture Models of Human Hepatocellular Carcinoma

Atsushi Takai et al. Sci Rep. .

Abstract

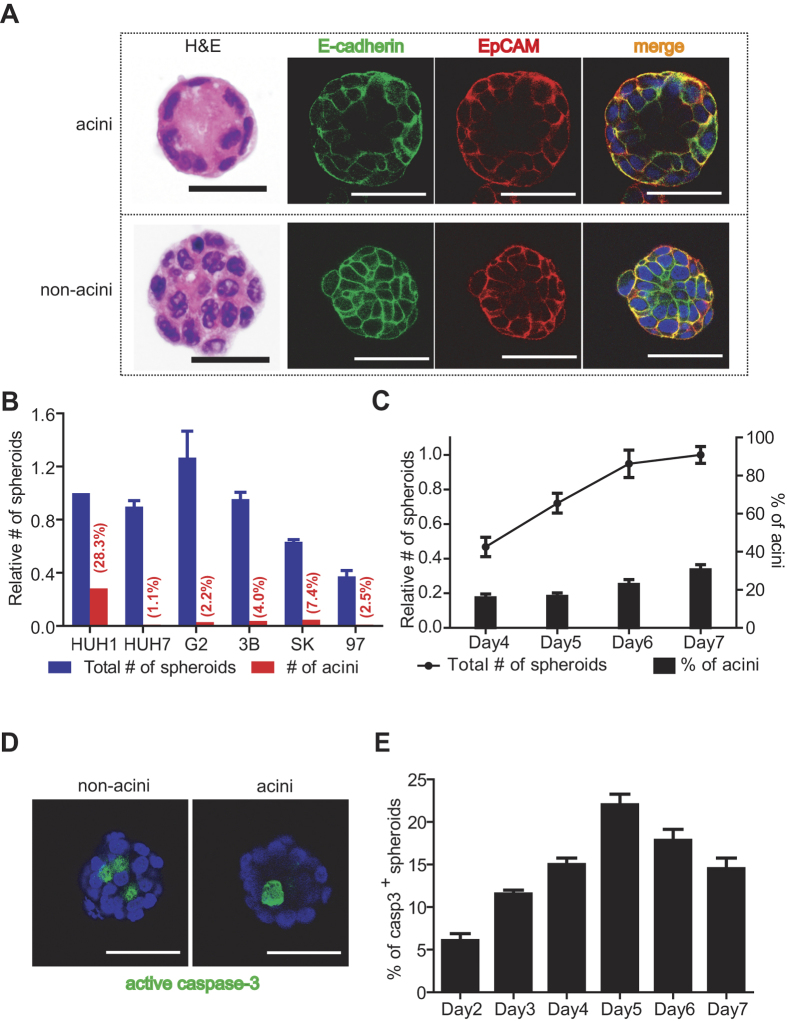
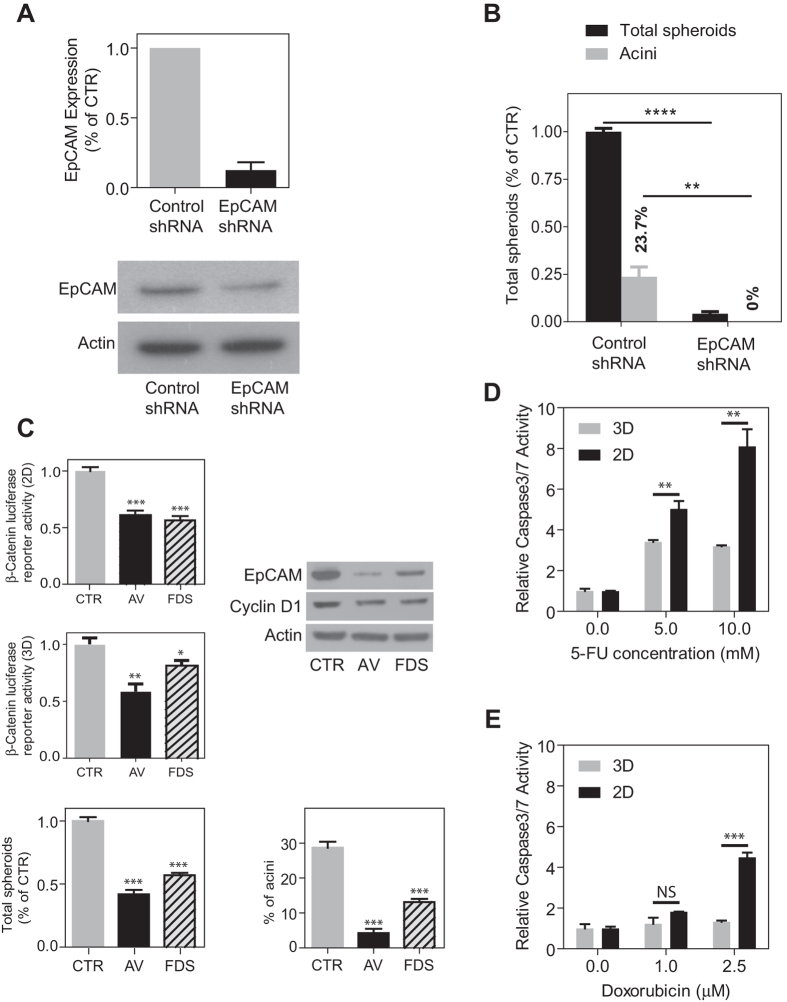
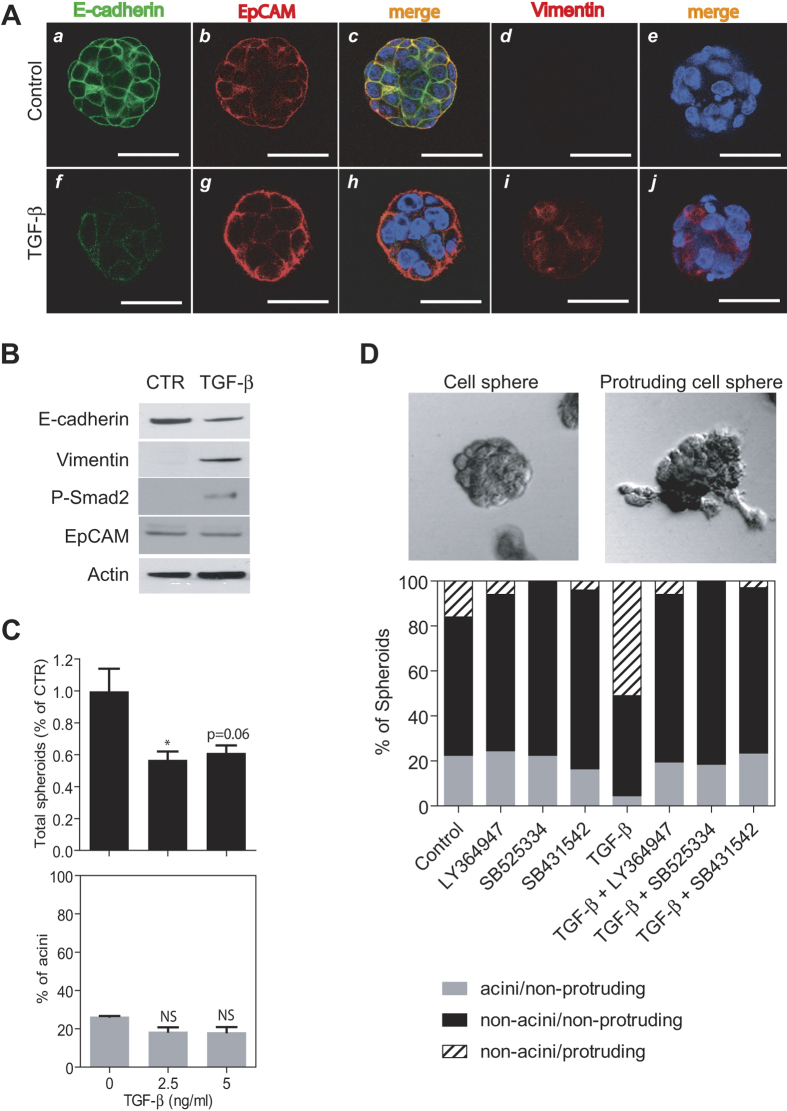
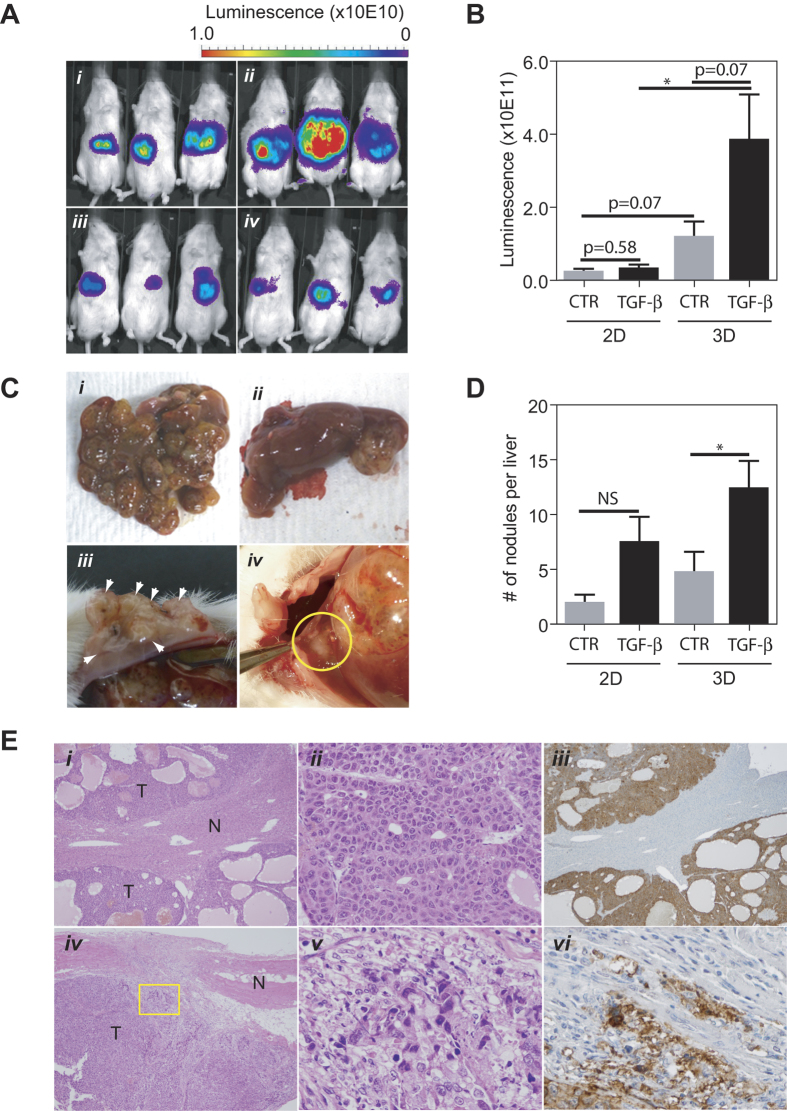
Three-dimensional cell culture methods are viable in vitro approaches that facilitate the examination of biological features cancer cells present in vivo. In this study, we demonstrate that hepatocellular carcinoma (HCC) cells in porous alginate scaffolds can generate organoid-like spheroids that mimic numerous features of glandular epithelium in vivo, such as acinar morphogenesis and apical expression patterns of EpCAM, a hepatic stem/progenitor cell marker highly expressed in a subset of HCC with stemness features. We show that the activation of Wnt/β-catenin signaling, an essential pathway for maintaining HCC stemness, is required for EpCAM(+) HCC spheroid formation as well as the maintenance of the acinous structure. Furthermore, we demonstrate that EpCAM(+) HCC cells cultured as spheroids are more sensitive to TGF/β-induced epithelial-mesenchymal transition with highly tumorigenic and metastatic potential in vivo compared to conventional two-dimensional (2D) culture. In addition, HCC cells in EpCAM(+) spheroids are more resistant to chemotherapeutic agents than 2D-cultured cells. The alginate scaffold-based organotypic culture system is a promising, reliable, and easy system that can be configured into a high throughput fashion for the identification of critical signaling pathways and screening of molecular drug targets specific for HCC.


Conflict of interest statement

The authors declare no competing financial interests.

Figures

Figure 1
Figure 1
(A) Representative images of Day 7 Huh1 acini (top) and non-acini (bottom). Shown are spheres stained with H&E, and immunostained for E-cadherin (green) and EpCAM (red). Scale bars are 50 μm. (B) Relative number of spheres at Day 7 in each cell line is shown. Blue bars and red bars indicate relative number of total spheres and acini, respectively, based on the total number of Huh1 spheres. The percentage value in parentheses shown above each red bar indicates the ratio of acini to total spheres. Total numbers of spheroids are presented as the average of five independent experiments, whereas numbers of acini are presented as the average of duplicate experiments. (C) Relative number of Huh1 spheres and the proportion of acini in noted culture periods are shown. The line plot indicates relative number of total spheres based on the sphere number at Day 7. Each bar indicates the proportion of acini in total spheres. Data are presented as the average of at least three independent analyses. (D) Representative images of spheres immunostained for active caspase-3 (green) are shown. (E) The proportion of active caspase-3 positive spheres in total spheres is shown. Data are presented as the average of at least three independent analyses. All error bars shown represent ±SEM.
Figure 2
Figure 2
(A) EpCAM expression level in Huh1 cells treated with control shRNA or EpCAM shRNA were determined by quantitative RT-PCR (top panel) and western blotting (bottom panel). RT-PCR data are presented as the average of four independent readings. (B) Relative number of Huh1 spheres treated with control shRNA or EpCAM shRNA is shown. Black bars and grey bars indicate relative number of total spheres and acini, respectively, based on the total number of control spheres. The percentage value shown above each grey bar indicates the ratio of acini to total spheres. Data are presented as the average of triplicate experiments. (C) β-catenin luciferase reporter activity in 2D cells (upper left panel) and 3D spheroids (middle left panel), EpCAM and Cyclin D1 expression level in 3D spheroids (upper right panel), total number of spheres (bottom left panel) and the proportion of acini (bottom right panel) treated with DMSO, AV-606 (AV, 3 μM) and fiduxosin (FDS, 10 μM) are shown. Data are presented as the average of at least three independent experiments. (D,E) Relative caspase 3/7 activity of 2D or 3D-cultured Huh1 cells treated with anti-cancer drugs (D, 5-FU; E, doxorubicin). Data are presented as the average of three independent analyses. All error bars shown represent ±SEM. **p < 0.01, ***p < 0.001.
Figure 3
Figure 3
(A) Representative images of Huh1 spheres at Day 7 with no treatment (top panels) and 2.5 ng/ml of TGF-β added at day 5 of spheroid culture (bottom panels). Shown are spheres immunostained for E-cadherin (a,f; green), EpCAM (b,g; red) and merged (c,h). Other representative spheres immunostained for vimentin (d,i; red) and merged (e,j) are also shown. Scale bars are 50 μm. (B) The expression level of E-cadherin, vimentin, phosphorylated Smad2 and EpCAM in Huh1 spheres treated with 5 ng/ml TGF-β at day 3 of spheroid culture. (C) Relative number (black bar) and the acini proportion (grey bar) of Huh1 spheres in the presence of TGF-β are shown. Data are presented as the average of three independent analyses. (D) Representative images of round-shape cell spheres (top, left) and protruding cell spheres (top, right) are shown. The proportion of each sphere type following treatment with 5 ng/ml TGF-β combined with several kinds of TGF-β receptor kinase inhibitors are shown as a bar graph (bottom). Data are presented as the average of duplicate experiments. All error bars represent ±SEM. *p < 0.05.
Figure 4
Figure 4
(A) Representative whole body luminofluorescence images of mice injected with (i) non-treated spheres, (ii) TGF-β treated spheres, (iii) non-treated cells and (iv) TGF-β treated cells 4 weeks after the surgery. (B) Quantification of the luciferase signal in each group is shown. (C) Macroscopic tumors developed in the orthotopic liver cancer mouse model. Representative images of mouse liver injected with (i) TGF-β treated spheres and (ii) non-treated cells are shown. The images of metastatic nodule detected in peritoneum (iii, arrow heads) and diaphragm (iv, in the circle) are also shown. (D) The average number of macroscopic nodules per liver in each group (right panel) is shown. (E) Microscopic images of tumors developed in a mouse injected with TGF-β treated spheres. Top panels (i–iii): liver tumors stained with H&E (i: 40× ii: 200× magnification) and immunostained for HLA-A (iii, 40× magnification). Bottom panels (iv–vi): peritoneal metastasis in the identical mouse stained with H&E (iv: 40× v: 400× magnification) and immunostained for HLA-A (vi, 400× magnification). N and T indicate non-tumor and tumor, respectively. All error bars represent ±SEM. *p < 0.05.

References

    1. Jemal A. et al. Global cancer statistics. CA Cancer J.Clin 61, 69–90 (2011). - PubMed
    1. Siegel R., Naishadham D. & Jemal A. Cancer statistics, 2013. CA Cancer J.Clin 63, 11–30 (2013). - PubMed
    1. Wang X. W. & Thorrgeirsson S. S. The Biological and clinical challenge of liver cancer heterogeneity. Hepatic Oncology 1, 5, 10.2217/HEP.14.18 (2014). - DOI - PMC - PubMed
    1. Weinstein I. B. Cancer. Addiction to oncogenes–the Achilles heal of cancer. Science (New York, NY) 297, 63–64 (2002). - PubMed
    1. Worns M. A. & Galle P. R. HCC therapies–lessons learned. Nat Rev Gastroenterol Hepatol 11, 447–452, 10.1038/nrgastro.2014.10 (2014). - DOI - PubMed

Publication types

MeSH terms

Substances