. 2016 Feb 15;212(4):439-47.
doi: 10.1083/jcb.201506118.

Biophysical changes reduce energetic demand in growth factor-deprived lymphocytes

Affiliations

Biophysical changes reduce energetic demand in growth factor-deprived lymphocytes

Vivian C Hecht et al. J Cell Biol. .

Abstract

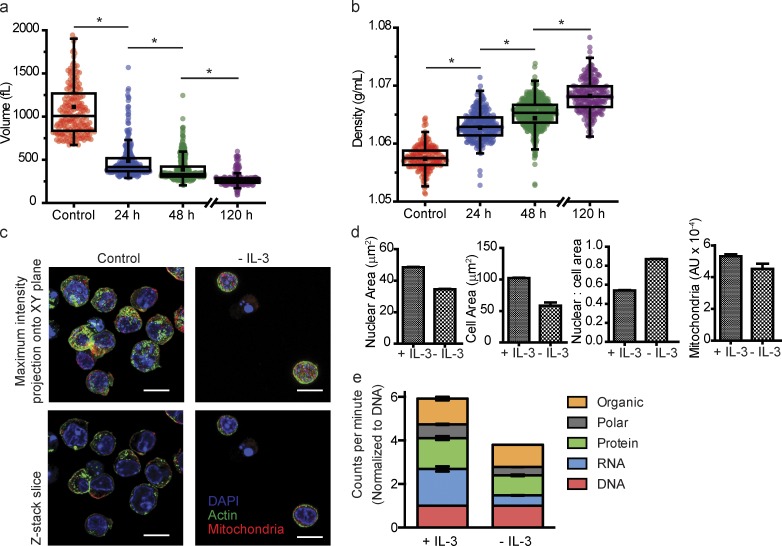
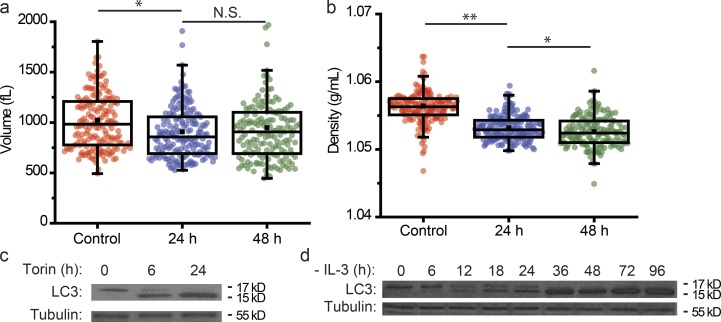
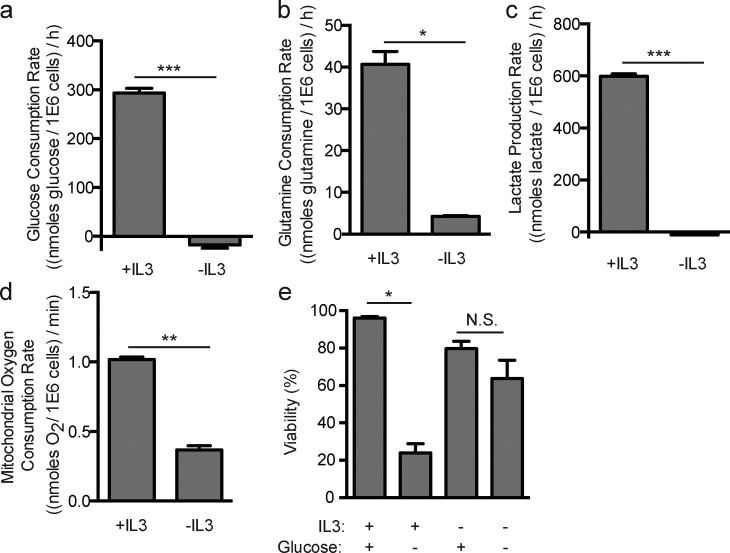
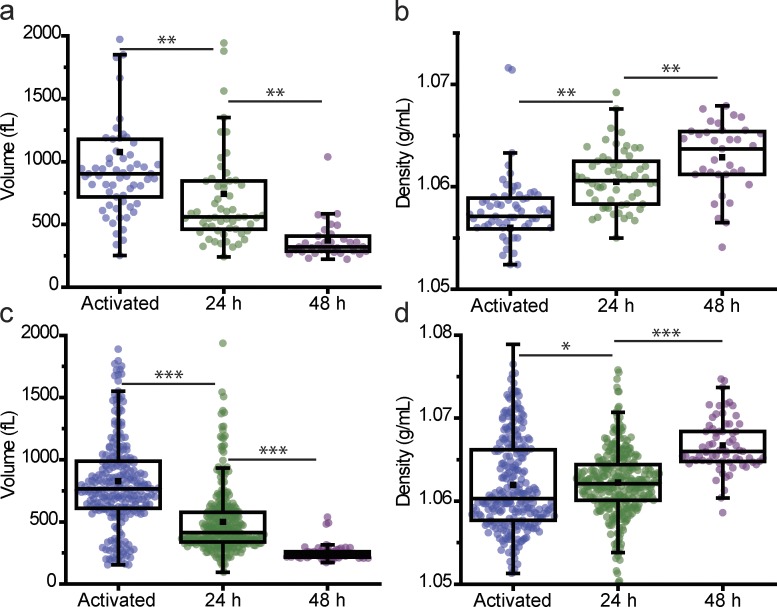
Cytokine regulation of lymphocyte growth and proliferation is essential for matching nutrient consumption with cell state. Here, we examine how cellular biophysical changes that occur immediately after growth factor depletion promote adaptation to reduced nutrient uptake. After growth factor withdrawal, nutrient uptake decreases, leading to apoptosis. Bcl-xL expression prevents cell death, with autophagy facilitating long-term cell survival. However, autophagy induction is slow relative to the reduction of nutrient uptake, suggesting that cells must engage additional adaptive mechanisms to respond initially to growth factor depletion. We describe an acute biophysical response to growth factor withdrawal, characterized by a simultaneous decrease in cell volume and increase in cell density, which occurs before autophagy initiation and is observed in both FL5.12 Bcl-xL cells depleted of IL-3 and primary CD8(+) T cells depleted of IL-2 that are differentiating toward memory cells. The response reduces cell surface area to minimize energy expenditure while conserving biomass, suggesting that the biophysical properties of cells can be regulated to promote survival under conditions of nutrient stress.


Figures

Figure 1.
Figure 1.
Graphical description of how cell volume and density can be obtained from buoyant mass measurements. A cell is first flowed into the SMR, and its buoyant mass is measured in low-density fluid (red). The cell is then trapped in the high-density fluid (blue), and then the direction of fluid flow is switched. The cell is then flowed through the SMR in the opposite direction where buoyant mass is measured in the high-density fluid. Volume and density are then calculated as shown in the plot on the left.
Figure 2.
Figure 2.
Biophysical changes resulting from IL-3 depletion in FL5.12 Bcl-xL cells. SMR measurements demonstrate a decrease in volume (a) and increase in density (b) over a 120-h interval. *, P < 2 × 10⁻²⁶. Representative images (c) and aggregate data (d) from high-throughput cell phenotyping (htCP) performed on control cells and 120 h after IL-3 depletion. Bars, 10 µm. Fractionation of FL5.12 Bcl-xL cells labeled with 14C to show the relative loss of different biomass components after IL-3 withdrawal (e).
Figure 3.
Figure 3.
The biophysical response of FL5.12 Bcl-xL cells to autophagy induction. Volume (a) and density (b) measurements of Torin-treated FL5.12 cells show a slight decrease in volume and a larger decrease in density. Time refers to time elapsed since Torin treatment. *, P < 9 × 10⁻³; **, P < 5 × 10⁻³²; N.S., no significance. Western blots of LC3 in FL5.12 cells treated with Torin (c) or withdrawn from IL-3 (d) over time. Note the conversion of the slower-migrating LC3-I to the more rapidly migrating, lipidated LC3 species, LC3-II, indicating induction of autophagy (c and d).
Figure 4.
Figure 4.
Changes in FL5.12 Bcl-xL cell metabolism after IL-3 depletion. IL-3 depletion causes decreases in glucose consumption rate (a), glutamine consumption rate (b), lactate production rate (c), and mitochondrial oxygen consumption rate (d). Glucose depletion leads to a decrease in viability in FL5.12 Bcl-xL cells exposed to IL-3, though not to cells depleted of IL-3 (e). *, P < 7.2 × 10⁻³; **, P < 2 × 10⁻⁴; ***, P < 10−4; N.S., no significance.
Figure 5.
Figure 5.
Biophysical response of CD8+ OT-1 cells to growth factor depletion. IL-2 depletion leads to a decrease in volume and increase in density in activated CD8+ cells (a and b). Exposure to IL-15 also leads to a decrease in volume and increase in density in activated CD8+ cells (c and d). *, P < 0.01; **, P < 8 × 10⁻⁴; ***, P < 5 × 10⁻¹⁸.

References

    1. Al-Habori M. 2001. Macromolecular crowding and its role as intracellular signalling of cell volume regulation. Int. J. Biochem. Cell Biol. 33:844–864. 10.1016/S1357-2725(01)00058-9 - DOI - PubMed
    1. Ayna G., Krysko D.V., Kaczmarek A., Petrovski G., Vandenabeele P., and Fésüs L.. 2012. ATP release from dying autophagic cells and their phagocytosis are crucial for inflammasome activation in macrophages. PLoS One. 7:e40069 10.1371/journal.pone.0040069 - DOI - PMC - PubMed
    1. Balkwill F.R., and Burke F.. 1989. The cytokine network. Immunol. Today. 10:299–304. 10.1016/0167-5699(89)90085-6 - DOI - PubMed
    1. Berard M., Brandt K., Bulfone-Paus S., and Tough D.F.. 2003. IL-15 promotes the survival of naive and memory phenotype CD8+ T cells. J. Immunol. 170:5018–5026. 10.4049/jimmunol.170.10.5018 - DOI - PubMed
    1. Bryan A.K., Hecht V.C., Shen W., Payer K., Grover W.H., and Manalis S.R.. 2014. Measuring single cell mass, volume, and density with dual suspended microchannel resonators. Lab Chip. 14:569–576. 10.1039/C3LC51022K - DOI - PMC - PubMed

Publication types

MeSH terms