. 2016 Feb 15;212(4):449-63.
doi: 10.1083/jcb.201509023.

Neuroligin 1 regulates spines and synaptic plasticity via LIMK1/cofilin-mediated actin reorganization

Affiliations

Neuroligin 1 regulates spines and synaptic plasticity via LIMK1/cofilin-mediated actin reorganization

An Liu et al. J Cell Biol. .

Abstract

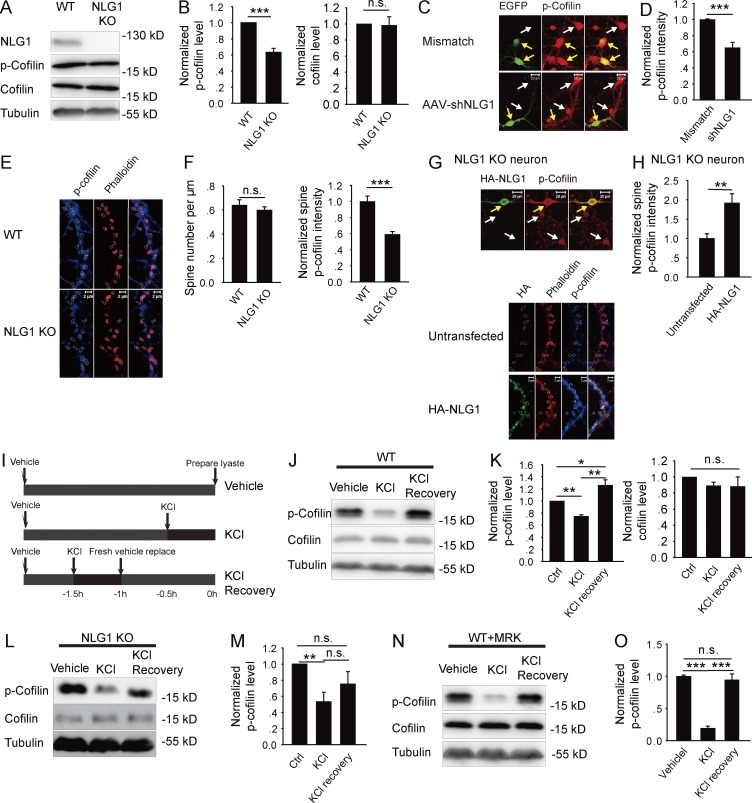
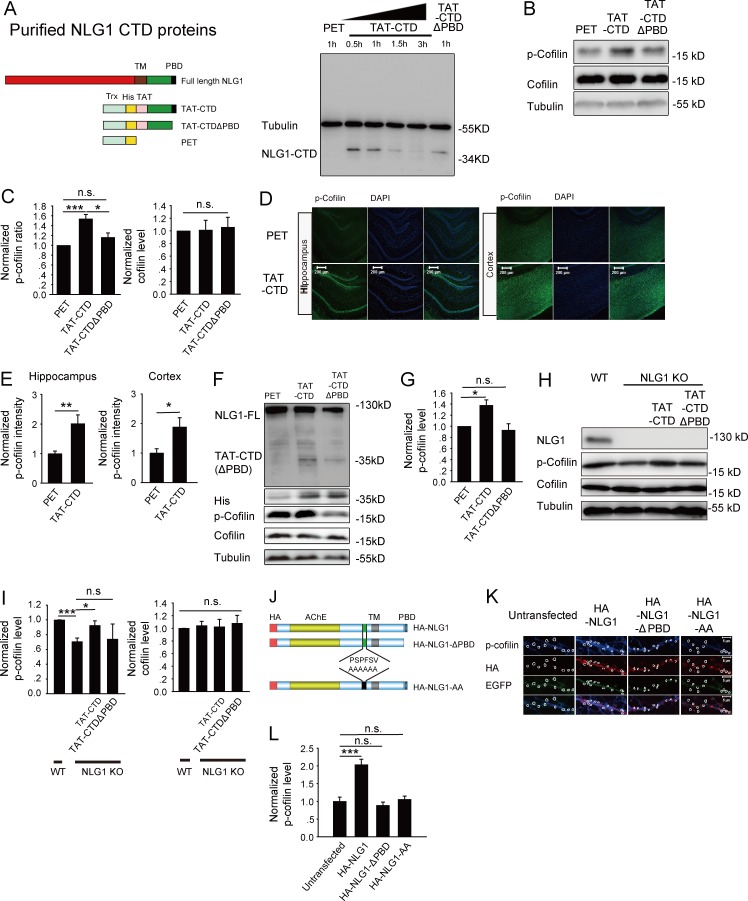
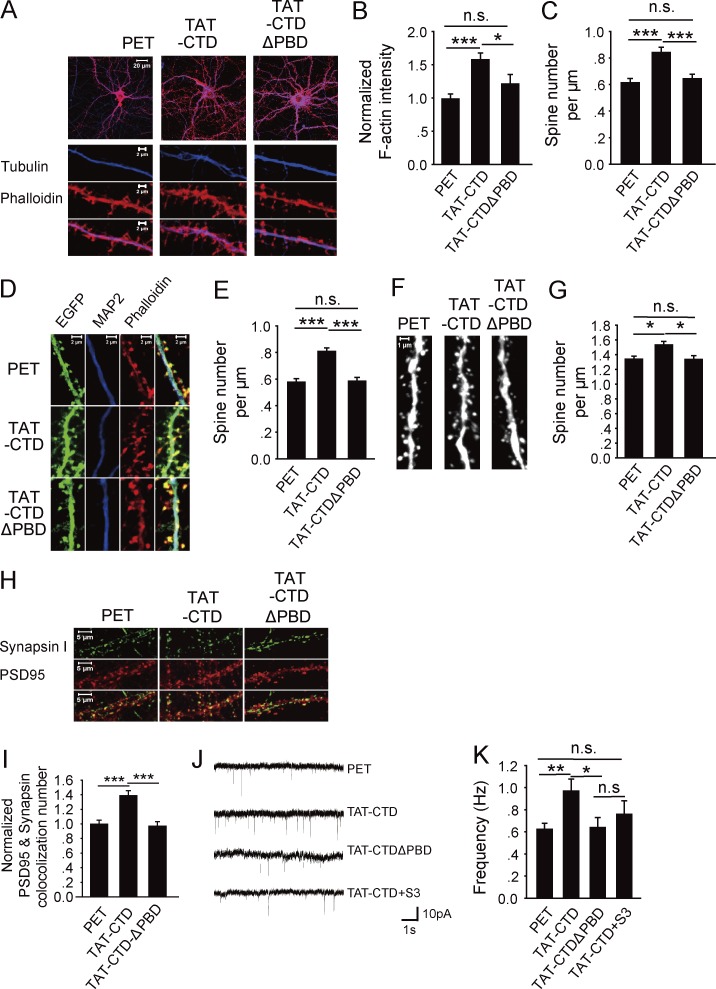
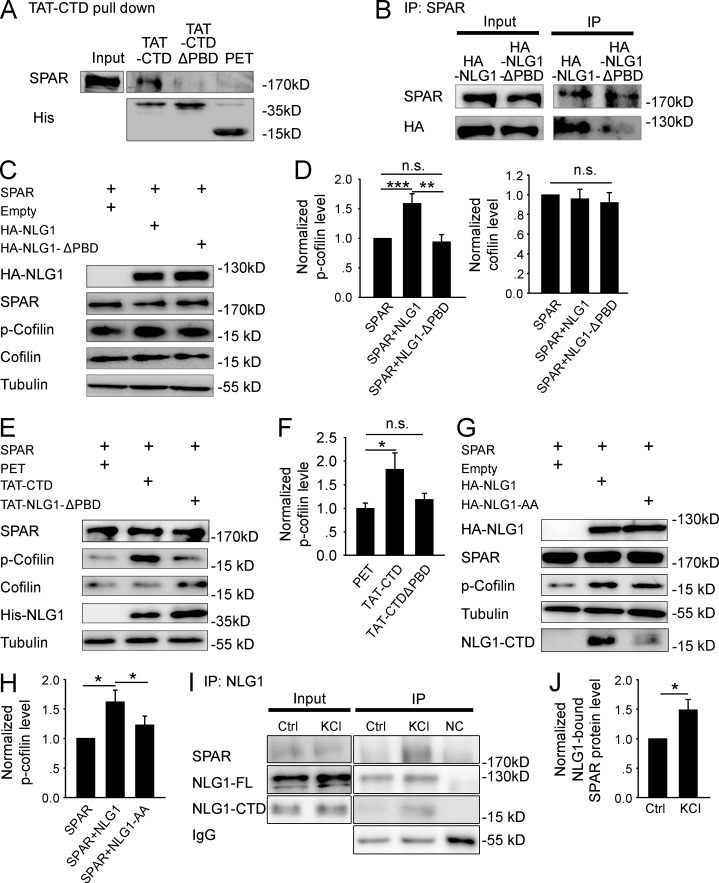
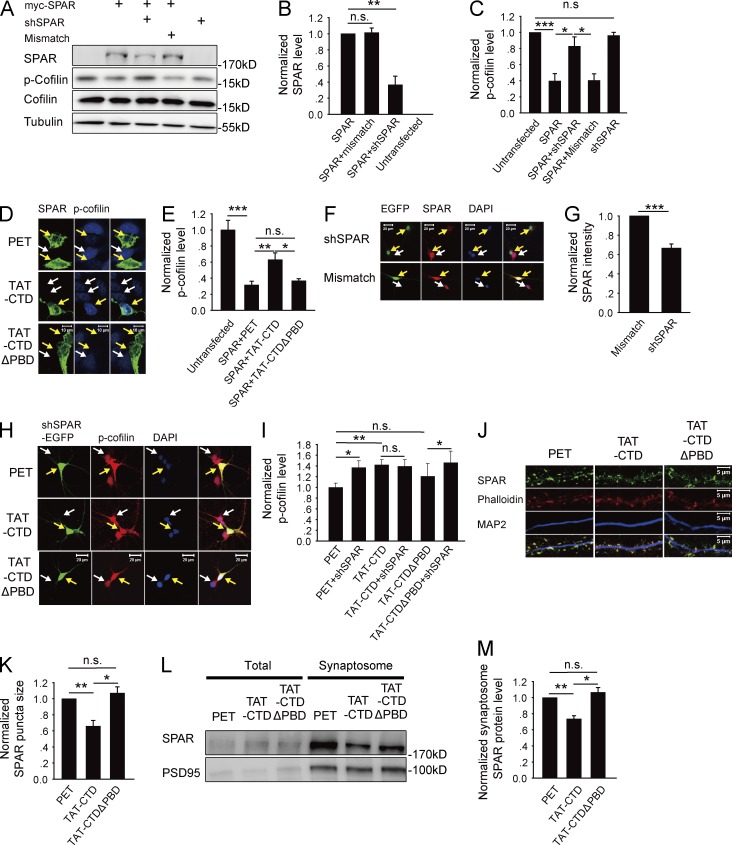
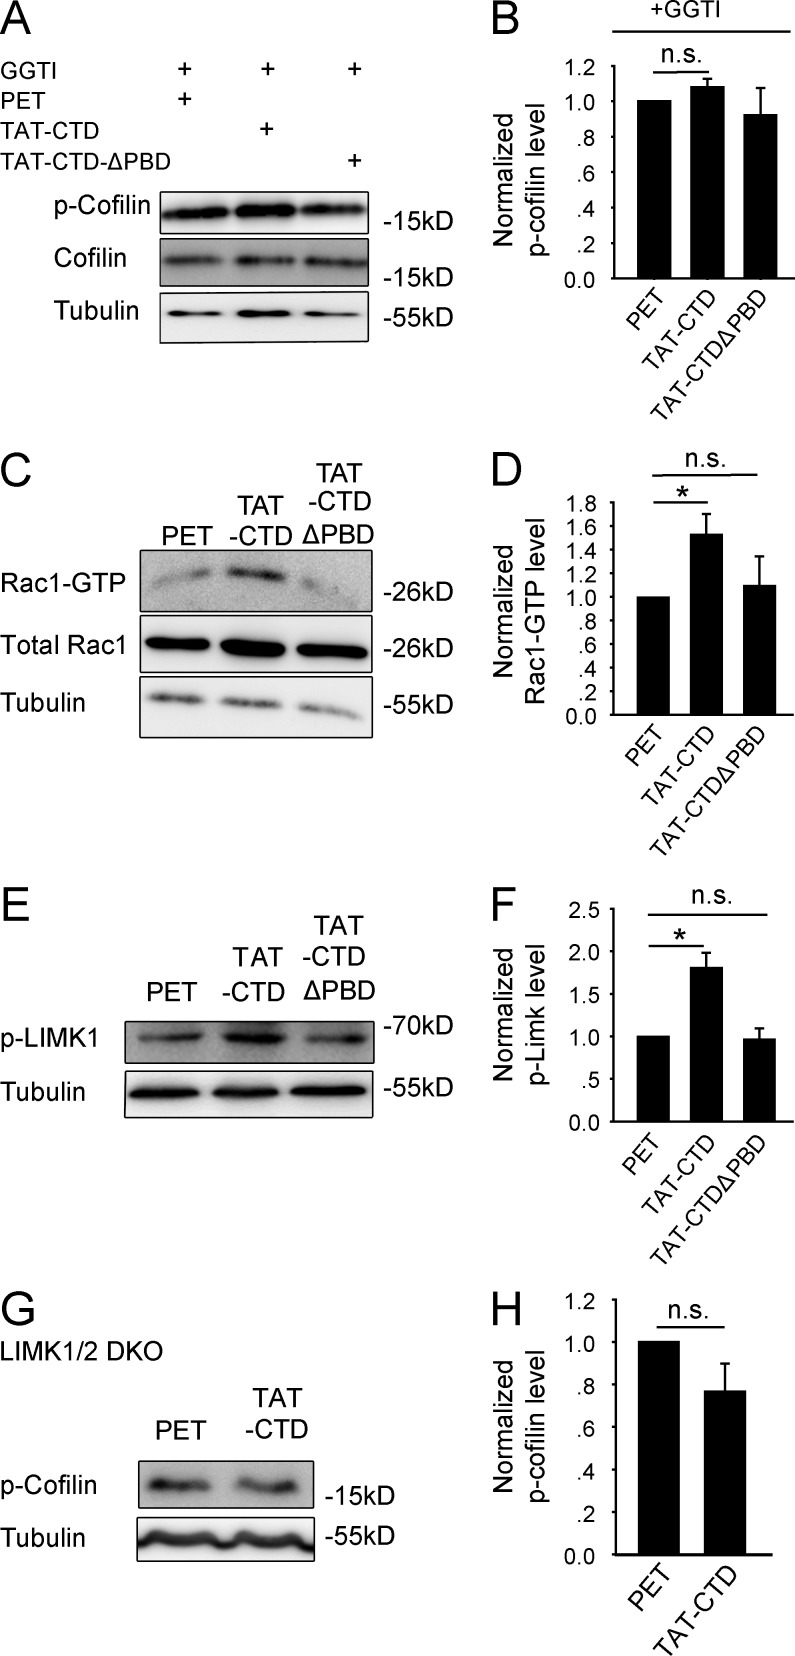
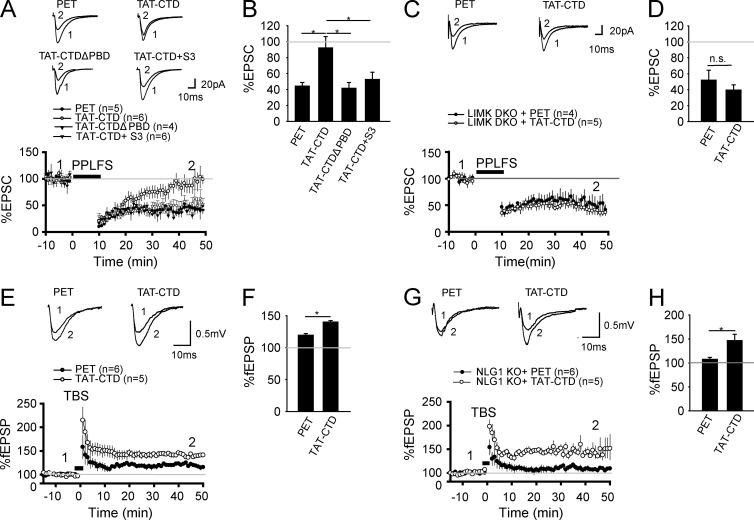
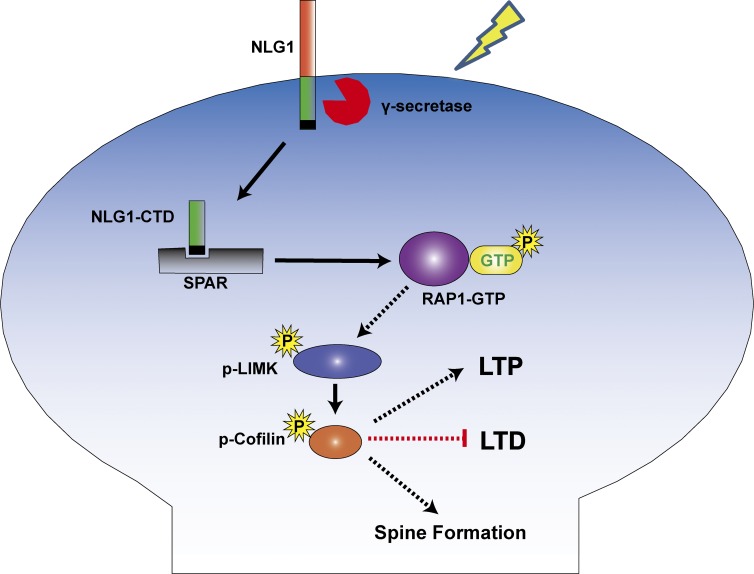
Neuroligin (NLG) 1 is important for synapse development and function, but the underlying mechanisms remain unclear. It is known that at least some aspects of NLG1 function are independent of the presynaptic neurexin, suggesting that the C-terminal domain (CTD) of NLG1 may be sufficient for synaptic regulation. In addition, NLG1 is subjected to activity-dependent proteolytic cleavage, generating a cytosolic CTD fragment, but the significance of this process remains unknown. In this study, we show that the CTD of NLG1 is sufficient to (a) enhance spine and synapse number, (b) modulate synaptic plasticity, and (c) exert these effects via its interaction with spine-associated Rap guanosine triphosphatase-activating protein and subsequent activation of LIM-domain protein kinase 1/cofilin-mediated actin reorganization. Our results provide a novel postsynaptic mechanism by which NLG1 regulates synapse development and function.


Figures

Figure 1.
Figure 1.
NLG1 is required for cofilin phosphorylation. (A) Western blots of whole brain lysate of NLG1 KO and WT mice with indicated antibodies. (B) Summary graphs of A showing a significant reduction in p-cofilin but not total cofilin in NLG1 KO compared with WT mice. (C) Cultured hippocampal neurons infected with NLG1-shRNA or control mismatch shRNA and stained for p-cofilin. Yellow arrows indicate infected neurons (green) and white arrows indicate noninfected neurons. Note reduced p-cofilin intensity in NLG1-shRNA–infected neuron compared with noninfected neuron (bottom). No differences between mismatch shRNA-infected neurons and noninfected neurons (top). (D) Summary graph of C showing significantly reduced p-cofilin in NLG1-shRNA–treated neurons. (E) Cultured hippocampal neurons of NLG1 KO and WT costained for spine (phalloidin) and p-cofilin (circled). (F) Summary graphs of E showing significantly decreased p-cofilin in NLG1 KO compared with WT neurons, without changes in spine number. (G) Cultured hippocampal neurons of NLG1 KO transfected with HA-NLG1 and costained for spine (phalloidin, circled) and p-cofilin. Yellow arrows indicate infected neurons; white arrows indicate noninfected neurons. (H) Summary graph of G showing significantly increased p-cofilin in HA-NLG1–transfected NLG1 KO compared with untransfected neurons. (I) Schematic graph of KCl (30 mM) treatment and recovery. (J) Western blots of protein lysate of WT brain slices immediately or 1 h after KCl treatment. (K) Summary graph of J showing a transient reduction in p-cofilin immediately after KCl treatment and a sustained increase in p-cofilin after the 1-h recovery period in WT brain slices. Ctrl, control. (L) Western blots of protein lysate of NLG1 KO brain slices immediately or 1 h after KCl treatment. (M) Summary graph of L showing significantly reduced p-cofilin right after KCl treatment and no significant increase in p-cofilin after the 1-h recovery period in NLG1 KO brain slices. (N) Western blots of protein lysate of WT brain slices pretreated with MRK (10 nM) followed by the KCl treatment showing a transient decrease in p-cofilin right after the KCl treatment. (O) Summary graph of N showing a transient reduction in p-cofilin after KCl treatment, but no increase in p-cofilin above the baseline after the 1-h recovery period in the presence of MRK in WT slices. n.s., not significant. *, P < 0.05; **, P < 0.01; ***, P < 0.001.
Figure 2.
Figure 2.
NLG1 CTD is sufficient to regulate cofilin activity. (A) Generation and purification of TAT-CTD, TAT-CTDΔPBD, and PET recombinant proteins. (left) Schematic graph of the full-length NLG1, TAT-NLG1CTD, TAT-CTDΔPBD, and PET. TM, transmembrane domain; PBD, PDZ binding domain; Trx, thioredoxin tag; His, 6× His tag; TAT, YGRKKRRQRRR. (right) Western blots of protein lysate of cultured neurons treated with TAT-CTD, TAT-CTDΔPBD, or PET for indicated time periods and probed with anti-His antibodies showing the accumulation of TAT-CTD and TAT-CTDΔPBD, but not PET inside the neurons. (B) Western blots of protein lysate of cultured neurons treated with various recombinant proteins. (C) Summary graph of B showing significantly increased p-cofilin, but not total cofilin, in neurons treated with TAT-CTD compared with those treated with TAT-CTDΔPBD or PET. (D) Hippocampal (left) and cortical (right) sections of the mice i.v. injected with TAT-CTD or PET and costained for p-cofilin and the nuclear marker DAPI. (E) Summary graph of D showing significantly increased p-cofilin in both hippocampus and cortex in mice treated with TAT-CTD. (F) Western blots of brain protein lysate from the mice injected with the recombinant proteins showing the presence of TAT-CTD and TAT-CTDΔPBD (as detected by anti-His and anti-NLG1 antibodies). (G) Summary graph of F showing significantly increased p-cofilin, but not total cofilin, in mice treated with TAT-CTD compared with those treated with TAT-CTDΔPBD or PET. (H) Western blots of protein lysate of WT and NLG1 KO brain slices treated with TAT-CTD or TAT-CTDΔPBD. (I) Summary graph of H showing rescued p-cofilin in NLG1 KO brain slices by TAT-CTD but not by TAT-CTDΔPBD treatment. (J) Schematic graph of full-length HA-tagged NLG1, HA-tagged NLG1ΔPBD, and HA-tagged NLG1-AA constructs. (K) Cultured hippocampal neurons transfected with HA-NLG, HA-NLG1ΔPBD, or HA-NLG1-AA and stained for spine p-cofilin (circled). (L) Summary graph of K showing significantly increased spine p-cofilin in HA-NLG1, but not in HA-NLG1ΔPBD– or HA-NLG1-AA–transfected neurons compared with untransfected neurons. n.s., not significant. *, P < 0.05; **, P < 0.01; ***, P < 0.001.
Figure 3.
Figure 3.
NLG1 CTD is sufficient to regulate spine and synapse growth. (A) Cultured hippocampal neurons treated with the recombinant proteins and costained for F-actin (phalloidin) and tubulin. (B) Summary graph of A showing significantly increased F-actin in TAT-CTD compared with TAT-CTDΔPBD– or PET-treated neurons. (C) Summary graph of A showing significantly increased spine number in TAT-CTD compared with TAT-CTDΔPBD– or PET-treated neurons. (D) Cultured hippocampal neurons infected with the AAV-EGFP virus, treated with various recombinant proteins, and stained for F-actin and microtubule-associated protein 2 (MAP2). (E) Summary graph of D showing significantly increased spine number in TAT-CTD compared with TAT-CTDΔPBD– or PET-treated neurons. (F) CA1 dendritic spines of brain sections prepared from the Thy1-YFP transgenic mice i.v. injected with PET, TAT-CTD, or TAT-CTDΔPBD. (G) Summary graph of F showing significantly increased spine density in mice treated with TAT-CTD compared with those treated with PET or TAT-CTDΔPBD. (H) Cultured hippocampal neurons treated with the recombinant proteins and costained for synapsin I and PSD95. (I) Summary graph of H showing significantly increased synapsin I/PSD95 colocalization puncta in TAT-CTD compared with TAT-CTDΔPBD– or PET-treated neurons. (J) Sample traces of mEPSC whole-cell recordings of CA1 neurons of hippocampal slices treated with the recombinant proteins. (K) Summary graph of J showing significantly increased frequency of mEPSC in TAT-CTD compared with PET-, TAT-CTDΔPBD–, or TAT-CTD+S3 peptide–treated neurons. n.s., not significant. *, P < 0.05; **, P < 0.01; ***, P < 0.001.
Figure 4.
Figure 4.
NLG1 CTD regulates cofilin phosphorylation through interaction with SPAR. (A) Western blots of pull-down experiments of brain lysate showing that TAT-CTD, but not TAT-CTDΔPBD or PET, could pull down SPAR. (B) Western blots of anti-SPAR immunoprecipitates using protein lysate of HEK293 cells cotransfected with myc-SPAR plus HA-NLG1 or HA-NLG1ΔPBD showing that HA-NLG1, but not HA-NLG1-ΔPBD, was coimmunoprecipitated with SPAR. (C) Western blots of protein lysate of HEK293 cells cotransfected with myc-SPAR and HA-NLG1 or HA-NLG1ΔPBD. (D) Summary graphs of C showing significantly increased p-cofilin, but not total cofilin, in HEK293 cells cotransfected with myc-SPAR and HA-NLG1, compared with those transfected with myc-SPAR and HA-NLG1ΔPBD or with myc-SPAR alone. n.s., not significant. (E) Western blots of protein lysate of myc-SPAR–transfected HEK293 cells treated with the recombinant proteins. (F) Summary graph of E showing significantly increased p-cofilin in TAT-CTD, compared with TAT-CTDΔPBD– or PET-treated HEK293 cells pretransfected with myc-SPAR. n.s., not significant. (G) Western blots of protein lysate of HEK293 cells cotransfected with myc-SPAR plus HA-NLG1 or HA-NLG1-AA. (H) Summary graph of G showing significantly higher p-cofilin in myc-SPAR and HA-NLG1–cotransfected HEK293 cells compared with myc-SPAR and HA-NLG1-AA cotransfections. (I) Western blots of anti-NLG1 immunoprecipitates of hippocampal slices with or without KCl treatment. NC, negative IP control with rabbit IgG. (J) Summary graph of I showing significantly increased NLG1-bound SPAR after KCl treatment. Ctrl, control. *, P < 0.05; **, P < 0.01; ***, P < 0.001.
Figure 5.
Figure 5.
SPAR inhibits cofilin phosphorylation. (A) Western blots of protein lysate of HEK293 cells cotransfected with myc-SPAR and/or SPAR-shRNA. (B) Summary graphs of A showing reduced SPAR protein by SPAR-shRNA compared with myc-SPAR transfection alone or cotransfection with control mismatch shRNA. (C) Summary graph of A showing significantly decreased p-cofilin in myc-SPAR–transfected compared with untransfected cells. SPAR knockdown rescued the effect of myc-SPAR (i.e., increased p-cofilin). (D) Immunostaining of cultured HEK293 cells transfected with myc-SPAR (green) and treated with various recombinant proteins. Arrows indicate transfected and untransfected cells. (E) Summary graph of D showing significantly decreased p-cofilin in myc-SPAR–transfected compared with untransfected cells and that TAT-CTD, but not TAT-CTDΔPBD, or PET treatment rescued this decrease. n.s., not significant. (F) Immunostaining of cultured hippocampal neurons transfected with SPAR-shRNA or mismatch control (green). Arrows indicate neurons. (G) Summary graph of F showing significantly reduced SPAR protein in SPAR-shRNA–transfected compared with mismatch-transfected neurons. (H) Immunostaining of cultured hippocampal neurons transfected with SPAR-shRNA (green) and treated with various recombinant proteins, showing that either SPAR knockdown or TAT-CTD treatment was sufficient to increase p-cofilin. Arrows indicate transfected (green) and adjacent untransfected neurons. Note that in PET- and TAT-CTDΔPBD–treated groups, the transfected neuron has higher p-cofilin than the untransfected neuron, and in the TAT-CTD–treated group, all neurons have increased p-cofilin. (I) Summary graph of H showing that knockdown of SPAR or TAT-CTD treatment was sufficient to enhance p-cofilin. (J) Immunostaining of cultured hippocampal neurons treated with the recombinant proteins and costained for SPAR, F-actin, and microtubule-associated protein 2 (MAP2). (K) Summary graph of J showing significantly reduced spine SPAR (punctum size), but not total SPAR in TAT-CTD compared with TAT-CTDΔPBD– or PET-treated neurons. (L) Western blots of total protein lysate and synaptosomal fraction of cultured neurons treated with various recombinant proteins. (M) Summary graph of L showing significantly reduced synaptosomal SPAR by TAT-CTD but not by TAT-CTDΔPBD or PET. n.s., not significant. *, P < 0.05; **, P < 0.01; ***, P < 0.001.
Figure 6.
Figure 6.
NLG1 CTD induces cofilin phosphorylation via Rap1/LIMK1 pathway. (A) Western blots of protein lysate of cultured neurons treated with GGTI and various recombinant proteins. (B) Summary graph of A showing similar p-cofilin in TAT-CTD–, TAT-CTDΔPBD–, and PET-treated neurons. (C) Western blots of GTP-bound Rac1 of protein lysate of cultured neurons treated with various recombinant proteins. (D) Summary graph of C showing significantly elevated GTP-Rac1 in neurons treated with TAT-CTD compared with those treated with TAT-CTDΔPBD or PET. (E) Western blots of p-LIMK1 using protein lysate of cultured cortical neurons treated with various recombinant proteins. (F) Summary graph of E showing significantly increased p-LIMK1 in TAT-CTD compared with TAT-CTDΔPBD– or PET-treated neurons. *, P < 0.05. (G) Western blots of protein lysate of LIMK1/2 double-KO brain slices treated with TAT-CTD or PET recombinant proteins. (H) Summary graph of G showing similar p-cofilin in TAT-CTD– and PET-treated LIMK1/2 double-KO brain slices. n.s., not significant.
Figure 7.
Figure 7.
NLG1 CTD inhibits LTD and facilitates LTP. (A) Whole-cell recordings of CA1 neurons of WT hippocampal slices pretreated with the recombinant proteins showing that TAT-CTD, but not PET or TAT-CTDΔPBD, blocked PP-LFS–induced LTD. TAT-CTD failed to block LTD when the S3 peptide was included in the recording electrode (TAT-CTD + S3). (B) Summary graph of A showing significant differences in PP-LFS–induced LTD between TAT-CTD and PET, TAT-CTDΔPBD, or TAT-CTD + S3–treated slices. (C) Whole-cell recordings of CA1 neurons of LIMK1/2 double-KO hippocampal slices pretreated with TAT-CTD or PET showing that TAT-CTD failed to block PP-LFS–induced LTD in these mice. (D) Summary graph of C showing similar LTD in TAT-CTD– and PET-treated slices of LIMK1/2 double-KO mice. n.s., not significant. (E) Field recordings in the CA1 region of WT hippocampal slices pretreated with TAT-CTD or PET showing that TAT-CTD enhanced TBS-induced LTP compared with PET. (F) Summary graph of E showing significantly higher LTP in TAT-CTD compared with PET-treated slices. (G) Field recordings of NLG1 KO hippocampal slices pretreated with TAT-CTD or PET showing that TAT-CTD enhanced TBS-induced LTP compared with PET. (H) Summary graph of G showing significantly higher LTP in TAT-CTD compared with PET-treated slices. *, P < 0.05.
Figure 8.
Figure 8.
Summary model. The CTD of NLG1, released from either proteolytically cleaved surface NLG1 or internalized NLG1, binds to and removes SPAR from the synapse, resulting in activation of Rap1/Rac1, which in turn stimulates LIMK1. The activated LIMK1 phosphorylates cofilin and promotes actin assembly, which facilitates spine/synapse formation/LTP and inhibits LTD.

Comment in

Similar articles

Cited by

References

    1. Aizawa H., Wakatsuki S., Ishii A., Moriyama K., Sasaki Y., Ohashi K., Sekine-Aizawa Y., Sehara-Fujisawa A., Mizuno K., Goshima Y., and Yahara I.. 2001. Phosphorylation of cofilin by LIM-kinase is necessary for semaphorin 3A-induced growth cone collapse. Nat. Neurosci. 4:367–373. 10.1038/86011 - DOI - PubMed
    1. Asrar S., and Jia Z.. 2013. Molecular mechanisms coordinating functional and morphological plasticity at the synapse: role of GluA2/N-cadherin interaction-mediated actin signaling in mGluR-dependent LTD. Cell. Signal. 25:397–402. 10.1016/j.cellsig.2012.11.007 - DOI - PubMed
    1. Baksh M.M., Dean C., Pautot S., DeMaria S., Isacoff E., and Groves J.T.. 2005. Neuronal activation by GPI-linked neuroligin-1 displayed in synthetic lipid bilayer membranes. Langmuir. 21:10693–10698. 10.1021/la051243d - DOI - PMC - PubMed
    1. Bamburg J.R. 1999. Proteins of the ADF/cofilin family: essential regulators of actin dynamics. Annu. Rev. Cell Dev. Biol. 15:185–230. 10.1146/annurev.cellbio.15.1.185 - DOI - PubMed
    1. Baudouin S.J., Gaudias J., Gerharz S., Hatstatt L., Zhou K., Punnakkal P., Tanaka K.F., Spooren W., Hen R., De Zeeuw C.I., et al. . 2012. Shared synaptic pathophysiology in syndromic and nonsyndromic rodent models of autism. Science. 338:128–132. 10.1126/science.1224159 - DOI - PubMed

MeSH terms