. 2016 Mar;65(3):341-54.
doi: 10.1007/s00262-016-1808-7. Epub 2016 Feb 15.

Requirement of interleukin 7 signaling for anti-tumor immune response under lymphopenic conditions in a murine lung carcinoma model

Affiliations

Requirement of interleukin 7 signaling for anti-tumor immune response under lymphopenic conditions in a murine lung carcinoma model

Toshihiro Suzuki et al. Cancer Immunol Immunother. 2016 Mar.

Abstract

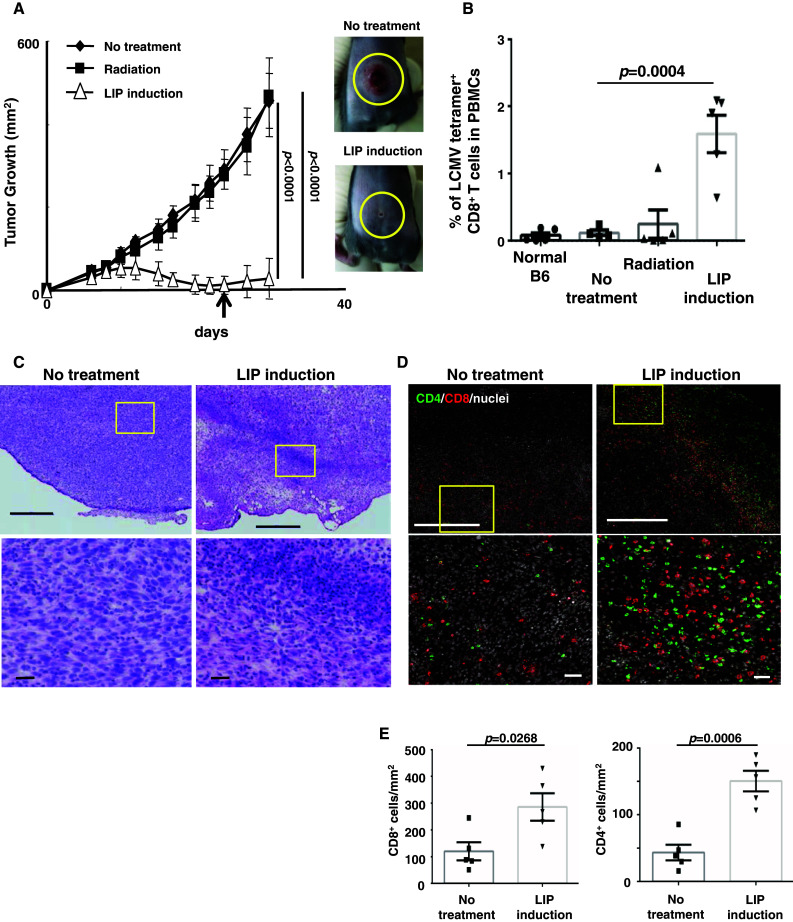
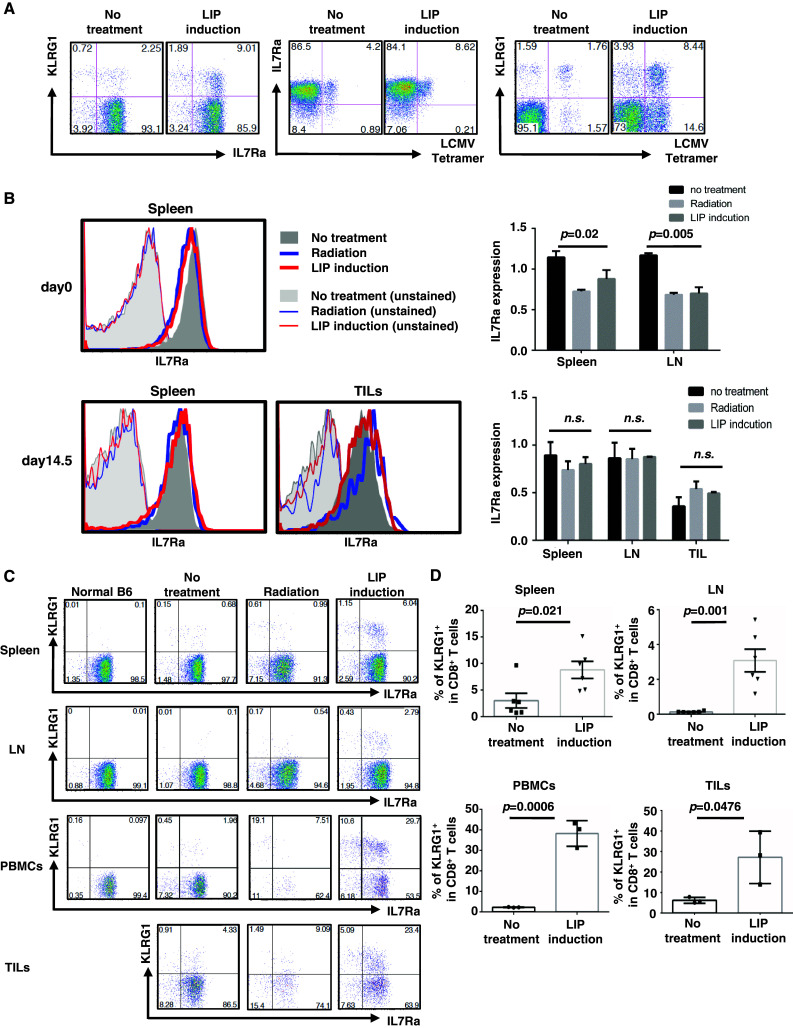
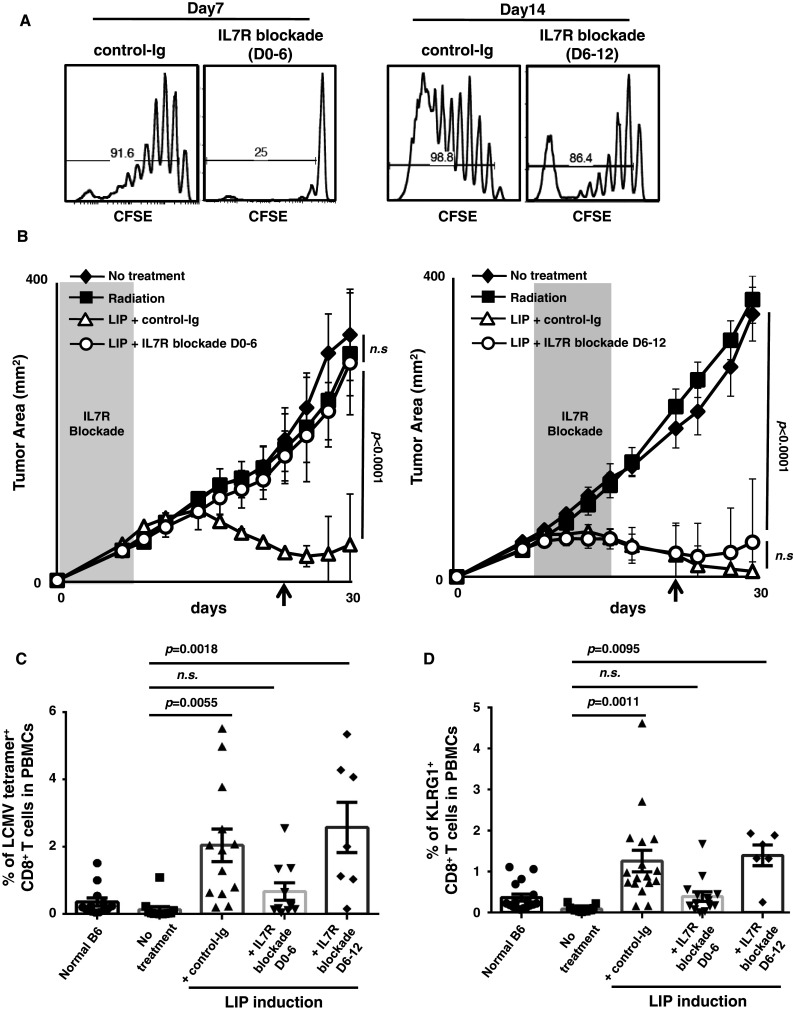
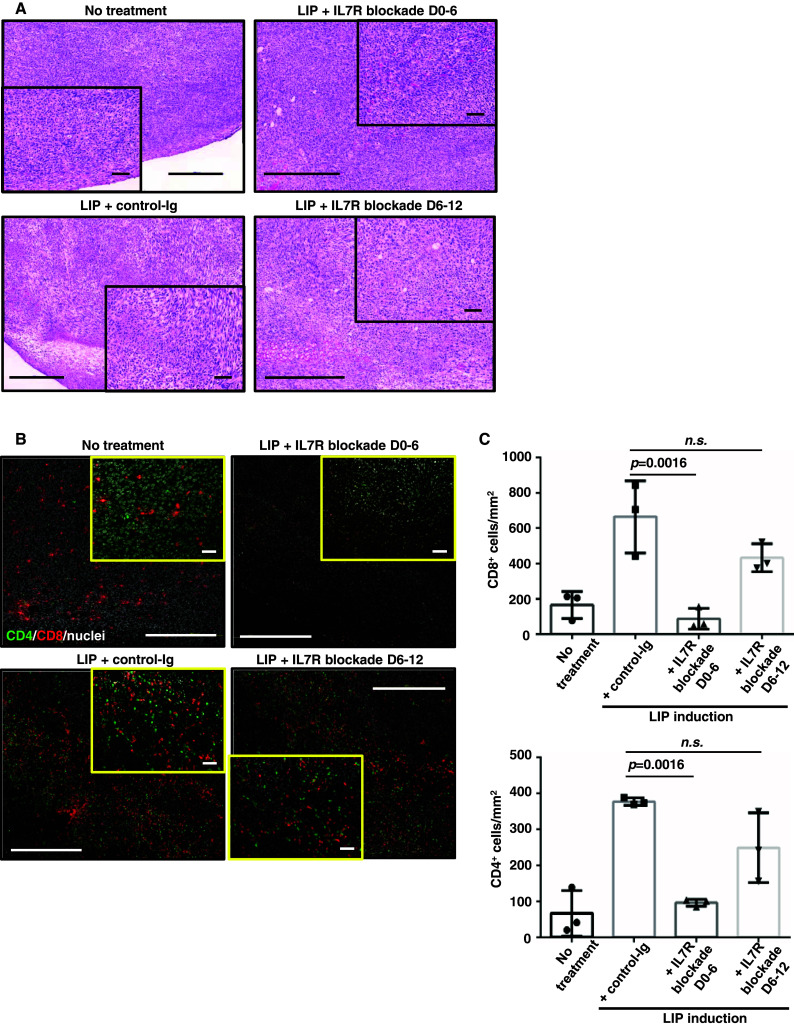
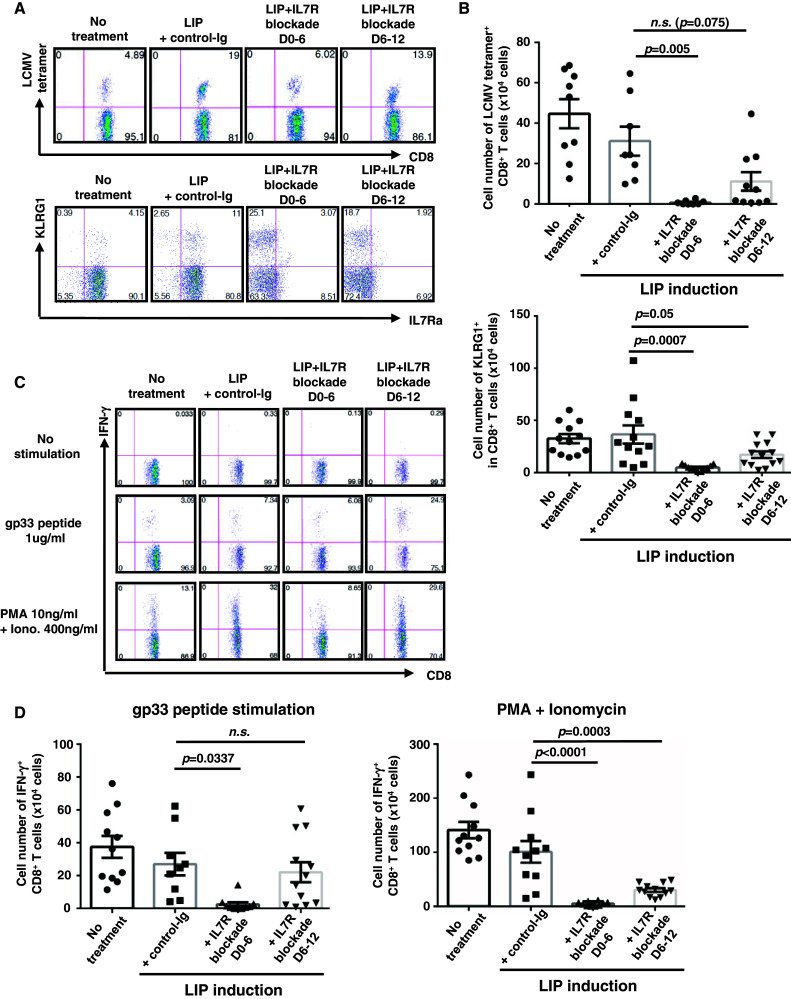
Induction of lymphopenia before adoptive transfer of T cells was followed by lymphopenia-induced proliferation (LIP) and generated a potent anti-tumor immune response in rodents and in a clinical setting. Previously, we reported that CD28 signaling is essential for the differentiation of functional effector cytotoxic T lymphocytes (CTLs) under lymphopenic conditions and sequential LIP of T cells. In this study, to clarify the correlation between LIP and the anti-tumor effect, LIP was inhibited with interleukin 7 (IL7) receptor blockade at various stages, and the anti-tumor effect then assessed. We confirmed that IL7 signaling at the start of LIP is crucial for the anti-tumor immune response. In contrast, continuous IL7 signaling was not required for tumor regression, although LIP of naïve CD8+ T cells is usually regulated by IL7. The expansion and migration of CTLs in lymphopenic hosts depend on IL7 signaling during the induction phase. Here, we propose that IL7 signaling and subsequent LIP of T cells have distinct roles in the induction of T cell immunity during lymphopenia.

Keywords: Anti-tumor immune response; CD28; Interleukin 7; Lymphopenia-induced proliferation; Priming and induction of CTLs.


Conflict of interest statement

The authors declare no conflict of interest.

Figures

Fig. 1
Fig. 1
During LIP, CTL precursors preferentially expand and migrate into tumor tissues, resulting in tumor regression. a Tumor growth was significantly suppressed by LIP. To eliminate host lymphocytes, on day 0, mice were sub-lethally irradiated and then injected with 1 × 106 LLC-gp33 cells (black squares). Some mice were also injected with 2 × 107 splenocytes (white triangles). Black diamonds indicate the no-treatment group. Bars SD based on the results of 3 mice from 4 repeated experiments. Photographs show the tumor mass at 30 days in no-treatment (upper panel) or LIP-induced hosts (lower panel). b CTL precursors expanded in lymphopenic hosts. The percentage of LCMV tetramer+ CD8+ T cells in PBMCs were monitored by FACS, 24 days after LIP induction (a an arrow). Bars in a, b SE based on the results of 5 mice from 2 independent experiments. The p values in the graphs indicate the statistical significance of the difference between the no-treatment group and the LIP induction group. c, d Tumor tissues were harvested from no-treatment or LIP-induced hosts 15 days after LIP induction. Frozen sections of tumor tissues were fixed and analyzed by H&E (c) and IHC staining (d). The images show the representative data of tumor tissue in 5 mice from 2 independent experiments. Lower photographs show an enlarged view of the yellow square in upper photographs. Scale bar upper figures, 500 μm; lower figures, 50 μm. e The graphs indicate the numbers of tumor-infiltrating CD8+ (left graph) and CD4+ (right graph) cells per mm2 in tumor tissues shown in Fig. 1d. The p values in the graph indicate the level of statistical significance between the no-treatment and LIP induction groups. Bars SE based on results of 5 mice from 2 independent experiments
Fig. 2
Fig. 2
CTL precursors maintained IL7Rα expression in tumor-bearing host, and IL7Rα+ KLRG1+ effector cells accumulated in lymphatic and tumor tissue, accompanied by LIP. Splenocytes, LN, TILs, and PBMCs were recovered at 4 h or 15 days after treatment, and phenotype was analyzed. a Phenotype of CD8+ T cells in spleen. b Expression of IL7Rα on CD8+ T cells at the indicated time points (histograms on left). IL7Rα expression is reported as the geometric mean of IL7Rα on CD8+ T cells, relative to normal age-matched mice (right graphs). The p values in the graph indicate the statistical significance between the no-treatment and LIP induction groups. Bars SD; 3 mice per experiment. c, d The percentage of the KLRG1+ population in CD8+ T cells is shown in each dot plot (c) and right graph (d). The p values in the graph indicate the statistical significance of the difference between the no-treatment group and the LIP induction group. Bars on the graphs show SE for 6 mice (spleen and LN) or 3 mice (PBMCs and TILs) from 2 independent experiments
Fig. 3
Fig. 3
Early IL7 signaling is required to induce the LIP-associated anti-tumor effect. a Both early and late IL7R blockade inhibited the LIP of naïve CD8+ T cells. Host mice were sub-lethally irradiated and then adoptively transferred with CFSE-labeled purified CD44low CD8+ T cells. To block IL7R, anti-mIL7Ra mAb was administrated at day 0–6 (D0–6; early) or day 6–12 (D6–12; later). Mice were killed at day 7 (left two histograms) or day 14 (right two histograms), and the division of donor CD8+ T cells was analyzed by CFSE decay. b Blocking of IL7 signaling in the early phase, but not the late phase of LIP, blocked the anti-tumor effect. C57BL/6 mice were sub-lethally irradiated and then injected with LLC-gp33 cells (black squares). Some mice also received 4 × 106 T cells to induce LIP and were then treated with control-Ig (white triangles). To block the IL7 signal, anti-IL7Rα mAb was administered every other day (white circles), either D0–6 (left graph), or D6–12 (right graph). The shaded area in each graph indicates the period of IL7R blockade. The no-treatment group is indicated by black diamonds. Bars SD of the number obtained from 3 or 5 mice in one of several experiments. Left graph (IL7R blockade D0–6); 8 repeated experiments with n = 3. Right graph (IL7R blockade D6–12); 2 independent experiments with n = 5. c, d IL7R blockade during the induction of LIP (D0–6) limited the expansion of CTL precursors, but later blockade (D6–12) did not. The percentage of LCMV tetramer+ (c) and KLRG1+ (d) CD8+ T cells in PBMCs 24 days after LIP induction (b arrows) were monitored. Bars SE based on the results of 7 to 13 mice from 5 independent experiments. The p values in the graphs indicate the statistical significance of the difference between the no-treatment group and each treatment
Fig. 4
Fig. 4
The number of TILs decreases when IL7 signaling is blocked. Tumor tissue recovered from mice 14–16 days post-inoculation, for no-treatment, LIP induction with control-Ig, LIP induction with IL7R blockade D0–6, and LIP induction with IL7R blockade D6–12. Tissue sections were treated as described in Fig. 1. The images show representative tumor tissue from 3 independent experiments with n = 3. Inset photographs show high-magnification views of main photographs. Scale bar main figures, 500 μm; insets, 50 μm. a H&E staining of tumor tissues. b IHC staining of CD4+ and CD8+ cells. c The graphs indicate the numbers of tumor-infiltrating CD8+ (upper graph) and CD4+ (lower graph) cells per mm2 in tumor tissue. The p values in each graph indicate statistical significance of the difference between control-Ig and each group with an IL7R blockade in the LIP-induced hosts. Bars SD based on the results of 3 mice in one of 3 independent experiments
Fig. 5
Fig. 5
LIP of donor CD8+ T cells driven by IL7 signaling is crucial to the expansion of antigen-specific CTL precursors, rather than the induction of CTLs. The experimental procedure used was similar to that described in the legend to Fig. 3. On days 14–16, splenocytes were recovered from each treatment group and analyzed by FACS. For ICS of IFN-γ, splenocytes were either unstimulated, stimulated with gp33 peptide, or stimulated with PMA and Ionomycin, in the presence of monensin. a Percentage of LCMV tetramer + and KLRG1+ early effector precursor CD8+ T cells. b Numbers of LCMV tetramer+ (upper graph) or KLRG1+ (lower graph) CD8+ T cells. c Production of IFN-γ+ in CD8+ T cells. d Numbers of IFN-γ+ CD8+ T cells stimulated with gp33 peptide (left panel) or PMA + Ionomycin (right panel). Bars SE based on the results of 11–12 mice from 4 independent experiments. The p values in the graph indicate the statistical significance of the difference between control-Ig and each group with IL7R blockade in LIP-induced hosts

Similar articles

Cited by

References

    1. Baccala R, Theofilopoulos AN. The new paradigm of T-cell homeostatic proliferation-induced autoimmunity. Trends Immunol. 2005;26(1):5–8. doi: 10.1016/j.it.2004.11.006. - DOI - PubMed
    1. Murali-Krishna K, Ahmed R. Cutting edge: naive T cells masquerading as memory cells. J Immunol. 2000;165(4):1733–1737. doi: 10.4049/jimmunol.165.4.1733. - DOI - PubMed
    1. Cho BK, Rao VP, Ge Q, Eisen HN, Chen J. Homeostasis-stimulated proliferation drives naive T cells to differentiate directly into memory T cells. J Exp Med. 2000;192(4):549–556. doi: 10.1084/jem.192.4.549. - DOI - PMC - PubMed
    1. Datta S, Sarvetnick N. Lymphocyte proliferation in immune-mediated diseases. Trends Immunol. 2009;30(9):430–438. doi: 10.1016/j.it.2009.06.002. - DOI - PubMed
    1. Surh CD, Boyman O, Purton JF, Sprent J. Homeostasis of memory T cells. Immunol Rev. 2006;211:154–163. doi: 10.1111/j.0105-2896.2006.00401.x. - DOI - PubMed

Publication types